. 2024 Sep 1;4(9):2399-2414.
doi: 10.1158/2767-9764.CRC-24-0360.

Targeting TREX1 Induces Innate Immune Response in Drug-Resistant Small-Cell Lung Cancer

Affiliations

Targeting TREX1 Induces Innate Immune Response in Drug-Resistant Small-Cell Lung Cancer

Takahiko Murayama et al. Cancer Res Commun. .

Abstract

Small-cell lung cancer (SCLC) is the most lethal type of lung cancer. Paradoxically, this tumor displays an initial exquisite response to chemotherapy; however, at relapse, the tumor is highly resistant to subsequent available therapies. Here, we report that the expression of three prime repair exonuclease 1 (TREX1) is strongly induced in chemoresistant SCLCs. Assay for transposase-accessible chromatin using sequencing and chromatin immunoprecipitation sequencing revealed a significant increase in chromatin accessibility and transcriptional activity of TREX1 gene locus in chemoresistant SCLCs. Analyses of human SCLC tumors and patient-derived xenografts (PDX) also showed an increase in TREX1 expression in postchemotherapy samples. TREX1 depletion caused the activation of cyclic GMP-AMP synthase stimulator of interferon gene pathway due to cytoplasmic accumulation of damage-associated double-stranded DNA, inducing immunogenicity and enhancing the sensitivity of drug-resistant cells to chemotherapy. These findings suggest TREX1 upregulation may partially contribute to the survival of resistant cells, and its inhibition may represent a promising therapeutic strategy to enhance antitumor immunity and potentiate the efficacy of chemotherapy and/or immunotherapy in chemoresistant SCLCs. Significance: In this study, we show that targeting TREX1 induces an innate immune response and resensitizes SCLC cells to chemotherapy, representing a promising novel target for "immunologically" cold tumors, such as SCLC.


Conflict of interest statement

N.R. Mahadevan reports ownership of stocks in AstraZeneca and Roche. E.H. Knelson reports personal fees from Merck & Co outside the submitted work. Y.P. Hung reports personal fees from Elsevier and the American Society of Clinical Pathology outside the submitted work. A.N. Hata reports grants and personal fees from Amgen; grants from BridgeBio, Bristol Myers Squibb, C4 Therapeutics, Eli Lilly, and Novartis; grants and personal fees from Nuvalent and Pfizer; grants from Scorpion Therapeutics; and personal fees from Engine Biosciences, Oncovalent, TigaTx, and Tolremo Therapeutics outside the submitted work. D.A. Barbie reports personal fees from Qiagen/N of One, other support from Xsphera Biosciences, grants from Gilead Sciences and Novartis, and personal fees from Nerviano Medical Sciences during the conduct of the study. No disclosures were reported by the other authors.

Figures
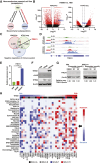
Figure 1
Figure 1
TREX1 expression is induced in drug-resistant SCLC cell lines. A, Schematic of establishment of subpopulations from H69 SCLC cell line. B, Volcano plots of H3K27Ac ChIP-seq and ATAC-seq analyses comparing H69AR and H69 cells are shown. C, Venn diagrams for top-hits genes of H3K27Ac ChIP-seq and ATAC-seq, and genes listed in “GOBP_NEGATIVE_REGULATION_OF_IMMUNE_SYSTEM_PROCESS.” TREX1 was selected as one of the eight overlapped genes. D, ATAC-seq and H3K27Ac ChIP-seq analysis to compare H69, H69M, and H69AR cells. Results of the TREX1 gene region are shown. E, Expression levels of the TREX1 gene in H69, H69M, and H69AR cells were compared by qPCR (mean ± SEM; n = 3). F, Expression levels of TREX1, cGAS, and STING in H69, H69M, and H69AR cells were compared by immunoblotting. G, Expression levels of TREX1 in H69, DMS114 cells treated with etoposide (20 or 50 µmol/L) or DMSO were compared by immunoblotting. H, Drug sensitivity/resistance data of SCLC cell lines are summarized. Cells are lined up based on TREX1 expression levels. Data represent mean ± SEM. ns, not significant; *, P < 0.05; **, P < 0.01; ***, P < 0.001; ****, P < 0.0001 by one-way ANOVA followed by Dunnett’s multiple comparisons test (E).
Figure 2
Figure 2
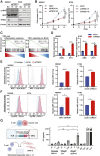
TREX1 depletion suppresses SCLC growth and induces IFN response. A, Expression levels of TREX1, IRF3, and p-IRF3 in H69AR and H196 were compared by immunoblotting between cells transduced with Scr and sgTREX1 (#1 and #2). B, Growth curves of H69AR and H196 cells were compared between siCtrl and siTREX1 (#1 and #2; mean ± SEM; n = 3). C, GSEA analysis with H (hallmark) gene sets, based on RNA-seq results of siTREX1 vs. siCtrl H69AR cells. D, Expression levels of IFNB and IFIT1 genes in cells transfected with siCtrl and siTREX1 (#1) were compared by qPCR (mean ± SEM; n = 3). E and F, HLA-A, HLA-B, and HLA-C (E) and PDL1 (F) expressions in H69AR and H196 cells transfected with siCtrl or siTREX1 were compared by flow cytometry analysis. Data are representative of three independent experiments (Left). Mean fluorescence intensity was quantified by FlowJo (Right; n = 3). Cells were analyzed 3 days after siRNA transfection. G, (Left) Schematic of cancer cell–T-cell coculture, performed at a stimulator/responder (S/R) ratio of 1:1. (Right) IL2 secretion from 72 hours cocultures of RPP-A-EtopR (Scr or sgTrex1) or parental RPP-A cells ± 24-hour IFNγ (100 ng/mL) stimulation and no (nil), parental untransduced BW5147.3 (P), or Trav14D-3-DV8; Trbv29 transgenic BW5147.3 (TCR) T cells. BW (−/+) and TCR (−/+) bars represent P or TCR T cells alone without (−) or with (+) PMA (50 nmol/L) and ionomycin (1 μg/mL). ^, above assay threshold of detection (mean ± SEM; n = 4). Data represent mean ± SEM. ns, not significant; *, P < 0.05; **, P < 0.01; ***, P < 0.001; ****, P < 0.0001 by unpaired Student t test (D, E and F), one-way ANOVA followed by Dunnett’s multiple comparisons test (B) and two-way ANOVA followed by Tukey’s multiple comparisons test (G).
Figure 3
Figure 3
Immunogenicity is induced in TREX1 depleted cells through cGAS-STING activation. A, ELISA of human cGAMP level in cell lysates of Scr or sgTREX1 H69AR and H196 cells, treated with 0.5 µmol/L reversine or DMSO for 72 hours. B, ELISA of human IFNβ level in conditioned medium derived from Scr or sgTREX1 H69AR and H196 cells, treated with 5-µmol/L cisplatin or DMSO for 72 hours. C, Schematic of cGAS-STING pathway leading to IFN response. STING is a crucial mediator of the dsDNA sensing pathway. D, Expression levels of TREX1, STING, and p-IRF3 in H69AR and H196 cells were compared by immunoblotting between cells transfected with siCtrl and siTREX1 (#1) in Scr or sgSTING background. E, Expression levels of IFNB and IFIT1 genes were compared between cells transduced with Scr or STING sgRNA, after transfection with siCtrl and siTREX1 (#1; mean ± SEM; n = 3). F, Growth curves of H69AR and H196 cells [Scr or sgSTING, transfected with siCtrl or siTREX1 (#1)] were compared (mean ± SEM; n = 3). Data represent mean ± SEM. ns, not significant; *, P < 0.05; **, P < 0.01; ***, P < 0.001; ****, P < 0.0001 by two-way ANOVA followed by Tukey’s multiple comparisons test (A, B, E, and F).
Figure 4
Figure 4
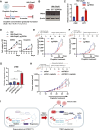
TREX1 depletion resensitizes resistant SCLC tumors to chemotherapy. A, Schematic of the method used to establish cisplatin-resistant H82 (H82-CispR) cells. B, Expression levels of TREX1 in H82 and H82-CispR (Scr and sgTREX1) cells were compared by immunoblotting. C, Expression levels of IFNB and IFIT1 genes were compared between Scr and sgTREX1 H82-CispR cells by qPCR (mean ± SEM; n = 3). D, Growth curves of the indicated cells treated with DMSO (Left) or 1.0-µmol/L cisplatin (Right) were compared (mean ± SEM; n = 3). E, Tumor growth curves of Scr and sgTREX1 H82-CispR tumors (n = 5), treated with 5-mg/kg cisplatin, were compared. F, Tumor growth curves of Scr and sgTREX1 H69AR tumors (n = 6), treated with 5-mg/kg cisplatin, were compared. G, Expression levels of the IFNB gene were compared between shCtrl and shTREX1 H1048 cells treated w/wo DOX (mean ± SEM; n = 3). H, Tumor growth curves of shCtrl and shTREX1 H1048 tumors (n = 6), treated with 5-mg/kg cisplatin, were compared. I, Schematic model of antitumor effects caused by TREX1 depletion. Data represent mean ± SEM. ns, not significant; *, P < 0.05; **, P < 0.01; ***, P < 0.001; ****, P < 0.0001 by unpaired Student t test (C, E, and F) and one-way ANOVA followed by Dunnett’s multiple comparison test (D), and two-way ANOVA followed by Tukey’s multiple comparison test (G and H). (I, Created with BioRender.com.)
Figure 5
Figure 5
TREX1 expression is induced in posttreated human SCLC tumors. A, IF staining of CK + EpCAM (green), TREX1 (red) protein in patient 25 and patient 6 SCLC tumors are shown, pre- and post-chemotherapy treatment. B, TREX1 IF intensity in 10 patients is compared between pre- and post-chemotherapy treatment. C, TREX1 IHC intensity in a paired PDX tumor is compared between pre- and post-chemotherapy treatment. Scale bar, 100 μm. Data represent mean ± SEM. ns, not significant; *, P < 0.05; **, P < 0.01; ***, P < 0.001; ****, P < 0.0001 by paired Student t test (B).

References

    1. Rudin CM, Brambilla E, Faivre-Finn C, Sage J. Small-cell lung cancer. Nat Rev Dis Primers 2021;7:3. - PMC - PubMed
    1. Horn L, Mansfield AS, Szczęsna A, Havel L, Krzakowski M, Hochmair MJ, et al. . First-line atezolizumab plus chemotherapy in extensive-stage small-cell lung cancer. N Engl J Med 2018;379:2220–9. - PubMed
    1. Faivre-Finn C, Snee M, Ashcroft L, Appel W, Barlesi F, Bhatnagar A, et al. . Concurrent once-daily versus twice-daily chemoradiotherapy in patients with limited-stage small-cell lung cancer (CONVERT): an open-label, phase 3, randomised, superiority trial. Lancet Oncol 2017;18:1116–25. - PMC - PubMed
    1. Antonia SJ, López-Martin JA, Bendell J, Ott PA, Taylor M, Eder JP, et al. . Nivolumab alone and nivolumab plus ipilimumab in recurrent small-cell lung cancer (CheckMate 032): a multicentre, open-label, phase 1/2 trial. Lancet Oncol 2016;17:883–95. - PubMed
    1. Gadgeel SM, Pennell NA, Fidler MJ, Halmos B, Bonomi P, Stevenson J, et al. . Phase II study of maintenance pembrolizumab in patients with extensive-stage small cell lung cancer (SCLC). J Thorac Oncol 2018;13:1393–9. - PMC - PubMed

Publication types

MeSH terms

Substances