. 2024 Nov 1;30(21):4957-4973.
doi: 10.1158/1078-0432.CCR-24-1238.

Genetic Screen in a Preclinical Model of Sarcoma Development Defines Drivers and Therapeutic Vulnerabilities

Affiliations

Genetic Screen in a Preclinical Model of Sarcoma Development Defines Drivers and Therapeutic Vulnerabilities

Jack Freeland et al. Clin Cancer Res. .

Abstract

Purpose: High-grade complex karyotype sarcomas are a heterogeneous group of tumors with a uniformly poor prognosis. Within complex karyotype sarcomas, there are innumerable genetic changes but identifying those that are clinically relevant has been challenging.

Experimental design: To address this, we utilized a pooled genetic screening approach, informed by The Cancer Genome Atlas (TCGA) data, to identify key drivers and modifiers of sarcoma development that were validated in vivo.

Results: YAP1 and wild-type KRAS were validated as drivers and transformed human mesenchymal stem cells into two distinct sarcoma subtypes, undifferentiated pleomorphic sarcoma and myxofibrosarcoma, respectively. A subset of tumors driven by CDK4 and PIK3CA reflected leiomyosarcoma and osteosarcoma demonstrating the plasticity of this approach and the potential to investigate sarcoma subtype heterogeneity. All generated tumors histologically reflected human sarcomas and had increased aneuploidy as compared to simple karyotype sarcomas. Comparing differential gene expression of TCGA samples to model data identified increased oxidative phosphorylation signaling in YAP1 tumors. Treatment of a panel of soft tissue sarcomas with a combination of YAP1 and oxidative phosphorylation inhibitors led to significantly decreased viability.

Conclusions: Transcriptional co-analysis of TCGA patient samples to YAP1 and KRAS model tumors supports that these sarcoma subtypes lie along a spectrum of disease and adds guidance for further transcriptome-based refinement of sarcoma subtyping. This approach can be used to begin to understand pathways and mechanisms driving human sarcoma development, the relationship between sarcoma subtypes, and to identify and validate new therapeutic vulnerabilities for this aggressive and heterogeneous disease.


Conflict of interest statement

T.G.G. reports having consulting and equity agreements with Auron Therapeutics, Boundless Bio, Coherus BioSciences and Trethera Corporation. O.N.W. currently has consulting, equity, and/or board relationships with Trethera Corporation, Kronos Biosciences, Sofie Biosciences, Breakthrough Properties, Vida Ventures, Nammi Therapeutics, Two River, Iconovir, Appia BioSciences, Neogene Therapeutics, 76Bio, and Allogene Therapeutics. S.W.T. receives clinical trial funding from McMaster. All other authors declare they have no competing interests.

Figures

Figure 1.
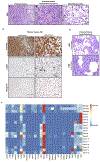
Figure 1.. Human Mesenchymal Stem Cells can be Transformed to High-Grade Sarcomas
(A) Schematic diagram of forward transformation model of sarcoma development. (B) Western blot of generated cell lines were evaluated for RB1 and P53 expression. Given the low basal levels of P53, cells were treated with doxorubicin to induce expression. Beta actin is shown as a loading control. Experiment was performed in duplicate (C) H&E staining demonstrates high power views of sarcomas formed by addition of the lentiviral vector library to each of the genetic backgrounds shown. Scale bar represents 50um. (D) Distinct areas of necrosis were seen as evidenced by an immune infiltrate, scale bar represents 50um. N=8 per genotype.
Figure 2.
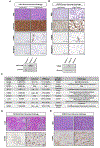
Figure 2.. Primary Screen Identifies YAP1, KRAS, and DDIT3 as Potential Drivers of Sarcoma Development.
(A) Low power view of H&E staining of tumors formed that demonstrated two distinct histologies. Scale bar represents 300um. High power view of the two distinct histologies labeled “B” and “C” demonstrate (B) Undifferentiated pleomorphic sarcoma and (C) Myxofibrosarcoma. Scale bar represents 50um. Primary screen was performed in triplicate with 4-8 implants per experiment (D) Immunohistochemistry of tumors formed show strong positivity for vimentin, primarily endothelial cell staining and infrequent tumor cells showing positivity for smooth muscle actin, and negative staining for myogenin. Left side shows low power views with scale bars representing 300um and right side shows high power views with 50um scale bars. N=6, two tumors from each experiment were stained for the panel of IHC markers. (E) Representative lung sections show the presence of metastatic sarcoma cells with low (top) and high (bottom) power views and scale bars representing 300um and 50um respectively. N=12 animals total in duplicate experiments, of those analyzed, 5 demonstrated lung metastasis (42%) (F) Heat map representing barcode sequencing counts from the primary screen. See also supplemental figure 2 for percentage of each barcode per sample and calculated p-values.
Figure 3.
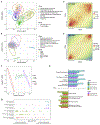
Figure 3.. Drivers of Histologically Distinct Sarcoma Subtypes
(A) Histology from YAP1 driven tumors are shown with lower power on the left column, scale bars 300um and high power on the right, scale bars 50um. Tumors histologically represent undifferentiated pleomorphic sarcoma with strong staining for vimentin and negative for SMA and myogenin. (B) KRAS driven tumors are shown in this panel with histology consistent with myxofibrosarcoma. Low power images are shown on the left with high power on the right. Representative western blots of tumors are shown underneath. Secondary screen was performed in duplicate with n=8 for the first experiment and n=4 for the replicate. (C) Secondary screen summary table showing the gene that was added to RB1−/−P53+/− cells, the amount of time until the tumor reached 1cm (latency) and the number of tumors that formed from the injections (efficacy) as well as the histology of the outgrowths. P-values representing the relative enrichment is shown in the table, for KRAS, YAP1, and DDIT3. Latency is shown as the mean +/− the standard deviation (D) H&E and immunohistochemistry of PI3KCA driven tumors that show osteosarcoma confirmed with SATB2 expression. Low power is shown on the left and higher power on the right. (E) H&E and immunohistochemistry of CDK4 driven tumors showing leiomyosarcoma with positive alpha smooth muscle actin staining. For all low power images, scale bars represent 300um and higher power shows scale bars representing 50um.
Figure 4.
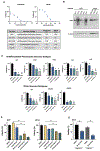
Figure 4.. Tumor Models Demonstrate an Aneuploidy Phenotype and YAP1 Amplification
(A) Heat map showing chromosomal gains (red) and losses (blue) in tumor models and cell lines. Three samples are shown from each tumor type and chromosomes are represented on the X axis. (B) Quantification of aneuploidy by iCNA scores. Thyroid carcinoma and kidney chromophobe are shown on the axis to demonstrate the extremes of the TCGA data. (C) Graph demonstrating chromosome 11q amplification in CDK4 and PIK3CA driven tumors and exogenous amplification of YAP1 in the YAP1 driven tumors. (D) Table summarizing the mRNA expression levels of YAP1 across the models and the relative copy number.
Figure 5.
Figure 5.. YAP1 and KRAS Driven Tumors Transcriptionally Reflect Human Undifferentiated Pleomorphic Sarcoma and Myxofibrosarcoma
(A) PCA plot of human cancers from TCGA data with projection of the tumor models and cell lines onto the space showing overlap with human sarcomas. (B) PCA plot of tumor models and cell lines with projection of TCGA samples into the space demonstrating that the models cluster with tumors and are distinct from the cell lines. (C) PLSR plot of UPS and MFS transcriptome with KRAS and YAP1 models projected. (D) Co-rank plot showing overlapping signal in KRAS-YAP1 tumor model differentially expressed (DE) gene signature and TCGA MFS-UPS DE gene signature with Pearson correlation coefficient. (E) Co-rank plot showing overlapping signal in KRAS-YAP1 tumor model DE gene signature and TCGA MFS-UPS PCA signature with Pearson correlation coefficient. (F) GSEA comparing YAP1 tumors, human UPS, and PCA loadings (+) to KRAS tumors, human MFS and PCA loadings (−). (G) Distribution of oxidative phosphorylation and DNA damage related pathways in gene sets ranked by normalized enrichment score (NES). All listed categories are nominally significant (p<0.001) by Kolmogorov-Smirnov (KS) test.
Figure 6.
Figure 6.. Treatment of Sarcoma Cell Lines with Hippo, Oxidative Phosphorylation or Dual Inhibition
(A) Top panel shows GCT (UPS cell line) proliferation with the addition of increasing concentrations of either the YAP1 inhibitor verteporfin or the complex I inhibitor IM156. Bottom panel provides relative IC50 values for each of the tested cell lines (also see supplemental figure 6). (B) Western blot of cell lines demonstrating YAP1 expression levels. (C) Treatment of sarcoma cell line panel with 30uM of IM156, 20uM of verteporfin, or the combination. *p<0.05 as compared to the DMSO only control. **p<0.05 as compared to IM156 and verteporfin alone. N=3 (D) GCT and UPS1 cells treated with YAP/TEAD inhibitor IAG933 and IM156 or the combination. Verteporfin treatment is shown as a comparator group. *p<0.05. N=3 (E) Treatment of control or YAP1 knockout GCT cell lines with IM156. *p<0.05. UPS1 KO lines could not be generated as cells did not tolerate YAP1 loss. N=4.

Similar articles

References

    1. WHO Classification of Tumours Editorial Board (2020). Soft Tissue and Bone Tumours WHO Classification of Tumours 5th Edition, Volume 3.
    1. Nacev BA, Jones KB, Intlekofer AM, Yu JSE, Allis CD, Tap WD, Ladanyi M, and Nielsen TO (2020). The epigenomics of sarcoma. Nature Reviews Cancer 20, 608–623. 10.1038/s41568-020-0288-4. - DOI - PMC - PubMed
    1. Helman LJ, and Meltzer P (2003). Mechanisms of sarcoma development. Nature Reviews Cancer 3, 685–694. 10.1038/nrc1168. - DOI - PubMed
    1. Lee DY, Staddon AP, Shabason JE, and Sebro R (2019). Phase I and phase II clinical trials in sarcoma: Implications for drug discovery and development. Cancer Medicine 8, 585–592. 10.1002/cam4.1958. - DOI - PMC - PubMed
    1. Abeshouse A, Adebamowo C, Adebamowo SN, Akbani R, Akeredolu T, Ally A, Anderson ML, Anur P, Appelbaum EL, Armenia J, et al. (2017). Comprehensive and Integrated Genomic Characterization of Adult Soft Tissue Sarcomas. Cell 171, 950–965.e28. 10.1016/j.cell.2017.10.014. - DOI - PMC - PubMed

Substances