

Automatic Determination of Endothelial Cell Density From Donor Cornea Endothelial Cell Images
- PMID: 39177992
- PMCID: PMC11346145
- DOI: 10.1167/tvst.13.8.40
Automatic Determination of Endothelial Cell Density From Donor Cornea Endothelial Cell Images
Abstract
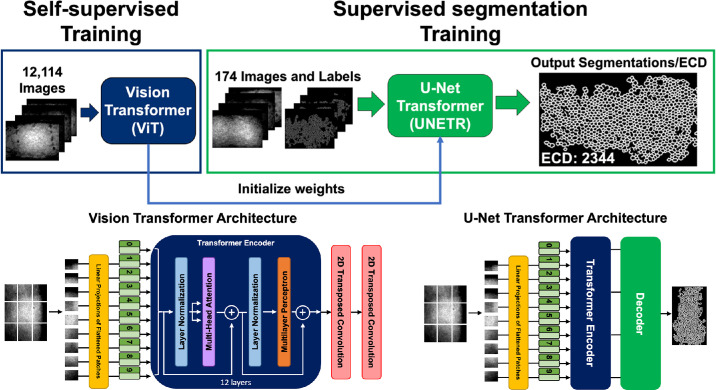
Purpose: To determine endothelial cell density (ECD) from real-world donor cornea endothelial cell (EC) images using a self-supervised deep learning segmentation model.
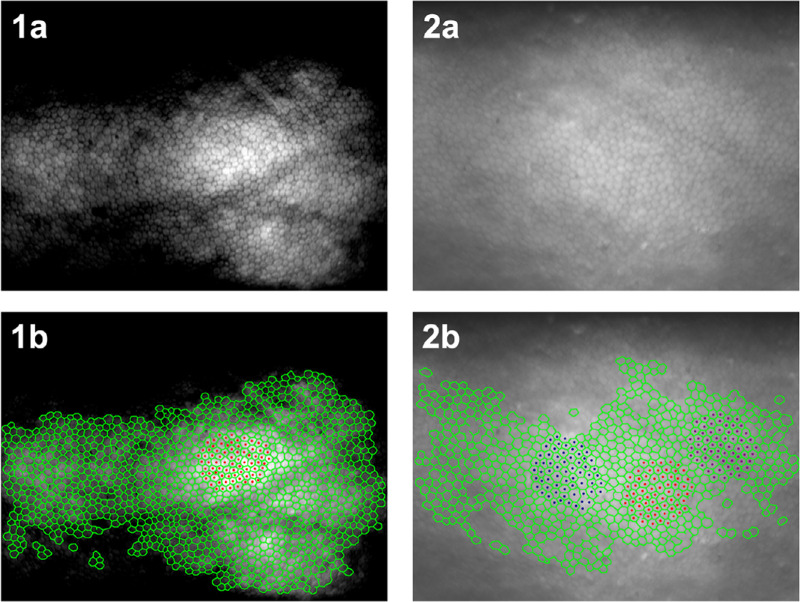
Methods: Two eye banks (Eversight, VisionGift) provided 15,138 single, unique EC images from 8169 donors along with their demographics, tissue characteristics, and ECD. This dataset was utilized for self-supervised training and deep learning inference. The Cornea Image Analysis Reading Center (CIARC) provided a second dataset of 174 donor EC images based on image and tissue quality. These images were used to train a supervised deep learning cell border segmentation model. Evaluation between manual and automated determination of ECD was restricted to the 1939 test EC images with at least 100 cells counted by both methods.
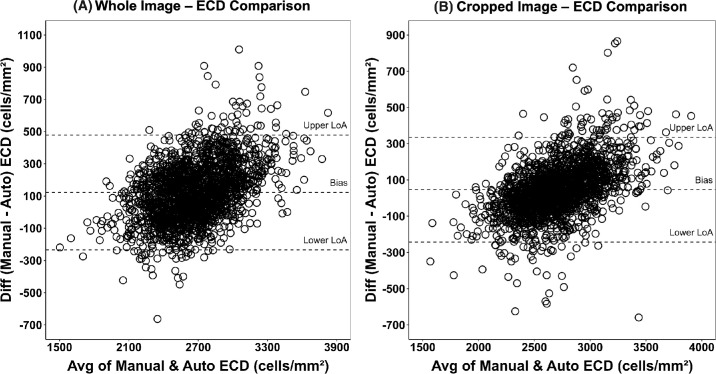
Results: The ECD measurements from both methods were in excellent agreement with rc of 0.77 (95% confidence interval [CI], 0.75-0.79; P < 0.001) and bias of 123 cells/mm2 (95% CI, 114-131; P < 0.001); 81% of the automated ECD values were within 10% of the manual ECD values. When the analysis was further restricted to the cropped image, the rc was 0.88 (95% CI, 0.87-0.89; P < 0.001), bias was 46 cells/mm2 (95% CI, 39-53; P < 0.001), and 93% of the automated ECD values were within 10% of the manual ECD values.
Conclusions: Deep learning analysis provides accurate ECDs of donor images, potentially reducing analysis time and training requirements.
Translational relevance: The approach of this study, a robust methodology for automatically evaluating donor cornea EC images, could expand the quantitative determination of endothelial health beyond ECD.
Conflict of interest statement
Disclosure:
Figures
References
-
- Eye Bank Association of America. Medical standards. Available at: https://restoresight.org/wp-content/uploads/2020/07/Med-Standards-June-2.... Accessed July 29, 2024.
-
- Lass JH, Gal RL, Ruedy KJ.. An evaluation of image quality and accuracy of eye bank measurement of donor cornea endothelial cell density in the Specular Microscopy Ancillary Study. Ophthalmology. 2005; 112(3): 431–440. - PubMed
-
- Huang H, Benetz BA, Clover JM, et al. .. Comparison of donor corneal endothelial cell density determined by eye banks and by a central image analysis reading center using the same image analysis method. Cornea. 2022; 41(5): 664–668. - PubMed
-
- Clover J, Ansin A, Tran KD.. A protocol for implementation and use of a tissue incubator for rapid corneal warming at the eye bank. Int J Eye Banking. 2018; 6(1): 1–7.
Publication types
MeSH terms
Grants and funding
LinkOut - more resources
Full Text Sources
Medical
