. 2024 Sep 24;43(9):114667.
doi: 10.1016/j.celrep.2024.114667. Epub 2024 Aug 22.

The TRIM4 E3 ubiquitin ligase degrades TPL2 and is modulated by oncogenic KRAS

Affiliations

The TRIM4 E3 ubiquitin ligase degrades TPL2 and is modulated by oncogenic KRAS

Sapana Bansod et al. Cell Rep. .

Abstract

Loss-of-function mutations in the C terminus of TPL2 kinase promote oncogenesis by impeding its proteasomal degradation, leading to sustained protein expression. However, the degradation mechanism for TPL2 has remained elusive. Through proximity-dependent biotin identification (BioID), we uncovered tripartite motif-containing 4 (TRIM4) as the E3 ligase that binds and degrades TPL2 by polyubiquitination of lysines 415 and 439. The naturally occurring TPL2 mutants R442H and E188K exhibit impaired TRIM4 binding, enhancing their stability. We further discovered that TRIM4 itself is stabilized by another E3 ligase, TRIM21, which in turn is regulated by KRAS. Mutant KRAS recruits RNF185 to degrade TRIM21 and subsequently TRIM4, thereby stabilizing TPL2. In the presence of mutant KRAS, TPL2 phosphorylates and degrades GSK3β, resulting in β-catenin stabilization and activation of the Wnt pathway. These findings elucidate the physiological mechanisms regulating TPL2 and its exploitation by mutant KRAS, underscoring the need to develop TPL2 inhibitors for KRAS-mutant cancers.

Keywords: COT; CP: Cancer; CP: Molecular biology; KRAS; MAP3K8; RNF185; TPL2; TRIM21; TRIM4; Wnt/β-catenin; protein degradation; ubiquitination.


Conflict of interest statement

Declaration of interests The authors declared no competing interests.

Figures

Figure 1.
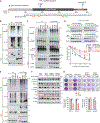
Figure 1.. BioID identifies TRIM4 as the E3 ligase that degrades TPL2
(A) Schematic workflow of BioID to identify the TPL2 interactome. Briefly, HEK293T cells transfected with MiniTurbo-TPL2 or control were treated with 500 μM biotin for 5 h in duplicates and then harvested for streptavidin bead pull-down. Captured biotinylated peptides were identified using mass spectrometry. (B) Venn diagram showing identified protein hits exclusive to control or TPL2. 24 hits, including TPL2 and TRIM4. (C and D) IP western blots of HEK293T cells stably expressing HA-tagged TPL2 transfected with (C) an empty vector (EV) or FLAG-TRIM4 and (D) EV or FLAG-tagged WT or enzymatically inactive (C27S) TRIM4. (E) Western blots showing serial levels of stably expressed HA-TPL2 protein in HEK293T cells transfected with EV or TRIM4 and then treated with 10 μg/mL cycloheximide (CHX) for the indicated durations. Half-lives (t1/2) of TPL2 were calculated by measuring HA-TPL2 band intensities, normalizing to t0, and performing one-phase exponential decay analysis. (F) Relative SRE-driven luciferase reporter activity in HEK293T cells transfected with EV, TPL2, and/or TRIM4. Data were pooled from three independent experiments, each done in technical triplicates. (G) Western blots with densitometric quantification (G) and immunofluorescence (IF) picture (H) with quantification, showing changes in p-MEK and p-ERK1/2 in Pa01C cells stably expressing a scramble or two different shRNAs against TRIM4. Six fields per condition were analyzed. Scale bars, 20 μm. (I) Western blots showing serial changes in endogenous TPL2 protein levels and their calculated t1/2 in Pa01C cells following 10 μg/mL CHX treatment for different durations. (J) Representative 3D organoid pictures of the indicated Pa01C cells treated with DMSO or TPL2i. Scale bars, 100 μm. For (C) and (D), 48 h after transfection, cells were treated with DMSO or MG132 (10 μM) for 6 h and harvested for western blots. For (E) and (I), data from three independent experiments were quantified, with blots from one representative experiment shown. For (F), (H), and (J), data are presented as mean ± SEM. The p values were calculated from two-way ANOVA followed by Tukey’s multiple-comparisons test. ****p < 0.0001, **p < 0.0021.
Figure 2.
Figure 2.. TRIM4 polyubiquitinates TPL2 at lysines 415 and 439
(A) Structure of the TPL2 protein, which consists of an internal kinase domain and the degron (amino acids 400–467) within the C terminus. Recurrent gain-of-function point mutations at amino acids 188 and 442 are shown. (B and C) IP western blots of HEK293T cells stably expressing FLAG-TRIM4 transfected with EV or the indicated HA-tagged TPL2 variants. (D) Western blots showing serial changes of transfected HA-TPL2 protein levels in HEK293T cells stably expressing FLAG-TRIM4 following 10 μg/mL CHX treatment for different durations. t1/2 of TPL2 variants were calculated by measuring HA band intensities, normalizing to t0, and performing one-phase exponential decay analysis. Data from three independent experiments were quantified, with blots from one representative experiment shown. (E) IP western blots of HEK293T cells stably expressing FLAG-TRIM4 transfected with EV or the indicated HA-TPL2 variants. (F) Western blots and densitometric quantification of p-MEK and p-ERK1/2 bands in the indicated cell lines stably expressing EV or FLAG-TRIM4. (G) Representative pictures and quantification of one of three sets of 2D clonogenic colony formation experiments of the indicated cell lines. Data are presentedas mean ± SEM. The p values were calculated from two-way ANOVA followed by Tukey’s multiple-comparisons test; ns, not significant. **p < 0.0026. For (B), (C), and (E), 48 h after transfection, cells were treated with DMSO or MG132 (10 mM) for 6 h and harvested for western blots.
Figure 3.
Figure 3.. KRAS oncoprotein stabilizes TPL2 by degrading TRIM4
(A) GSEA plots showing pathway signatures that are enriched in MAP3K8-high PDAC samples analyzed from the TCGA PDAC Firehose Legacy database. (B) Relative SRE reporter activity in HEK293T cells stably expressing EV or KRASG12V and KRASG12D-mutant HPAC and Pa01C cells treated with different concentrations of TPL2i for 48 h. Data were pooled from 2 to 3 independent experiments, each done in biological triplicates and presented as mean ± SEM (****p < 0.0001, ***p < 0.0002, **p < 0.0021 by two-way ANOVA). (C) IP western blots of HEK293T cells stably expressing EV or HA-TPL2 transfected with EV or FLAG-KRASG12V. 48 h after transfection, cells were treated with DMSO or bortezomib (0.1 μM) for 6 h and harvested for western blots. (D) Western blots and t1/2 of HA-TPL2 protein in HEK293T cells stably expressing EV or FLAG-KRASG12V treated with 10 μg/mL CHX for the indicated durations. (E) Representative fluorescence images and quantification showing in situ TPL2-TRIM4 punctate dots by Duolink PLA in HEK293T cells expressing EV or FLAG-KRASG12V. Data are presented as mean ± SEM. ****p < 0.0001 by two-tailed t test, six fields per condition were analyzed. Scale bars, 50 μm). (F) Western blots and t1/2 of endogenous TRIM4 protein in control or KRAS-silenced Pa01C cells treated with CHX (10 μg/mL) for the indicated durations. (G) Western blots and t1/2 of endogenous TRIM4 protein in MIA Paca-2 cells pre-treated overnight with AMG-510 (0.2 μM), followed by (CHX 10 μg/mL) for the indicated durations. For (D), (F), and (G), the t1/2 of the indicated proteins were calculated by comparing band intensities at t0 and performing one-phase exponential decay analysis. Data from three independent experiments are quantified, with blots from one representative experiment shown.
Figure 4.
Figure 4.. The KRAS interactor TRIM21 destabilizes TPL2
(A) Schematic workflow of IP-mass spectrometry with HEK293T cells stably expressing FLAG-KRASG12V or FLAG-RALAG23V. Selected protein hits with more than 10 significant sequence matches and enriched in KRASG12V lysates by ≥3-fold are shown. An asterisk denotes known KRAS interactors based on BioGRID4.4. (B) IP-western blots confirming the interaction of HA-KRASG12V with endogenous TRIM21 in HEK293T cells. (C) IP-western blots of HEK293T cells stably expressing EV or HA-TPL2 transfected with EV (denoted as −), GFP-tagged WT, or enzymatically inactive (C54Y) TRIM21. 48 h after transfection, cells were treated with DMSO or bortezomib (0.1 μM) for 6 h and harvested for western blots. (D) Western blots and t1/2 of HA-TPL2 proteins in HEK293T cells stably expressing EV or TRIM21-GFP treated with CHX (10 μg/mL) for the indicated durations. Data from three independent experiments is quantified with blots from one representative experiment shown. (E) Relative SRE-driven luciferase reporter activity in HEK293T cells transfected with EV or the indicated constructs. Data were pooled from three independent experiments, each done in triplicates, and are presented as mean ± SEM (****p < 0.0001). (F) Western blots and densitometric quantification of the indicated markers in Pa01C and HPAC cells stably expressing a scramble or two different shRNAs against TRIM21. (G) GSEA plots showing KRAS and MEK oncogenic signatures in TRIM21-silenced Pa01C cells.
Figure 5.
Figure 5.. TRIM21 positively regulates TRIM4 stability
(A) IP-western blots of HEK293T cells stably expressing EV or FLAG-TRIM4 and transfected with EV or TRIM21-GFP. (B) IP-western blots of HEK293T cells stably expressing EV or HA-TPL2 cells transfected with a fixed amount of TRIM4 (6 μg in 10 cm2 plates) and different amounts (1.5 μg, 3 μg, and 6 μg) of TRIM21. (C) Western blots and t1/2 of endogenous TRIM4 protein in HEK293T cells transfected with the indicated cDNAs and treated with CHX (10 μg/mL) for the indicated durations. Data from three independent experiments were quantified, with blots from one representative experiment shown. (D) IP-western blots of HEK293T cells stably expressing EV or HA-TPL2 and transfected with EV, TRIM21-GFP, and FLAG-KRASG12V. (E) IP-western blots showing TRIM21 polyubiquitination in HEK293T cells transfected with EV, TRIM21-GFP, and/or HA-KRASG12V. For (A), (B), (D), and (E), 48 h after transfection, cells were treated with DMSO or bortezomib (0.1 μM) for 6 h and harvested for western blots.
Figure 6.
Figure 6.. Mutant KRAS recruits RNF185 E3 ligase to degrade TRIM21
(A) Volcano plot of KRASG12V BioID experiments, which identified RNF185 and MYCBP2 as the two E3 ligases enriched by >2-fold through proximal biotinylation by BirA-KRASG12V. Identification of the known KRASG12V effectors BRAF and RALA confirmed the robustness of the data. EFR3A was confirmed and published previously. (B) IP-western blots confirming the interaction of HA-KRASG12V with endogenous RNF185 and TRIM21 in HEK293T cells. (C) IP-western blots of HEK293T cells stably expressing EV or FLAG-tagged KRASG12D treated with DMSO or MRTX1133 at 0.1 and 0.5 μM overnight and harvested for western blots. (D and E) Representative Duolink PLA fluorescence images and quantification of fluorescent puncta showing in situ interaction between (D) endogenous RNF185 and KRAS or (E) TRIM21-GFP and endogenous RNF185 in Pa01C and HPAC cells treated overnight with MRTX1133. Data presented as mean ± SEM (****p < 0.0001 by one-way ANOVA; six fields per condition were analyzed; scale bars, 20 μm). (F) IP-western blot of HEK293T cells stably expressing EV or HA-KRASG12V and transiently transfected with TRIM21-GFP or/and FLAG-RNF185. (G and H) Western blots and t1/2 of endogenous TRIM21 protein in (G) HEK293T FLAG-KRASG12D cells stably expressing EV or GFP-RNF185 or (H) Pa01C cell stably expressing a scramble or shRNF185, following treatment with CHX (10 μg/mL) for the indicated durations. (I) Western blots and densitometric quantification of the indicated markers in scramble and two different RNF186-silenced Pa01C cells. (J) Western blots and t1/2 of endogenous TRIM21 and TRIM4 proteins in HPAC cells pre-treated overnight with DMSO or MRTX1133, followed by CHX (10 μg/mL) for the indicated durations. (K) Western blots and densitometric quantification showing the impact of overnight MRTX1133 treatment on the indicated markers in Pa01C and HPAC cells. For (G), (H), and (J), data from three independent experiments were quantified, with blots from one representative experiment shown.
Figure 7.
Figure 7.. TPL2 phosphorylates and inhibits GSK3β, leading to stabilization of β-catenin
(A) Workflow of IP-mass spectrometry and enrichment plot demonstrating GSK3β as one of the top hits enriched in HEK293T cells expressing HA-TPL2 plus TRIM21-GFP when compared to HA-TPL2 alone. (B) IP-western blots confirming the interaction of HA-TPL2 with endogenous GSK3β when TRIM21 is overexpressed. (C and D) Bar graphs showing relative luciferase reporter activity in (C) 293T TOPFlash reporter cells transfected with EV or HA-TPL2 and (D) Pa01C and HPAC cells stably expressing a Wnt luciferase reporter treated overnight with TPL2i. (E) Bar graphs showing selected up- and downregulated Molecular Signatures Database (MSigDB) oncogenic signatures with normalized enrichment score and false discovery rate q values. Shown are GSEA plots focusing on Wnt and MEK signatures in MAP3K8-silenced Pa01C cells. (F and G) Western blots and densitometric quantification of the indicated markers in (F) HEK293T cells stably expressing EV or HA-TPL2 and (G) Pa01C and HPAC cells treated overnight with TPL2i. (H) Relative Wnt luciferase reporter activity in Pa01C and HPAC cells treated with the indicated agents overnight. (I and J) Western blots and densitometric quantification of p-GSK3β and p-β-catenin in (I) Pa01C and HPAC cells stably expressing EV or TRIM21-GFP and (J) scramble or TRIM21-silenced Pa01C cells. (K) GSEA plot showing the upregulated Wnt pathway signature in TRIM21-silenced Pa01C cells. (L) IP-western blots showing GSK3β polyubiquitination in HEK293T cells stably expressing the indicated cDNAs. (M) Western blots and t1/2 of endogenous GSK3β in Pa01C cells stably expressing EV or TRIM21-GFP treated with CHX (10 μg/mL) for the indicated durations. Data from three independent experiments were quantified, with blots from one representative experiment shown. (N and O) Relative TOPFlash luciferase reporter activity in HEK293T cells stably expressing the indicated cDNAs (N) treated overnight with DMSO or GSK3β inhibitor and (O) treated overnight with TPL2i. (P) Relative Wnt luciferase reporter activity in Pa01C and HPAC cells treated overnight with the indicated agents. For (C), (D), (H), and (N)–(P), data were pooled from two or three independent experiments, each done in technical triplicates, and are presented as mean ± SEM. The p values were calculated from two-tailed t test or ANOVA for multiple groups. ****p < 0.0001, ***p < 0.0002, **p < 0.0021, *p < 0.0332.

References

    1. Mielke LA, Elkins KL, Wei L, Starr R, Tsichlis PN, O’Shea JJ, and Watford WT (2009). Tumor progression locus 2 (Map3k8) is critical for host defense against Listeria monocytogenes and IL-1 beta production. J. Immunol. 183, 7984–7993, 1950. 10.4049/jimmunol.0901336. - DOI - PMC - PubMed
    1. Pattison MJ, Mitchell O, Flynn HR, Chen CS, Yang HT, Ben-Addi H, Boeing S, Snijders AP, and Ley SC (2016). TLR and TNF-R1 activation of the MKK3/MKK6-p38alpha axis in macrophages is mediated by TPL-2 kinase. Biochem. J. 473, 2845–2861. 10.1042/BCJ20160502. - DOI - PMC - PubMed
    1. Bansod S, Dodhiawala PB, and Lim KH (2021). Oncogenic KRAS-Induced Feedback Inflammatory Signaling in Pancreatic Cancer: An Overview and New Therapeutic Opportunities. Cancers 13, 5481. 10.3390/cancers13215481. - DOI - PMC - PubMed
    1. Dodhiawala PB, Khurana N, Zhang D, Cheng Y, Li L, Wei Q,Seehra K, Jiang H, Grierson PM, Wang-Gillam A, and Lim KH (2020). TPL2 enforces RAS-induced inflammatory signaling and is activated by point mutations. J. Clin. Invest. 130, 4771–4790. 10.1172/JCI137660. - DOI - PMC - PubMed
    1. Li Q, Chen Y, Zhang D, Grossman J, Li L, Khurana N, Jiang H, Grierson PM, Herndon J, DeNardo DG, et al. (2019). IRAK4 mediates colitis-induced tumorigenesis and chemoresistance in colorectal cancer. JCI Insight 4, e130867. 10.1172/jci.insight.130867. - DOI - PMC - PubMed

Publication types

MeSH terms