. 2024 Sep 24;43(9):114669.
doi: 10.1016/j.celrep.2024.114669. Epub 2024 Aug 22.

Cells and circuits for amygdala neuroplasticity in the transition to chronic pain

Affiliations

Cells and circuits for amygdala neuroplasticity in the transition to chronic pain

Takaki Kiritoshi et al. Cell Rep. .

Abstract

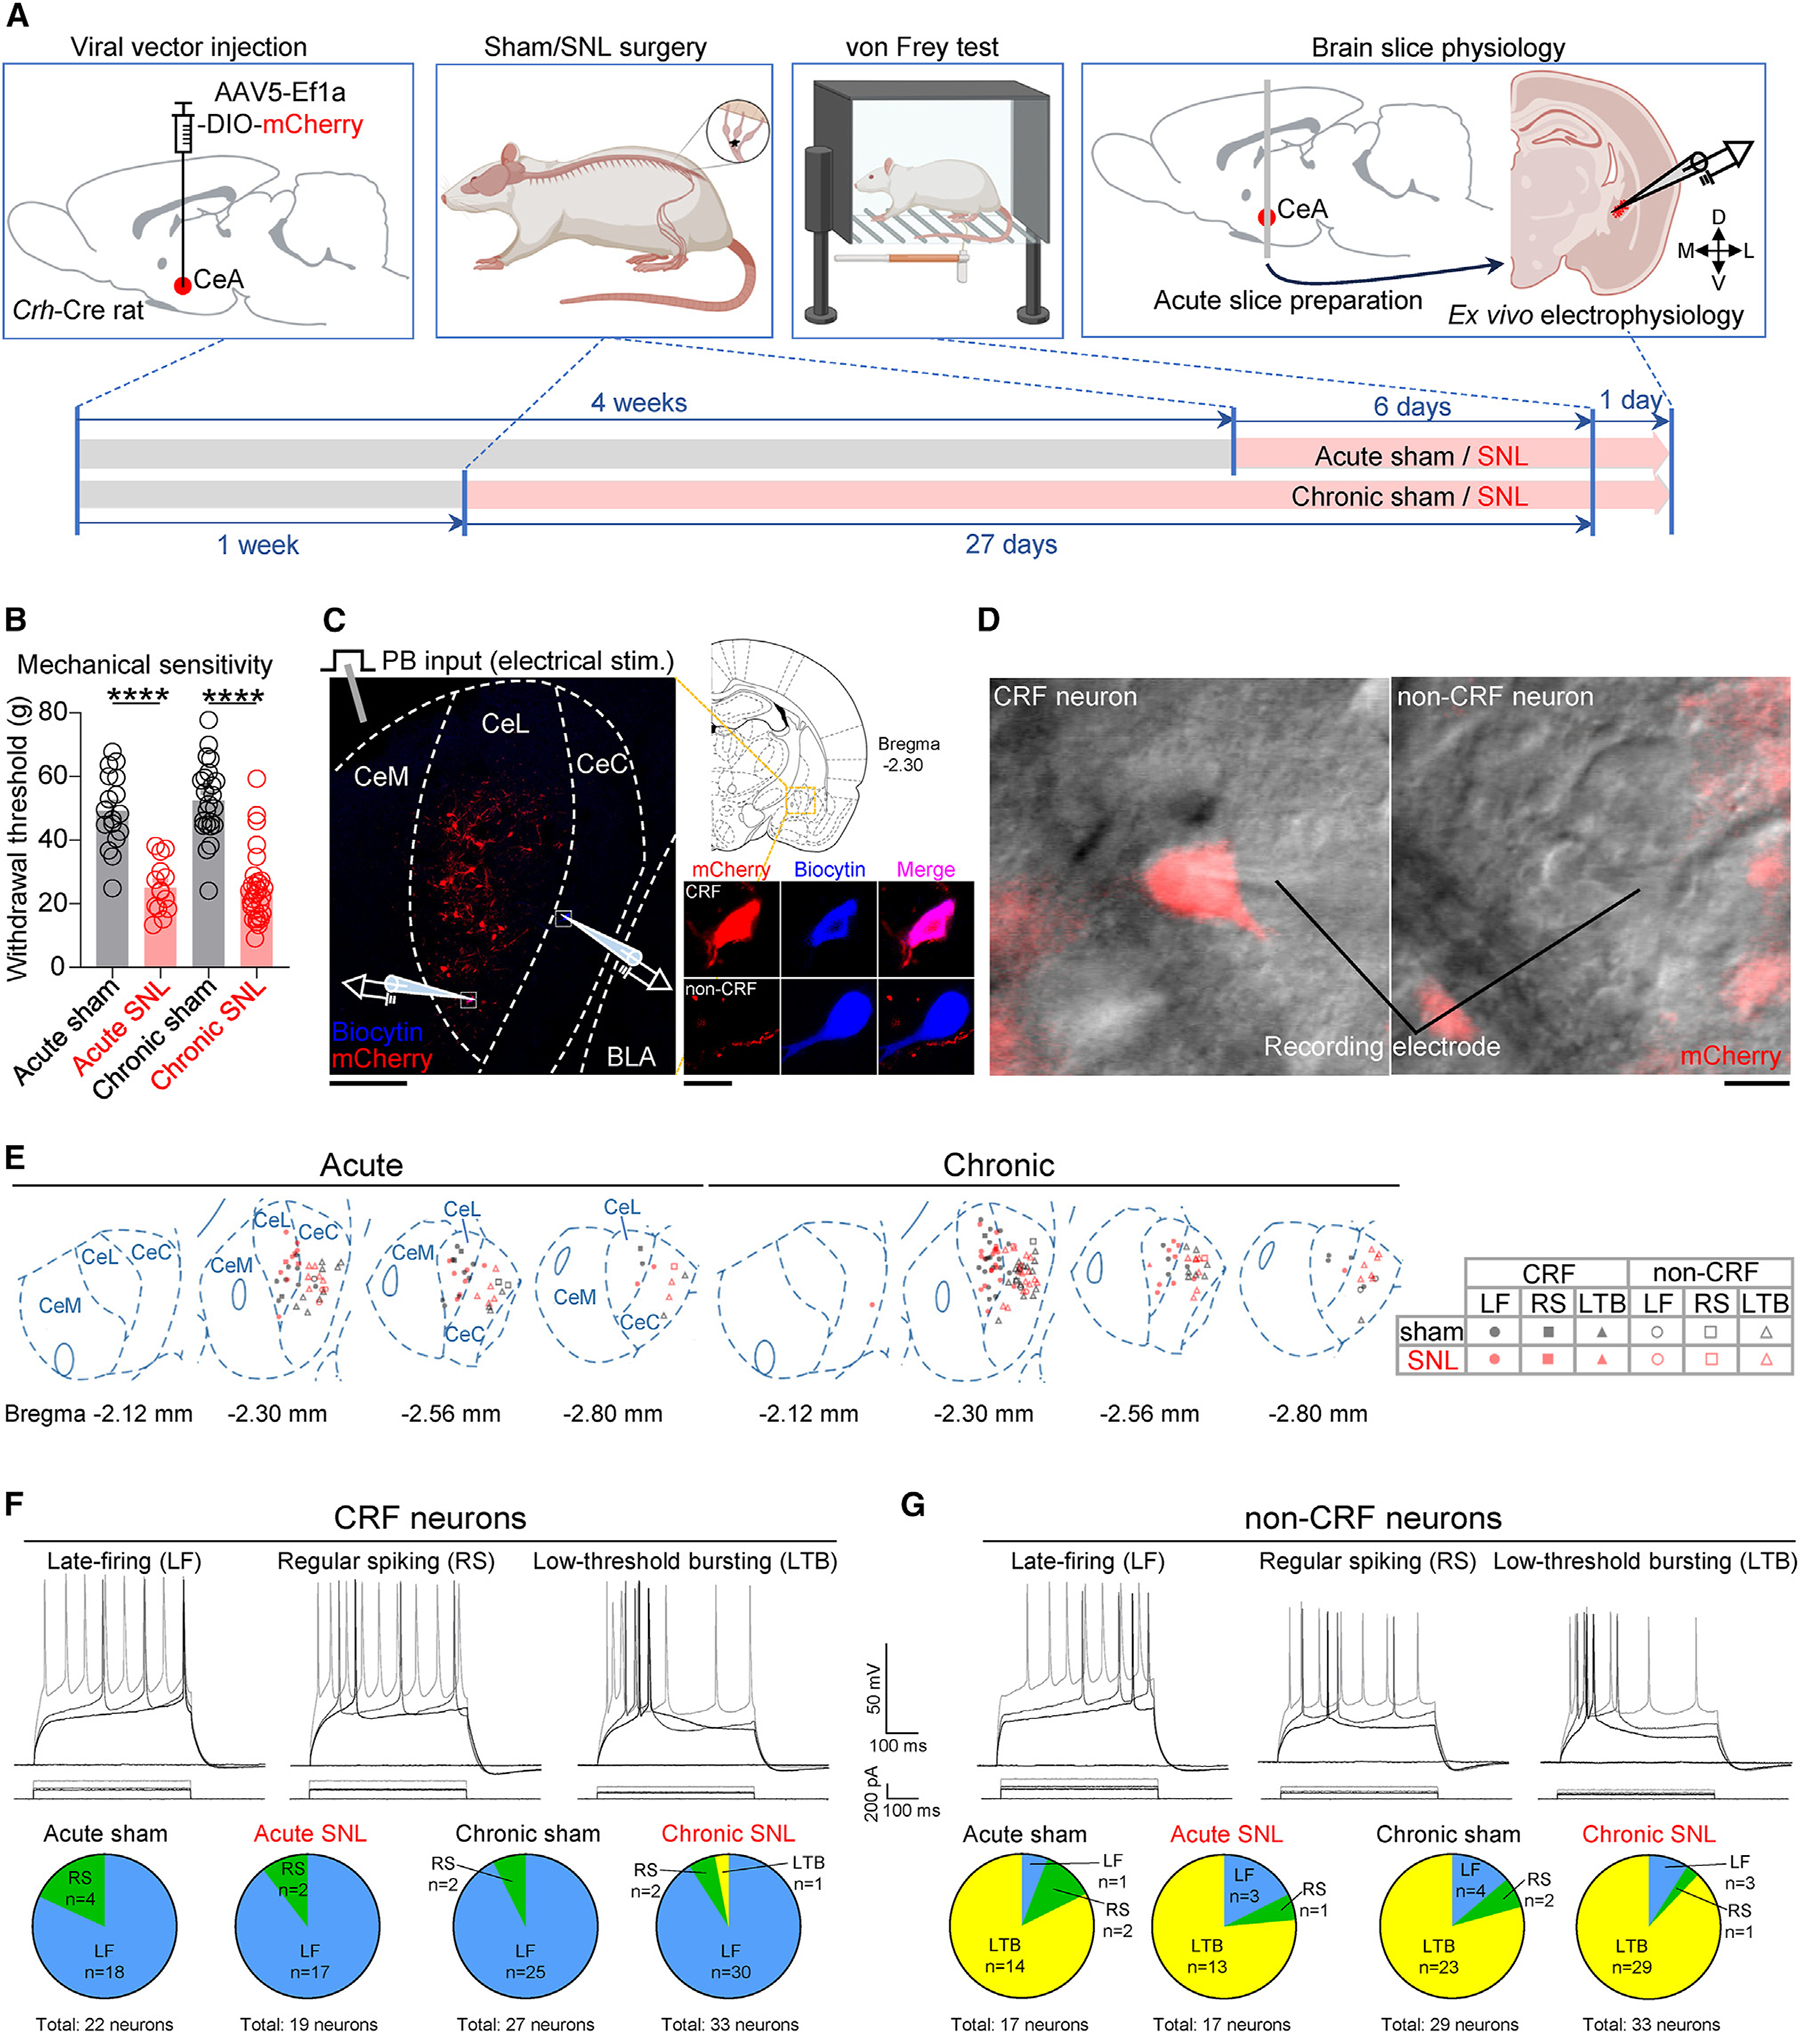
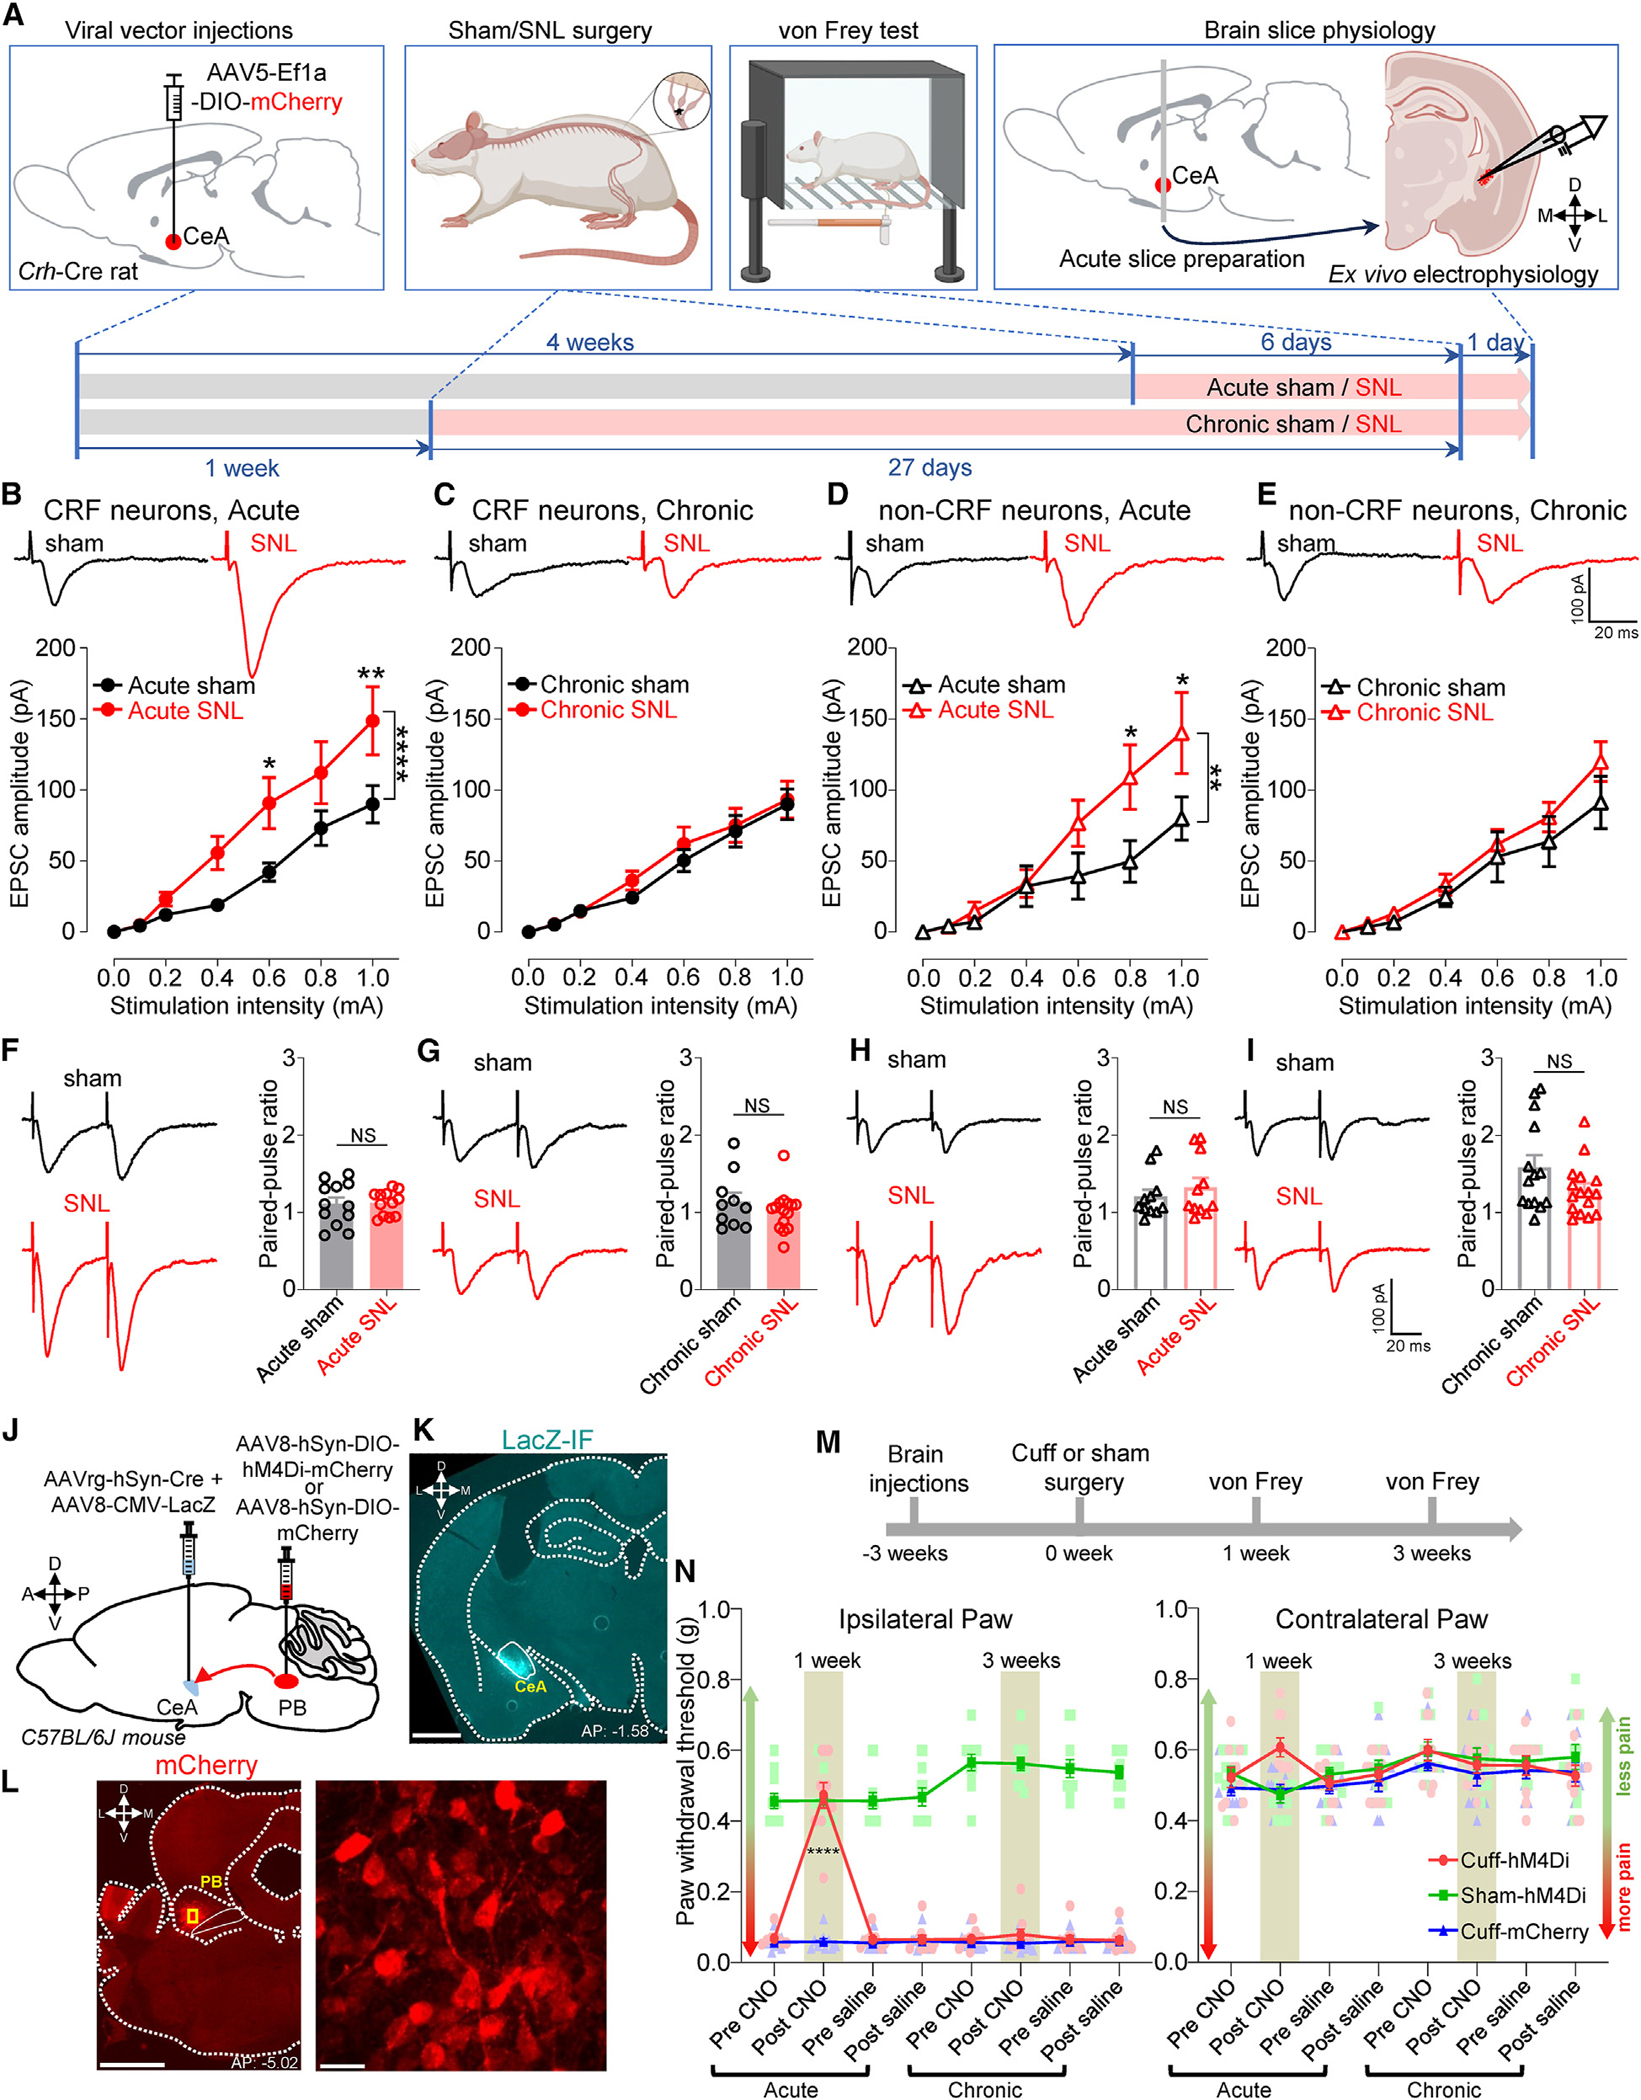
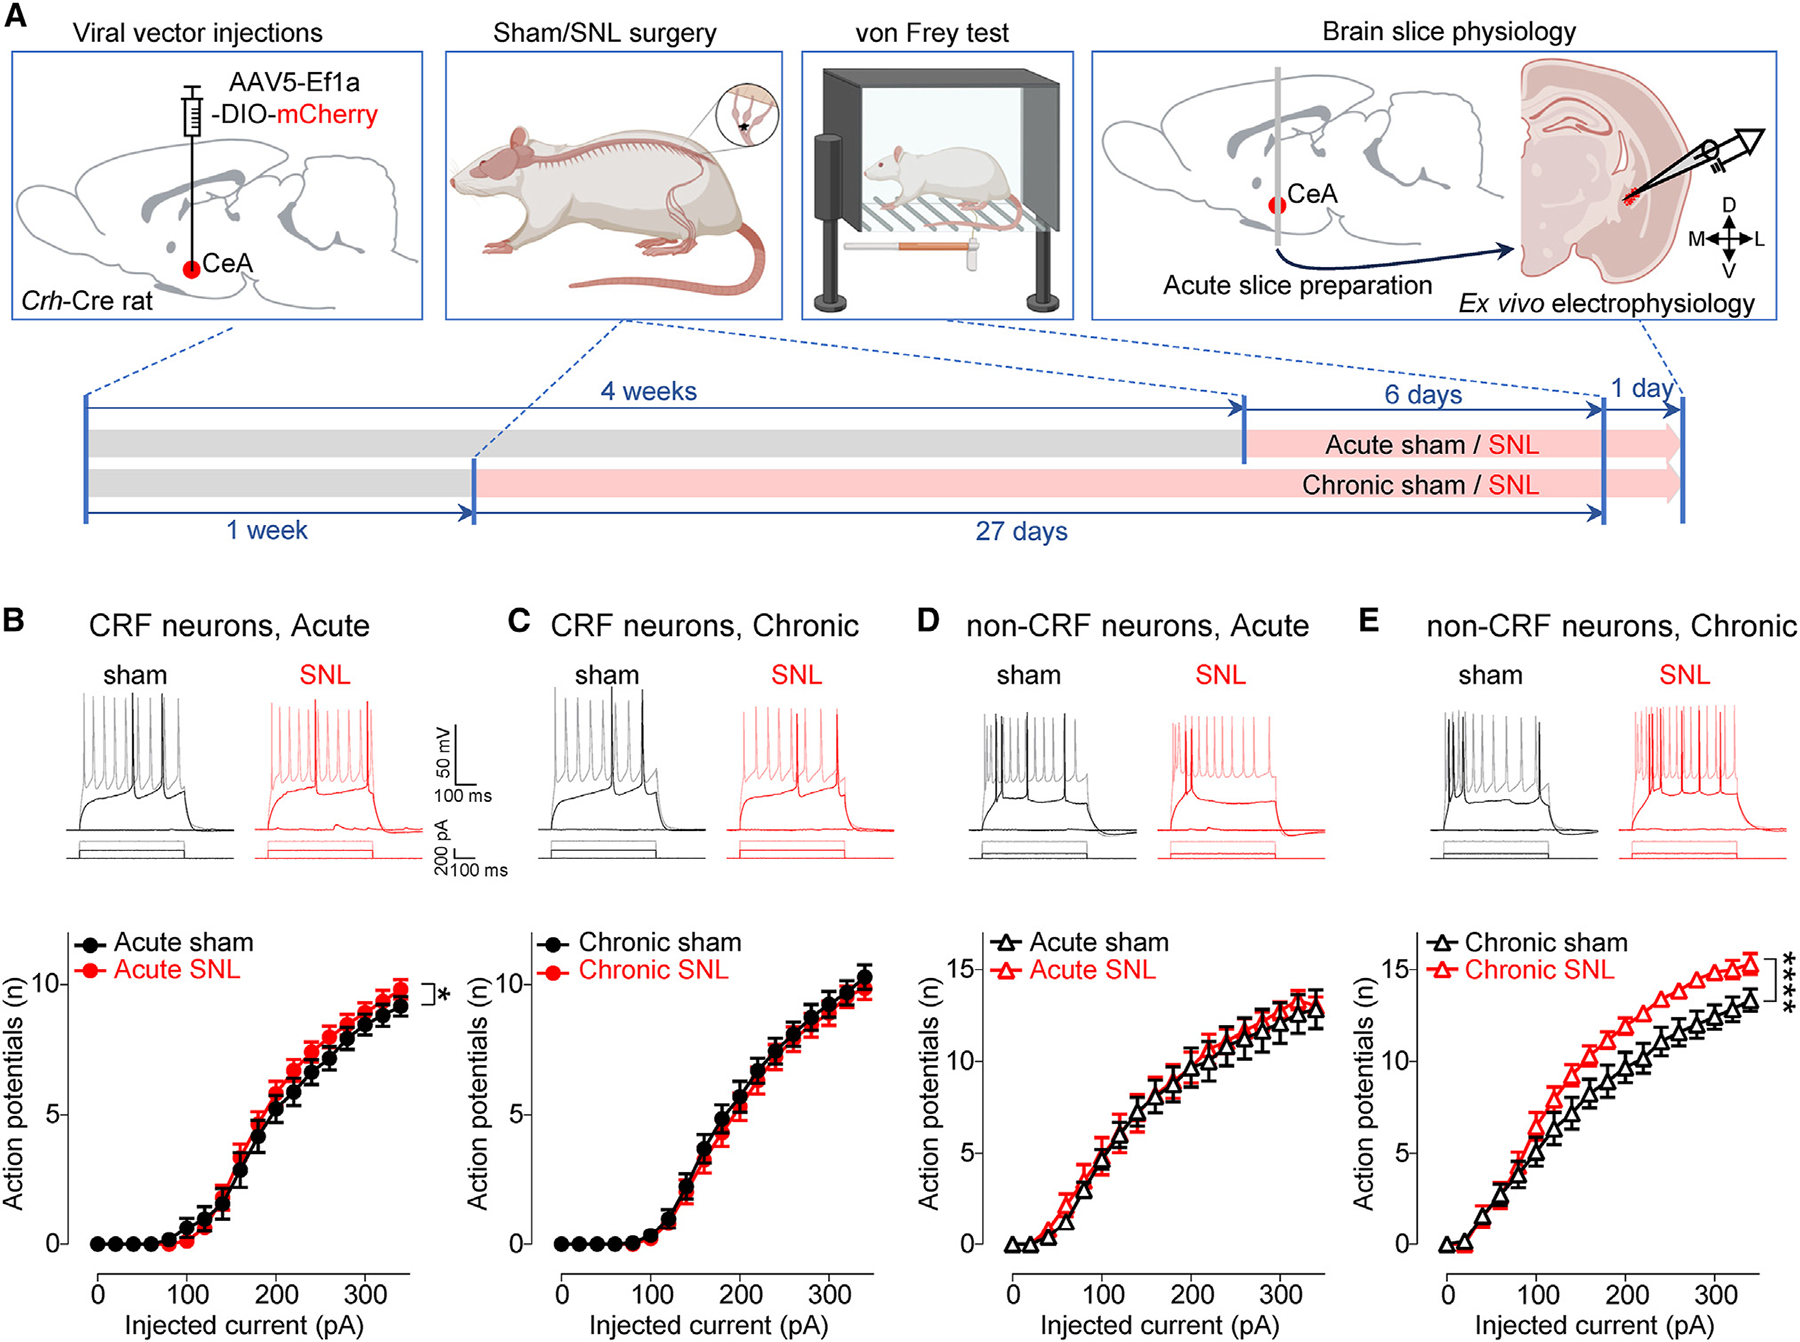
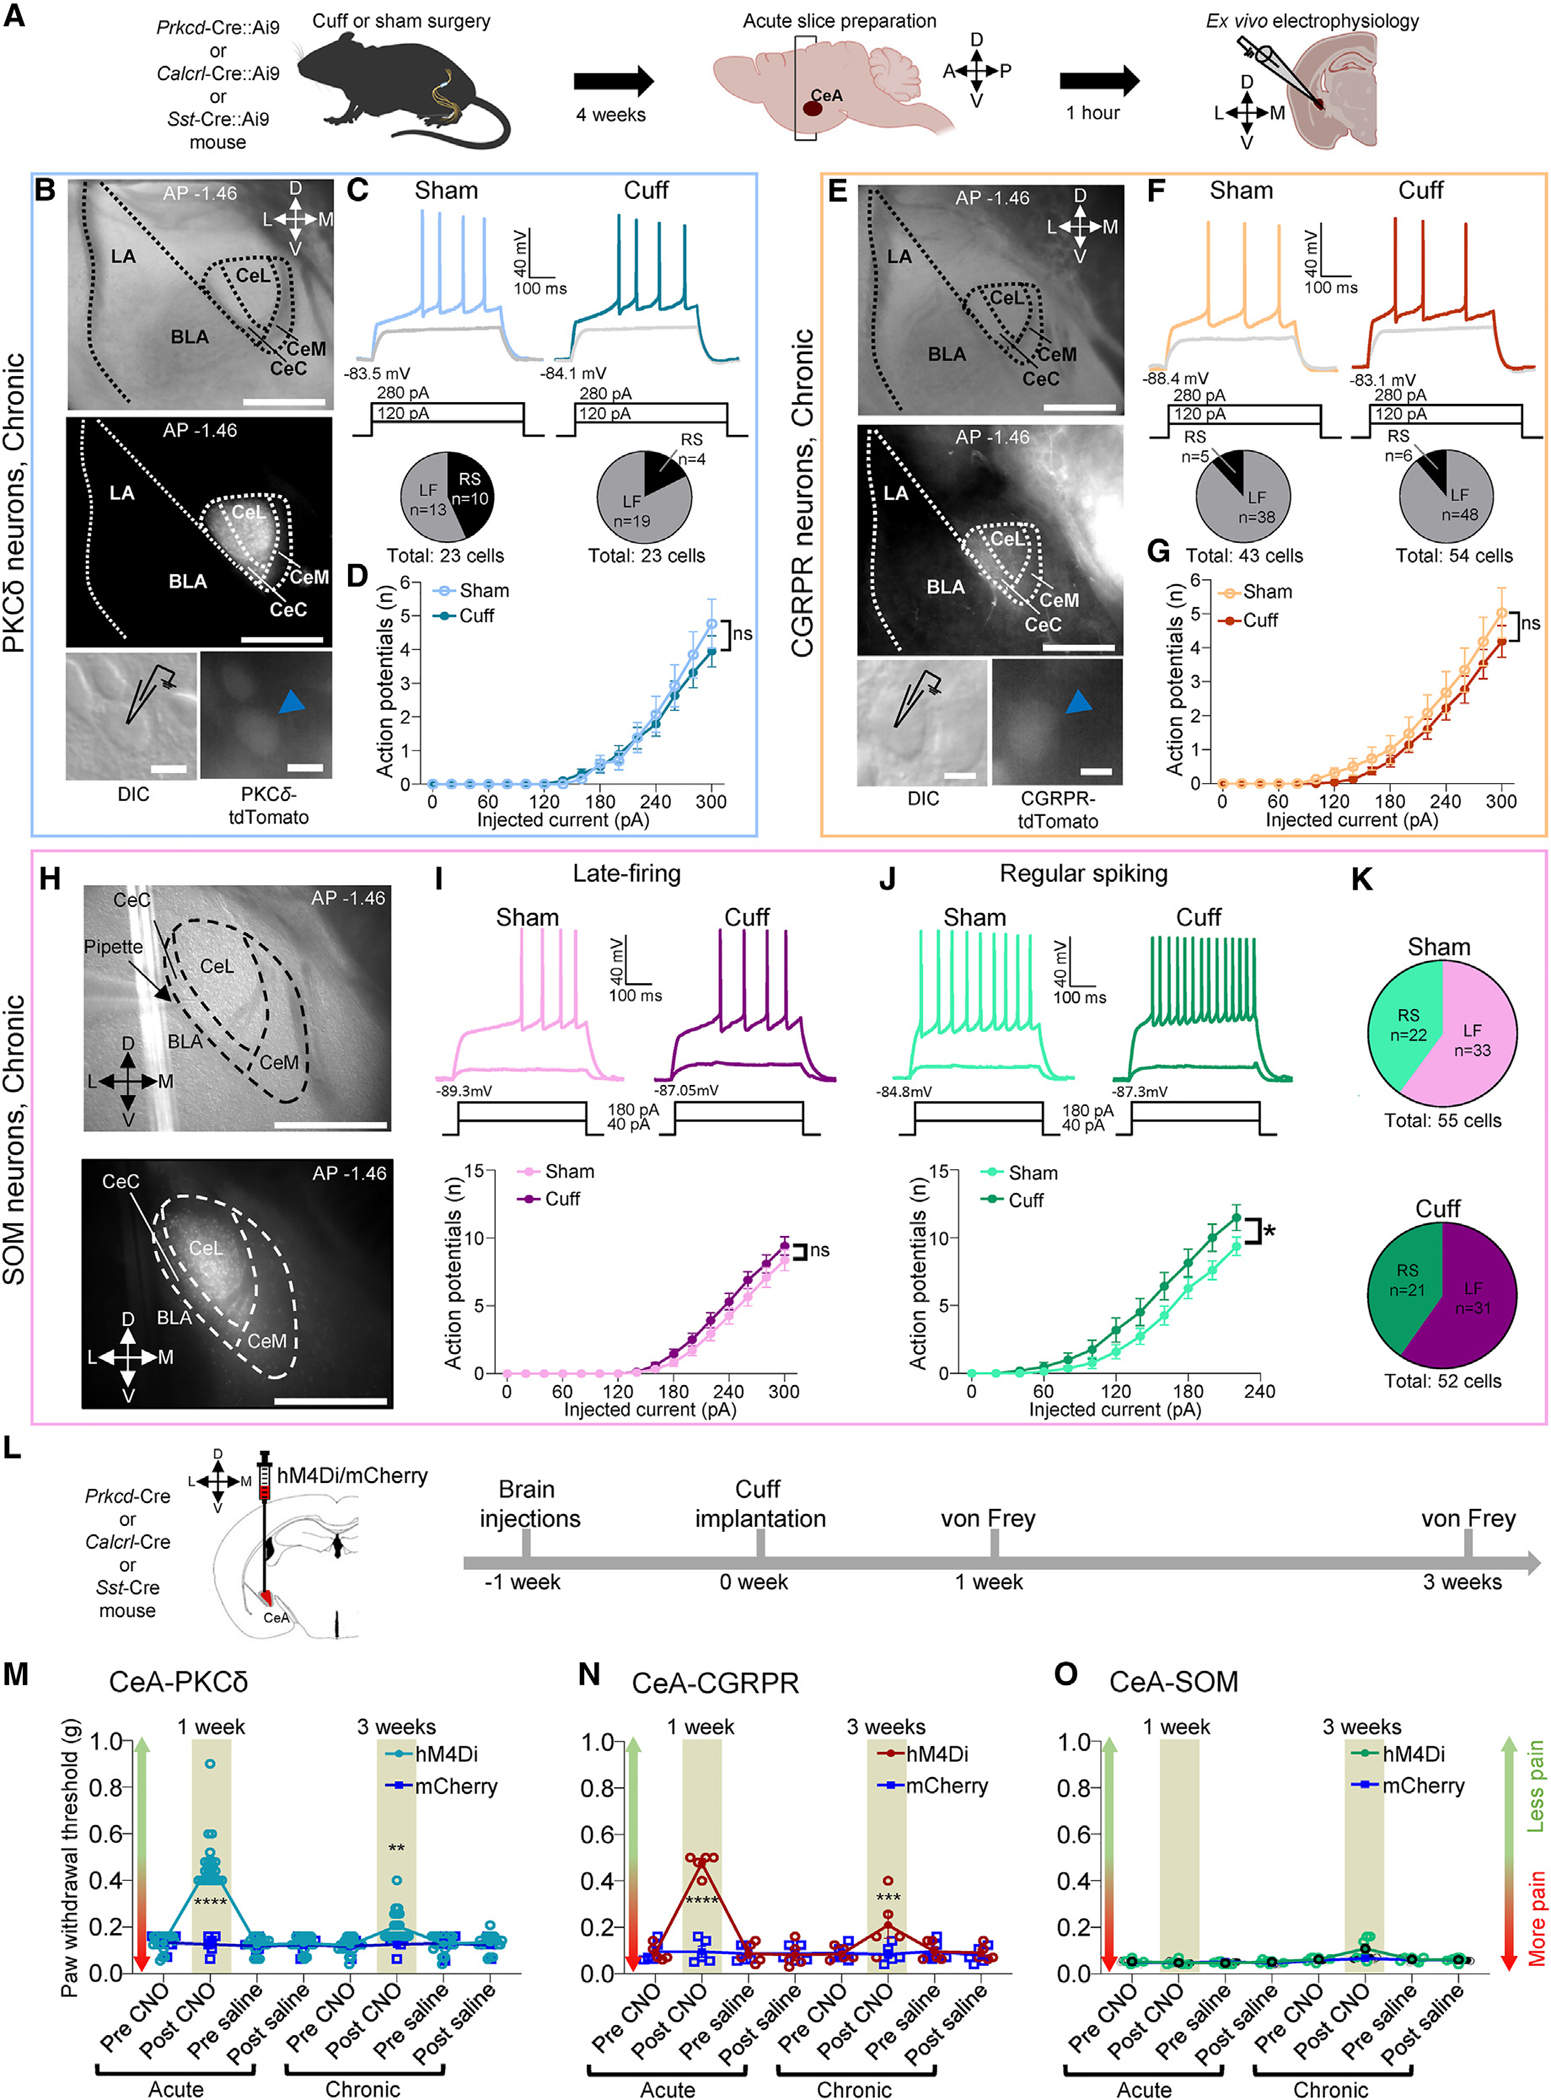
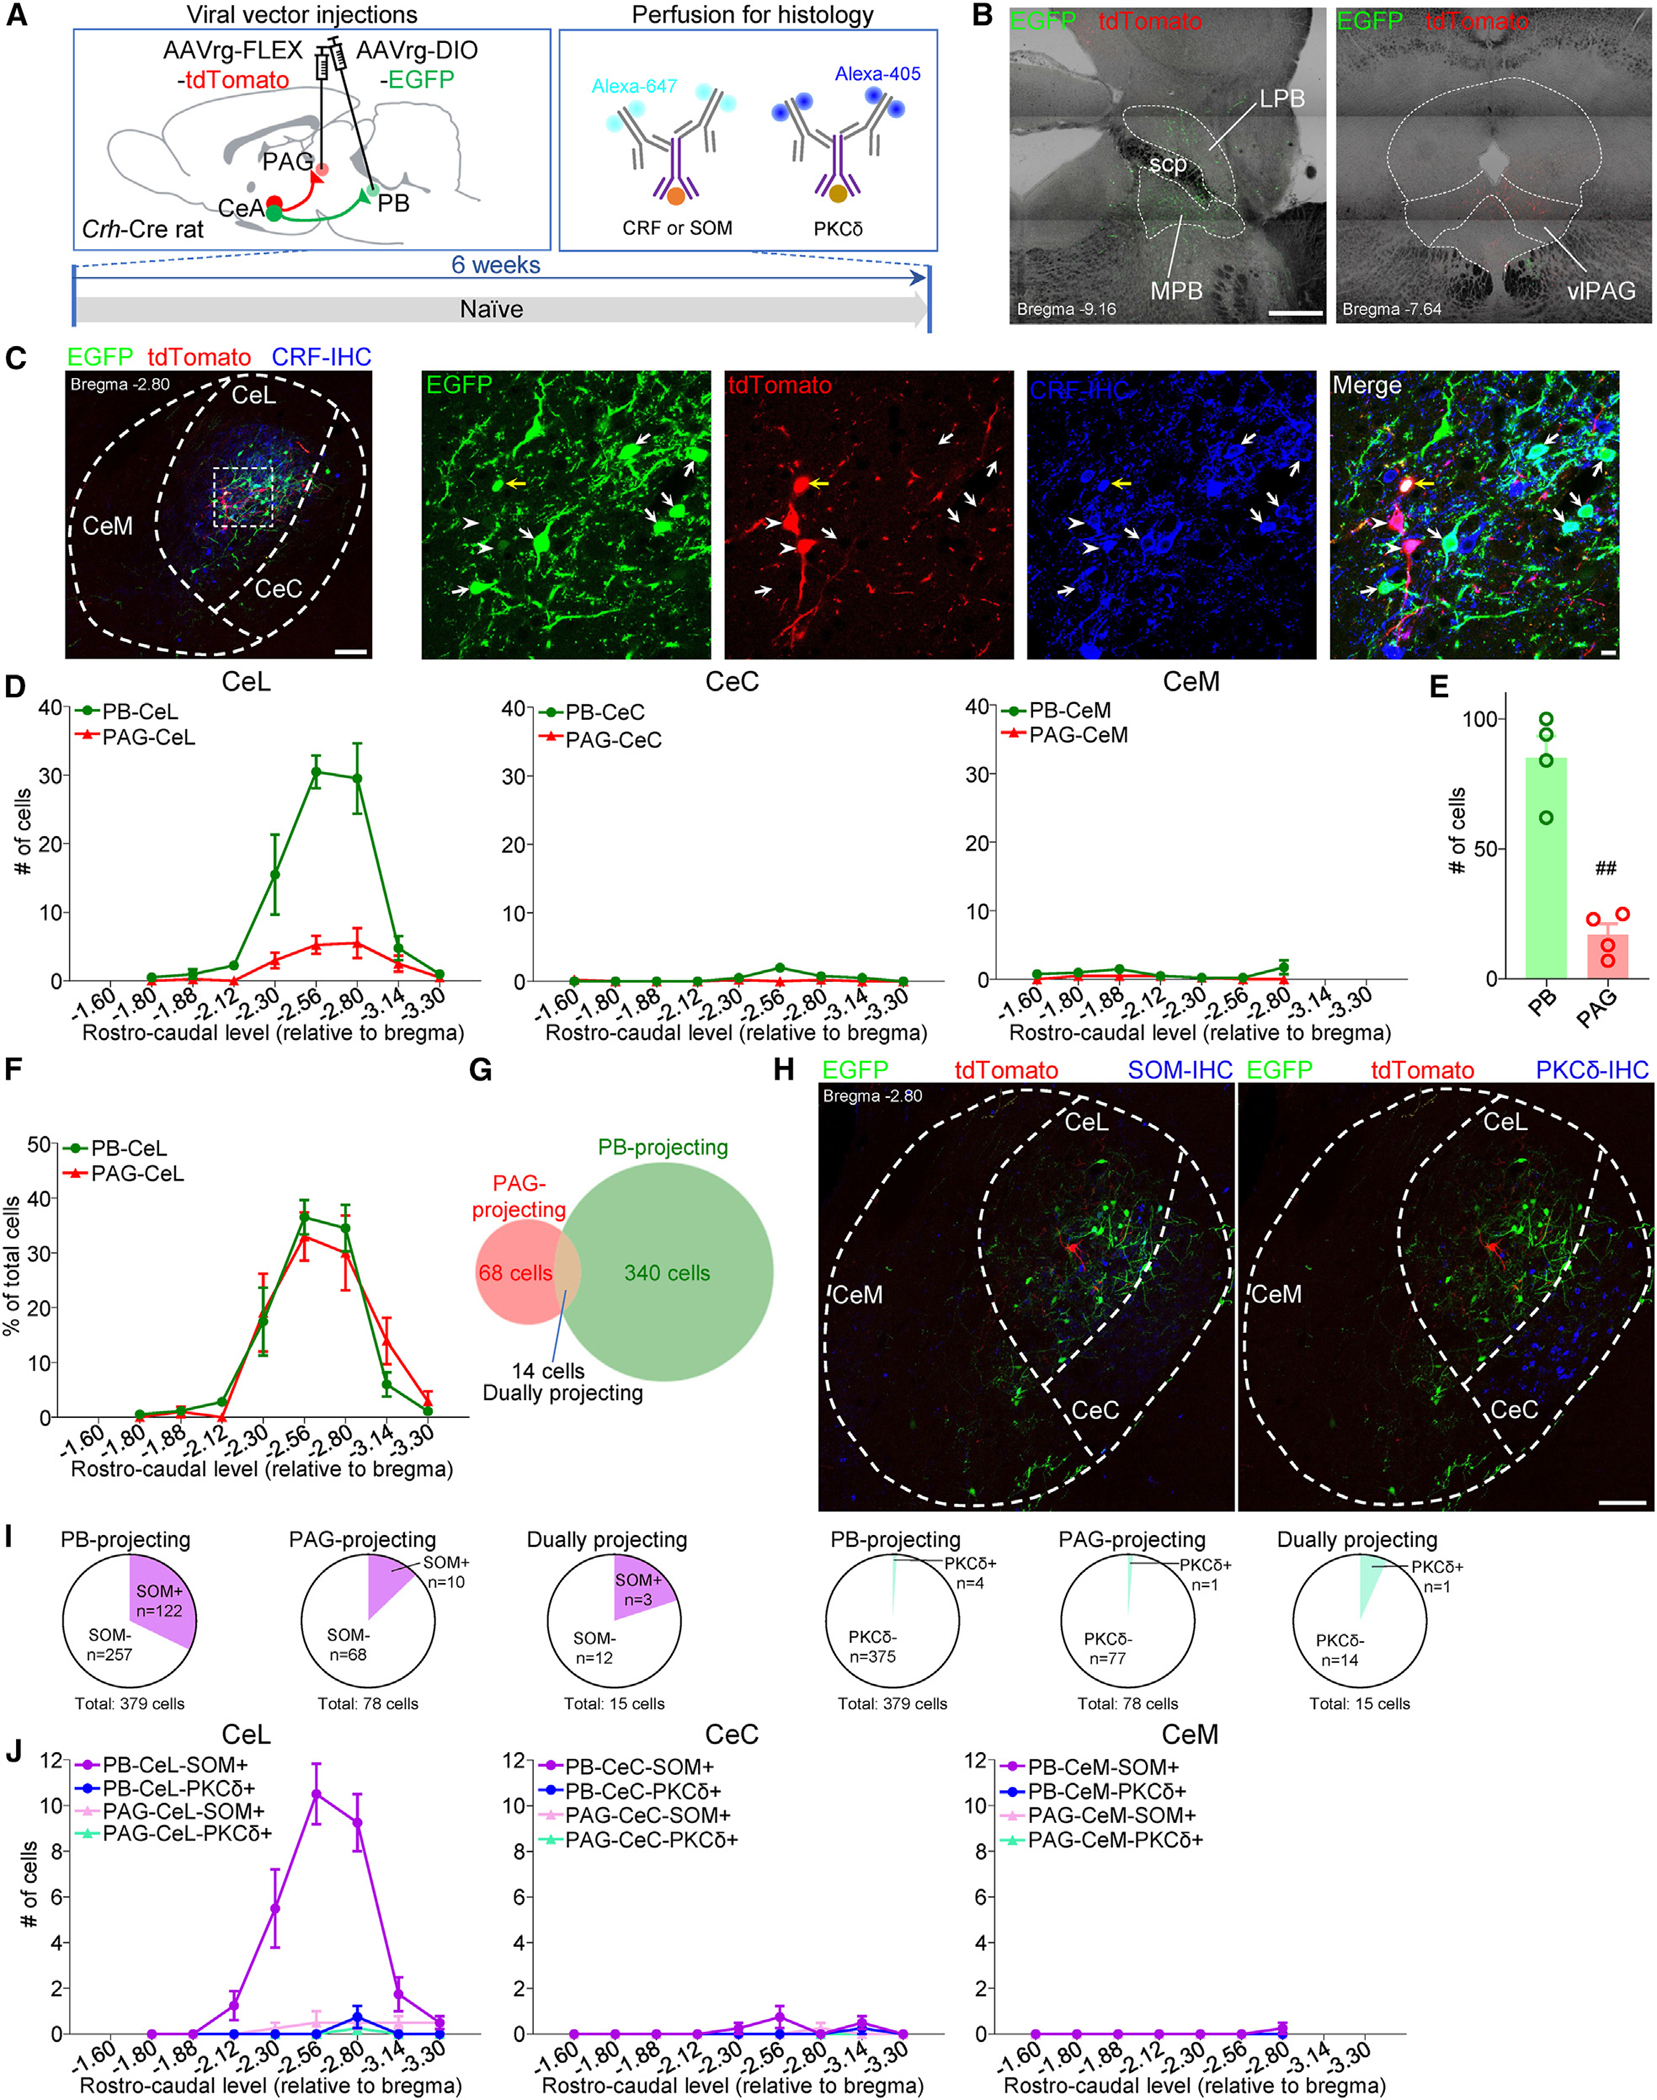
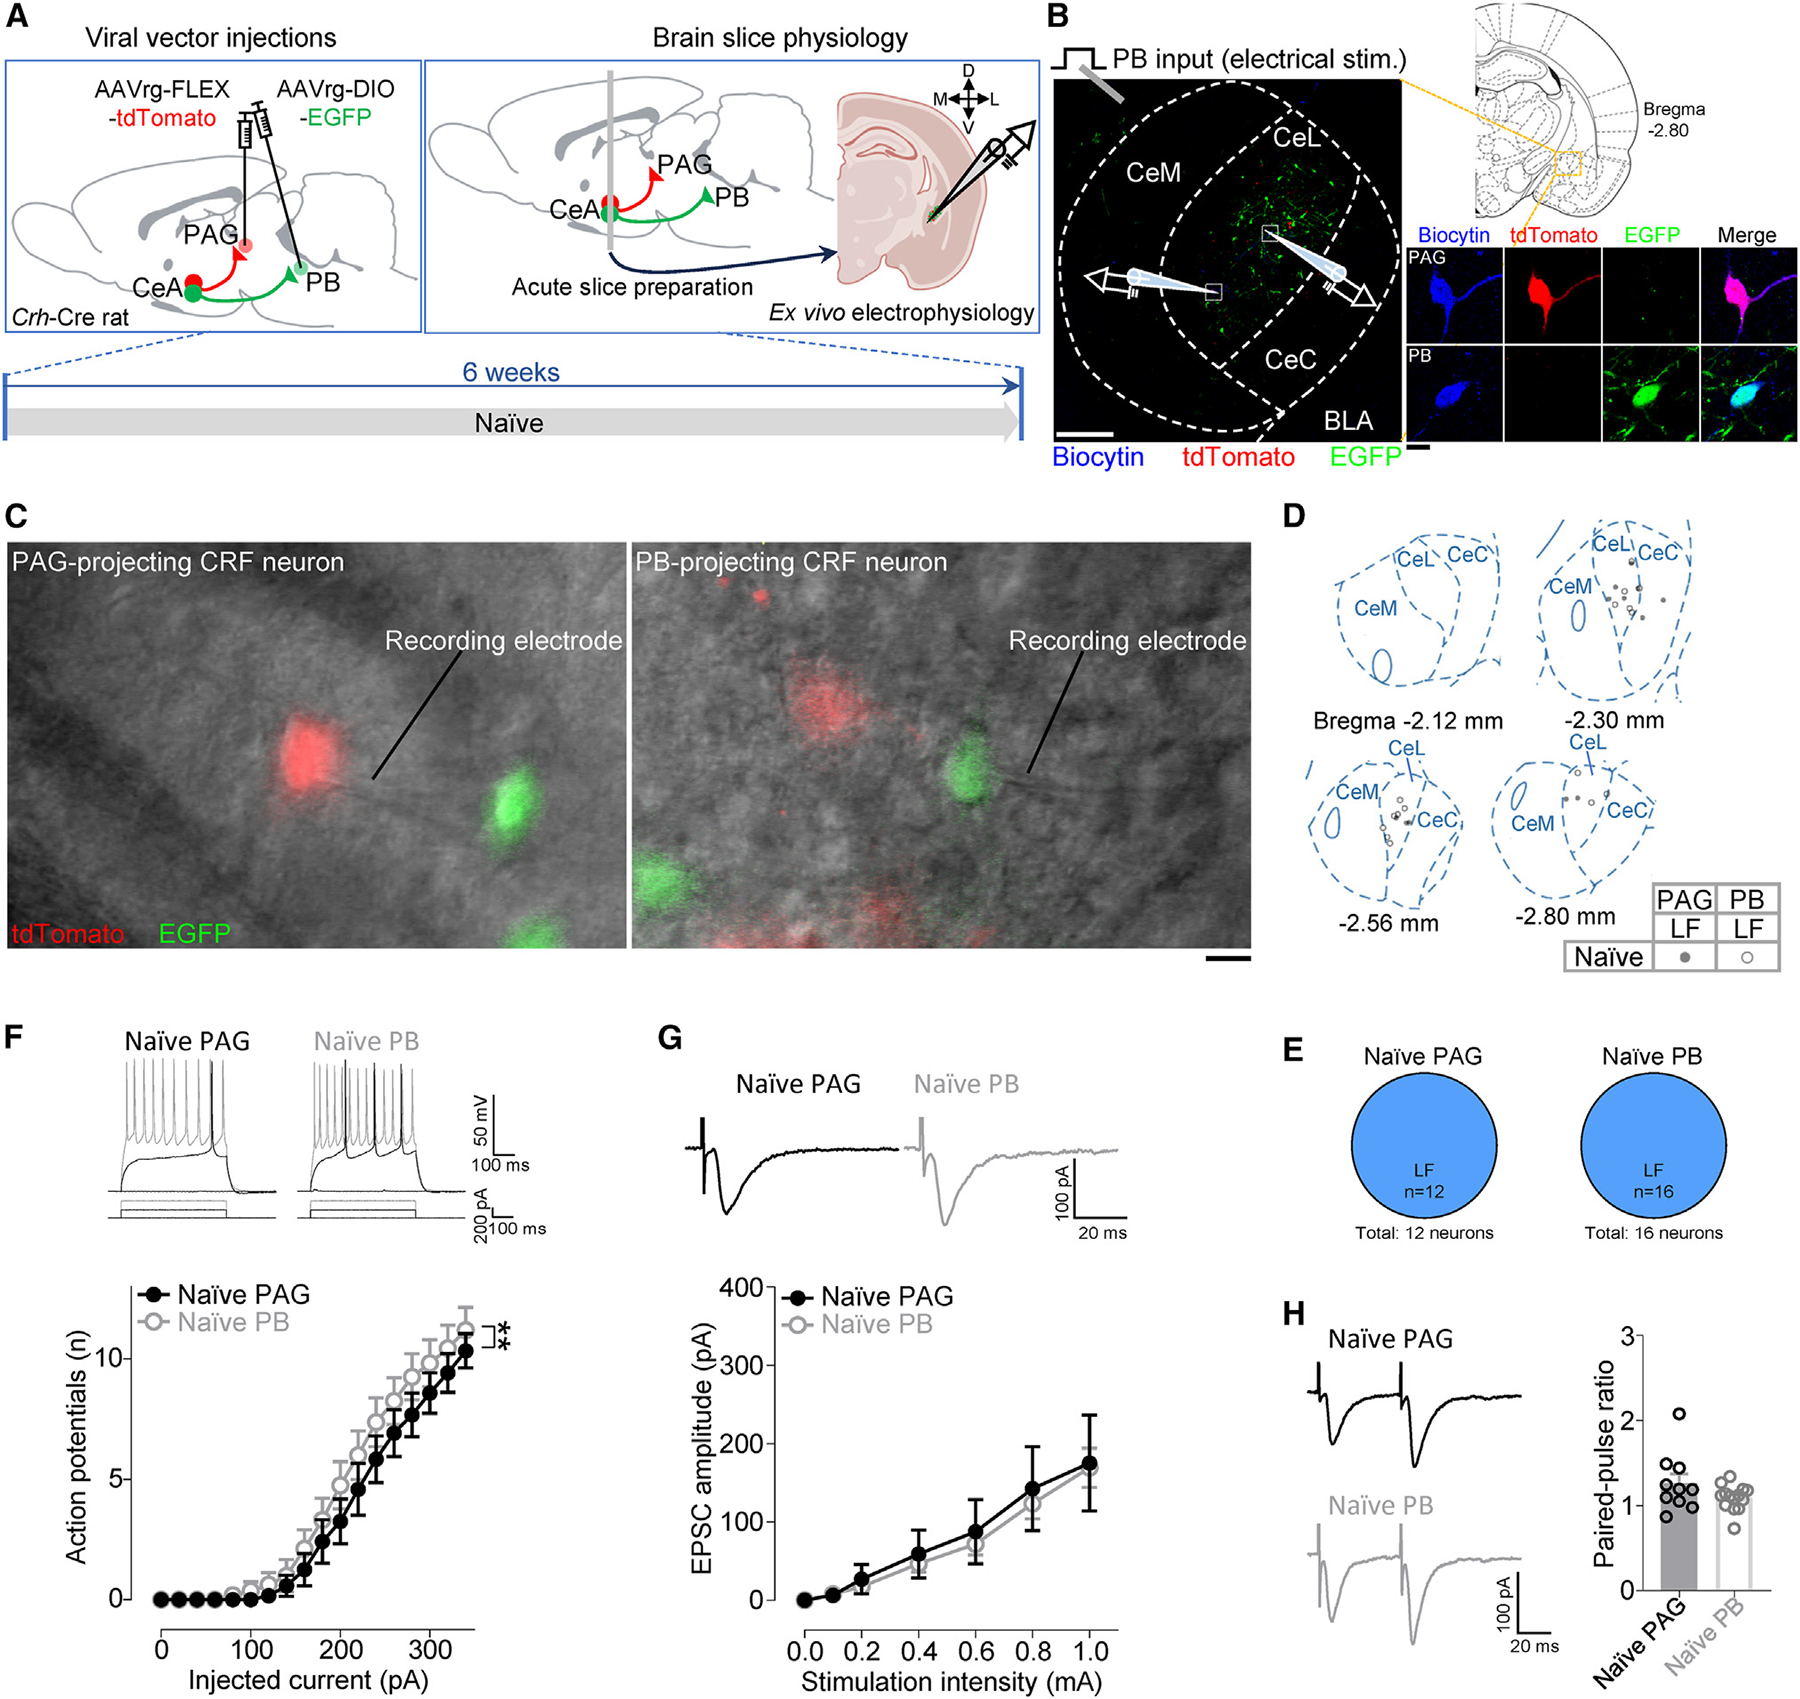
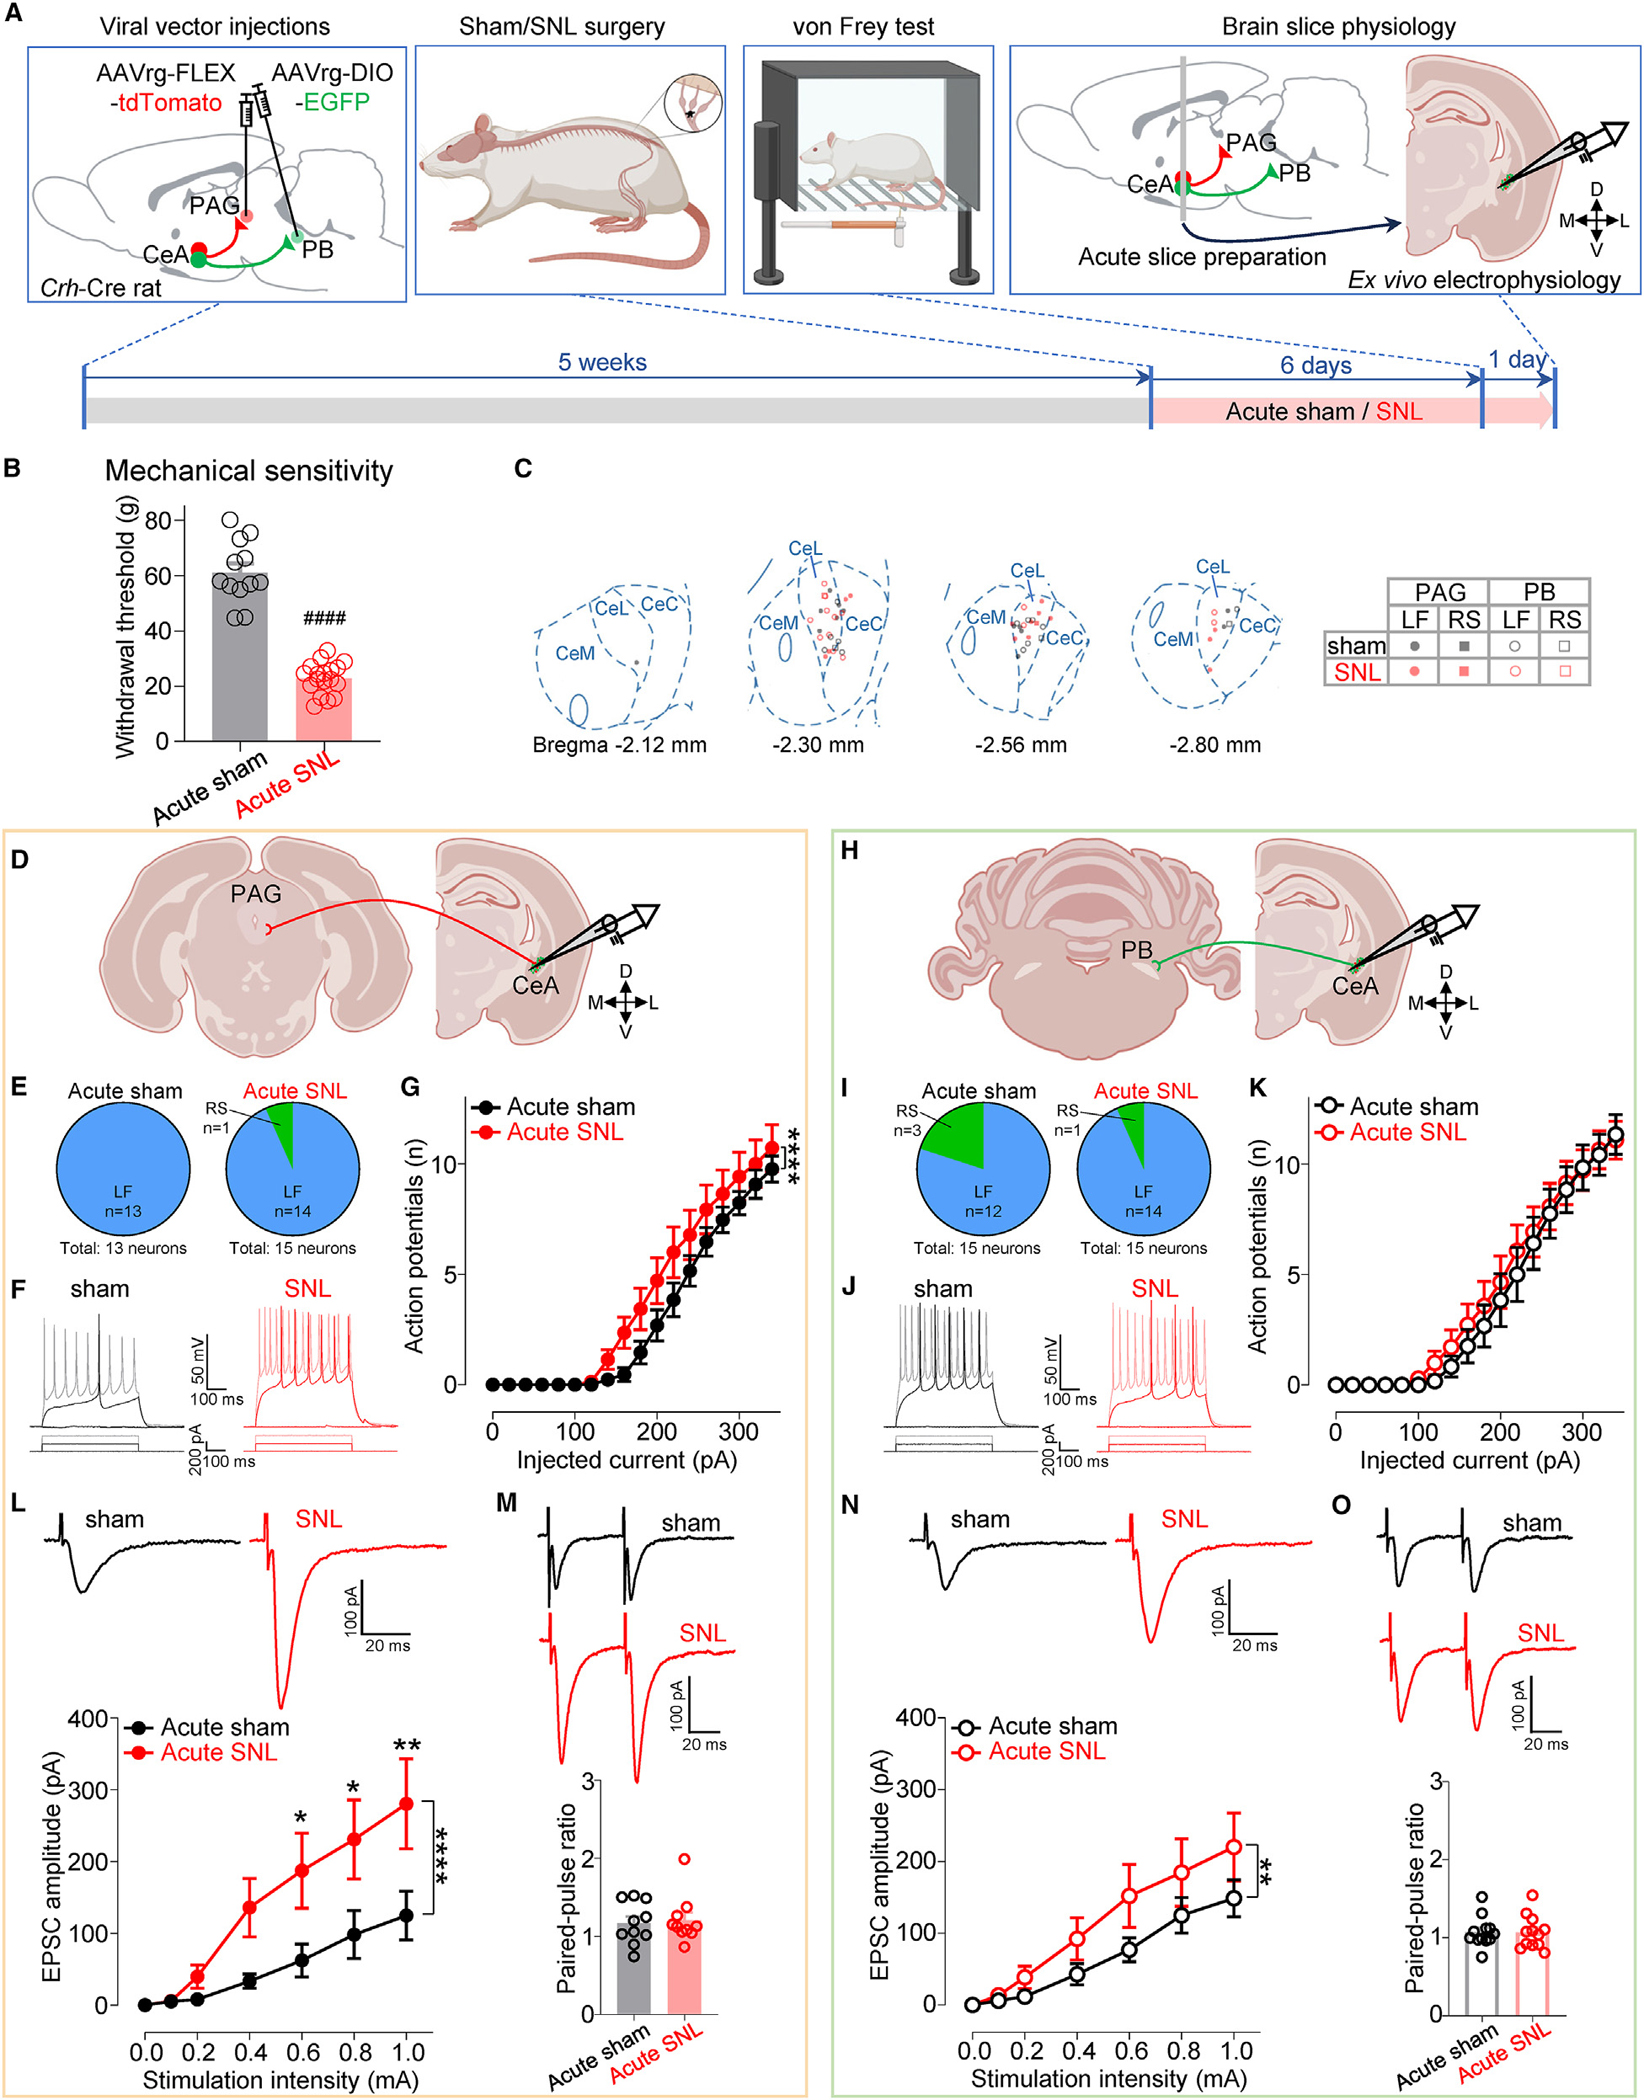
Maladaptive plasticity is linked to the chronification of diseases such as pain, but the transition from acute to chronic pain is not well understood mechanistically. Neuroplasticity in the central nucleus of the amygdala (CeA) has emerged as a mechanism for sensory and emotional-affective aspects of injury-induced pain, although evidence comes from studies conducted almost exclusively in acute pain conditions and agnostic to cell type specificity. Here, we report time-dependent changes in genetically distinct and projection-specific CeA neurons in neuropathic pain. Hyperexcitability of CRF projection neurons and synaptic plasticity of parabrachial (PB) input at the acute stage shifted to hyperexcitability without synaptic plasticity in non-CRF neurons at the chronic phase. Accordingly, chemogenetic inhibition of the PB→CeA pathway mitigated pain-related behaviors in acute, but not chronic, neuropathic pain. Cell-type-specific temporal changes in neuroplasticity provide neurobiological evidence for the clinical observation that chronic pain is not simply the prolonged persistence of acute pain.

Keywords: CP: Neuroscience; CRF; amygdala; corticotropin-releasing factor; electrophysiology; neuropathic pain; neuroplasticity; pain mechanisms; parabrachial nucleus; protein kinase C delta; somatostatin.


Conflict of interest statement

Declaration of interests The authors declare no competing interests.

Figures

Figure 1.
Figure 1.. Distinct types of CRF and non-CRF neurons in brain slices from acute and chronic sham/SNL rats
(A) Experimental design. (B) Paw withdrawal thresholds. Acute sham: n = 17, acute SNL: n = 14, chronic sham: n = 23, chronic SNL: n = 30. ****p < 0.0001, one-way ANOVA with Bonferroni posttests compared with sham controls. (C) Experimental setup. The area delineated by the white dotted square at left is shown at higher magnification at right. Scale bars, 200 μm (left) and 10 μm (right). BLA, basolateral amygdala; CeC, capsular divisions of the CeA; CeL, lateral; CeM, medial. (D) Representative differential interference contrast (DIC) and fluorescent images of a patched mCherry-expressing CRF neuron and a patched mCherry non-CRF neuron in the CeA. Scale bar, 10 μm. (E) Distribution of recorded cells and their firing types. (F) Representative recordings and proportions of CRF cell types based on action potential firing. Acute sham: 22 neurons from 14 rats, acute SNL: 19 neurons from 13 rats, chronic sham: 27 neurons from 18 rats, chronic SNL: 33 neurons from 20 rats. (G) Same as in (F), but for non-CRF cell types. Acute sham: 17 neurons from 10 rats, acute SNL: 17 neurons from 9 rats, chronic sham: 29 neurons from 14 rats, chronic SNL: 33 neurons from 18 rats. Data are represented as mean ± SEM.
Figure 2.
Figure 2.. Loss of PB-driven synaptic plasticity and loss of beneficial behavioral effects of chemogenetic inhibition of CeA-projecting PB neurons in chronic neuropathic pain
(A) Experimental design. (B–E) Representative traces and input-output functions of PB-driven EPSCs in CRF neurons from acute sham (n = 17 neurons from 11 rats), acute SNL (n = 17 neurons from 11 rats), chronic sham (n = 19 neurons from 15 rats), and chronic SNL (n = 27 neurons from 17 rats) rats (B and C), and in non-CRF neurons from acute sham (n = 13 neurons from 10 rats), acute SNL (n = 11 neurons from 7 rats), chronic sham (n = 20 neurons from 13 rats), and chronic SNL (n = 24 neurons from 16 rats) rats (D and E). *p < 0.05; **p < 0.01; ****p < 0.0001; two-way ANOVA with post hoc Bonferroni tests compared with sham controls. (F) Representative traces of PB-driven EPSCs evoked by paired stimulation at 50-ms intervals and summary of PPR in CRF neurons from acute sham (n = 12 neurons from 9 rats) and SNL (n = 12 neurons from 8 rats) rats. (G) Same as in (F), but for chronic sham (n = 10 neurons from 8 rats) and SNL (n = 15 neurons from 12 rats) rats. (H and I) Same as in (F) and (G), but for non-CRF neurons in brain slices from acute sham (n = 11 neurons from 10 rats) and acute SNL (n = 11 neurons from 7 rats) rats (H), and from chronic sham (n = 14 neurons from 10 rats) and chronic SNL (n = 16 neurons from 12 rats) rats (I). NS, not significant, unpaired t test. (J) Experimental approach. (K) Representative image of the AAV8-CMV-LacZ-bGH injection into the right CeA shown in cyan. Scale bar, 1,000 μm. (L) Representative images of the AAV8-hSyn-DIO-hM4Di-mCherry injection into the right PB shown in red. The area delineated by the yellow rectangle at left is shown at higher magnification at right. Scale bars, 1,000 μm (left) and 20 μm (right). (M) Experimental design. (N) Paw withdrawal thresholds in the ipsilateral (left) and contralateral (right) hindpaws before and 1 h after systemic (i.p.) CNO (10 mg/kg) or saline at 1 and 3 weeks after cuff or sham surgery (n = 10 for cuff-hM4Di and cuff-mCherry; n = 11 for sham-hM4Di). Scatter points represent individual mice. ****p < 0.0001; repeated measures two-way ANOVA followed by Dunnett’s multiple comparison test compared with pre-CNO or cuff-mCherry controls. Data are represented as mean ± SEM.
Figure 3.
Figure 3.. Neuronal excitability changes in CeA neurons in the transition from acute and chronic neuropathic pain
(A) Experimental design. (B) Representative voltage responses to depolarizing current pulses and F-I relationship of CRF neurons from acute sham (n = 17 neurons from 11 rats) and acute SNL (n = 17 neurons from 11 rats) rats. (C) Same as in (B), but for chronic sham (n = 20 neurons from 13 rats) and chronic SNL (n = 22 neurons from 10 rats) rats. (D and E) Same as in (B) and (C), but for non-CRF neurons in brain slices from acute sham (n = 12 neurons from 9 rats) and acute SNL (n = 12 neurons from 8 rats) rats (D), and from chronic sham (n = 12 neurons from 8 rats) and chronic SNL (n = 13 neurons from 8 rats) rats (E). *p < 0.05; ****p < 0.0001; two-way ANOVA with post hoc Bonferroni tests. Data are represented as mean ± SEM.
Figure 4.
Figure 4.. Cell-type-specific excitability changes at the chronic phase of neuropathic pain and cell-type- and time-specific effects of chemogenetic inhibition on neuropathic pain behaviors
(A) Experimental design. (B) Representative DIC and fluorescent images of the CeA (top and center). High-magnification DIC and fluorescent images of tdTomato-expressing PKCδ neurons (bottom). LA, lateral amygdala. Scale bars, 500 μm (top and center) and 10 μm (bottom). (C) Representative voltage traces of LF PKCδ neurons in sham and neuropathic conditions (top). Proportions of LF and regular-spiking (RS) PKCδ neurons (bottom). (D) F-I relationship in LF neurons (sham: n = 13 neurons from 6 mice, cuff: n = 19 neurons from 5 mice); ns, not significant, two-way ANOVA. (E) Same as in (B), but for tdTomato-expressing CGRPR neurons. (F and G) Same as in (C) and (D), but for CGRPR neurons (sham: n = 38 neurons from 9 mice, cuff: n = 48 neurons from 12 mice); ns, not significant, two-way ANOVA. (H) Representative DIC (top) and fluorescent images of tdTomato-expressing SOM neurons (bottom) in the CeA. Scale bars in both images, 500 μm. (I) Representative voltage traces of LF SOM neurons recorded in sham and neuropathic conditions (top). F-I relationship in LF SOM neurons (sham: n = 33 neurons from 10 mice, cuff: n = 31 neurons from 11 mice); ns, two-way ANOVA (bottom). (J) Same as in (I), but for RS SOM neurons (sham: n = 22 neurons from 11 mice, cuff: n = 21 neurons from 10 mice); *p < 0.05, two-way ANOVA. (K) Proportions of RS and LF neurons in sham (top) or neuropathic (bottom) conditions. (L) Experimental time line. (M–O) Tactile hypersensitivity shown as the ipsilateral hindpaw withdrawal thresholds before and 1 h after systemic (i.p.) CNO (10 mg/kg) or saline at 1 and 3 weeks after cuff implantation. Scatter points represent individual mice. Repeated measures two-way ANOVA followed by Šídák’s multiple comparison test. CeA-PKCδ neurons (n = 20 for hM4Di and n = 6 for mCherry; 1 week, ****p < 0.0001; 3 weeks, **p < 0.01) (M), CeA-CGRPR neurons (n = 5 for hM4Di and mCherry; 1 week, ****p < 0.0001; 3 weeks, ***p < 0.001) (N), CeA-SOM neurons (n = 6 for hM4Di and n = 5 for mCherry) (O). All values are presented as the mean ± SEM.
Figure 5.
Figure 5.. PAG- and PB-projecting CRF neurons
(A) Experimental time line. (B) Representative images of injection sites in the PB and PAG. LPB, lateral parabrachial nucleus; MPB, medial parabrachial nucleus; scp, superior cerebellar peduncle; vlPAG, ventrolateral PAG. Scale bar, 500 μm. (C) Immunohistochemical verification of the specificity of retrogradely labeled PAG- and PB-projecting CRF neurons in the CeA. The area delineated by the white dotted square at left is shown at higher magnification in the right panels. Scale bars, 100 μm (left) and 10 μm (right). White arrows indicate EGFP-labeled PB-projecting CRF neurons. White arrowheads indicate tdTomato-labeled PAG-projecting CRF neurons. Yellow arrow indicates dually projecting CRF neurons. (D) Rostro-caudal distribution of PB- and PAG-projecting CRF neurons in CeL, CeC, and CeM (n = 4 rats). (E) Total number of PB- and PAG-projecting CRF neurons in the CeL (n = 4 rats). ##p < 0.01, paired t test. (F) Rostro-caudal distributions of PB- and PAG-projecting CRF neurons in the CeL expressed as percentage of total labeled cells (n = 4 rats). (G) Venn diagram showing the number of overlapping and non-overlapping PB- and PAG-projecting CRF neurons in the CeL (n = 4 rats). (H) Representative images of SOM (left) and PKCδ (right) IHC. Scale bar, 100 μm. (I) Summary of colocalization analysis for SOM (left) and PKCδ (right) with CRF neurons (n = 4 rats). (J) Rostro-caudal distributions of colocalization of PB- and PAG-projecting CRF neurons with SOM and PKCδ IHC in the CeL, CeC, and CeM (n = 4 rats). Data are represented as mean ± SEM.
Figure 6.
Figure 6.. Baseline electrophysiological comparison of PAG- and PB-projecting CRF neurons
(A) Experimental time line. (B) Experimental setup. The area delineated by the white dotted square at left is shown at higher magnification at right. Scale bars, 200 μm (left) and 10 μm (right). (C) Representative DIC and fluorescent images of a patched tdTomato-expressing PAG-projecting CRF neuron (left) and a patched EGFP-expressing PB-projecting CRF neuron (right) in the CeA. Scale bar, 10 μm. (D) Anatomical location of recorded cells and their firing types. (E) Proportions of firing types of PAG- (12 neurons from 9 rats) and PB-projecting (16 neurons from 12 rats) CRF neurons in brain slices from naive animals. (F) Representative voltage responses to depolarizing current pulses and excitability (F-I relationship) of PAG- (n = 12 neurons from 9 rats) and PB-projecting (n = 16 neurons from 12 rats) CRF neurons. (G) Representative traces and input-output functions of PB-driven EPSCs in PAG- (n = 10 neurons from 8 rats) and PB-projecting (n = 14 neurons from 12 rats) CRF neurons. (H) Representative traces and PPR (50-ms intervals) for PB-driven EPSCs in PAG- (n = 10 neurons from 8 rats) and PB-projecting (n = 14 neurons from 12 rats) CRF neurons. **p < 0.01, two-way ANOVA. Data are represented as mean ± SEM.
Figure 7.
Figure 7.. Pain-related changes in PAG- and PB-projecting CRF neurons at the acute neuropathic pain stage
(A) Experimental design. (B) Paw withdrawal thresholds (sham: n = 12, SNL: n = 18). ####p < 0.0001, unpaired t test. (C) Location of recorded cells and their firing types. (D) Recordings from PAG-projecting CeA-CRF neurons. (E) Proportions of firing types of PAG-projecting CRF neurons in brain slices from acute sham (13 neurons from 10 rats) and acute SNL (15 neurons from 11 rats) rats. (F) Representative voltage responses of PAG-projecting CRF neurons from acute sham/SNL rats to depolarizing current pulses. (G) Excitability (F-I relationship) of PAG-projecting LF-CRF neurons from acute sham (n = 13 neurons from 10 rats) and acute SNL (n = 14 neurons from 11 rats) rats. (H–K) Same as in (D)–(G), but for PB-projecting CeA-CRF neurons from acute sham (15 neurons from 10 rats) and acute SNL (15 neurons from 13 rats) rats (I), and from acute sham (n = 12 neurons from 9 rats) and acute SNL (n = 14 neurons from 12 rats) rats (K). (L) Representative traces and input-output functions of PB-driven EPSCs in PAG-projecting CRF neurons from acute sham (n = 11 neurons from 8 rats) and acute SNL (n = 10 neurons from 10 rats) rats. (M) Representative traces of PB-driven EPSCs evoked by paired stimulation at 50-ms intervals and summary of PPR in PAG-projecting CRF neurons from acute sham (n = 10 neurons from 8 rats) and acute SNL (n = 10 neurons from 10 rats) rats. (N and O) Same as in (L) and (M) but for PB-projecting CRF neurons from acute sham (n = 12 neurons from 9 rats) and acute SNL (n = 12 neurons from 11 rats) rats (N), and from acute sham (n = 12 neurons from 9 rats) and acute SNL (n = 12 neurons from 11 rats) rats (O). *p < 0.05, **p < 0.01, ****p < 0.0001, two-way ANOVA with post hoc Bonferroni tests compared with sham controls. Data are represented as mean ± SEM.

References

    1. Cramer SC, Sur M, Dobkin BH, O’Brien C, Sanger TD, Trojanowski JQ, Rumsey JM, Hicks R, Cameron J, Chen D, et al. (2011). Harnessing neuroplasticity for clinical applications. Brain 134, 1591–1609. 10.1093/brain/awr039. - DOI - PMC - PubMed
    1. Dhuriya YK, and Sharma D (2020). Neuronal Plasticity: Neuronal Organization is Associated with Neurological Disorders. J. Mol. Neurosci. 70, 1684–1701. 10.1007/s12031-020-01555-2. - DOI - PubMed
    1. Colloca L, Ludman T, Bouhassira D, Baron R, Dickenson AH, Yarnitsky D, Freeman R, Truini A, Attal N, Finnerup NB, et al. (2017). Neuropathic pain. Nat. Rev. Dis. Primers 3, 1–20. 10.1038/nrdp.2017.2. - DOI - PMC - PubMed
    1. Farmer MA, Baliki MN, and Apkarian AV (2012). A dynamic network perspective of chronic pain. Neurosci. Lett. 520, 197–203. 10.1016/j.neulet.2012.05.001. - DOI - PMC - PubMed
    1. Breivik H, Eisenberg E, and O’Brien T; OPENMinds (2013). The individual and societal burden of chronic pain in Europe: The case for strategic prioritisation and action to improve knowledge and availability of appropriate care. BMC Publ. Health 13, 1229. 10.1186/1471-2458-13-1229. - DOI - PMC - PubMed

Publication types

LinkOut - more resources