. 2024 Aug 27;121(35):e2407324121.
doi: 10.1073/pnas.2407324121. Epub 2024 Aug 23.

L-type Ca2+ channel activation of STIM1-Orai1 signaling remodels the dendritic spine ER to maintain long-term structural plasticity

Affiliations

L-type Ca2+ channel activation of STIM1-Orai1 signaling remodels the dendritic spine ER to maintain long-term structural plasticity

Philip J Dittmer et al. Proc Natl Acad Sci U S A. .

Abstract

Learning and memory require coordinated structural and functional plasticity at neuronal glutamatergic synapses located on dendritic spines. Here, we investigated how the endoplasmic reticulum (ER) controls postsynaptic Ca2+ signaling and long-term potentiation of dendritic spine size, i.e., sLTP that accompanies functional strengthening of glutamatergic synaptic transmission. In most ER-containing (ER+) spines, high-frequency optical glutamate uncaging (HFGU) induced long-lasting sLTP that was accompanied by a persistent increase in spine ER content downstream of a signaling cascade engaged by N-methyl-D-aspartate receptors (NMDARs), L-type Ca2+ channels (LTCCs), and Orai1 channels, the latter being activated by stromal interaction molecule 1 (STIM1) in response to ER Ca2+ release. In contrast, HFGU stimulation of ER-lacking (ER-) spines expressed only transient sLTP and exhibited weaker Ca2+ signals noticeably lacking Orai1 and ER contributions. Consistent with spine ER regulating structural metaplasticity, delivery of a second stimulus to ER- spines induced ER recruitment along with persistent sLTP, whereas ER+ spines showed no additional increases in size or ER content in response to sequential stimulation. Surprisingly, the physical interaction between STIM1 and Orai1 induced by ER Ca2+ release, but not the resulting Ca2+ entry through Orai1 channels, proved necessary for the persistent increases in both spine size and ER content required for expression of long-lasting late sLTP.

Keywords: long-term potentiation; store-operated Ca2+ channels; stromal interaction molecule 1; voltage-gated Ca2+ channels.


Conflict of interest statement

Competing interests statement:The authors declare no competing interest.

Figures
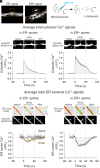
Fig. 1.
Fig. 1.
ER content in spines differentially regulates postsynaptic Ca2+ signals. (A) High-resolution images of ER-moxGFP expressed in ER− (Left) and ER+ spines (Right). Each neuron is outlined in orange using iRFP702 fluorescence as a cytosolic marker. (B) L-Glutamate release from MNI-caged-L-Glutamate using a 405 nm laser. (C, Top) Representative jRGECO1a images of ER− spines before, during, and after a HFGU train. (Bottom) Mean (black traces) ± SEM (gray bars) HFGU-evoked Ca2+ signals in ER− spines (N = 9, n = 22). (D, Top) Representative jRGECO1a images of ER+ spines before, during, and after a HFGU train. (Bottom) HFGU-evoked cytosolic Ca2+ signals in ER+ spines (N = 19, n = 29). Yellow arrows identify neighboring spines. (E, Top) Representative pseudocolored D1ER and jRGECO1a images of ER− spines before, during, and after HFGU. The indicator bar to the Right of the images shows the range of FRET ratios from maximum (red) to minimum (blue). (Bottom) HFGU-evoked ER Ca2+ depletion in ER− spines (N = 3, n = 4, background measurements) compared to adjoining shafts (N = 5, n = 5, D1ER measurements). (F, Top) Pseudocolored D1ER FRET and jRGECO1a images of ER+ spines before, during, and after HFGU. (Bottom) HFGU-evoked ER Ca2+ depletion in ER− spines (N = 11, n = 16). Black and white circles indicate the region of HFGU. (Scale bar, 2 μm.)
Fig. 2.
Fig. 2.
Activity-driven ER Ca2+ depletion is triggered by LTCC-mediated RyR Ca2+ release. (A) Pseudocolored D1ER FRET images of ER+ spines before, during, and after a HFGU train. The indicator bar to the Right of the images shows the max FRET ratio (red) to min FRET ratio (blue). The black dot indicates the region of HFGU. (B, Right) Graphical depiction of each pharmacological manipulation. (Left) Mean (solid line) ± SEM (bars) HFGU-evoked ER Ca2+ depletion in untreated (black, N = 11, n = 16) compared to MK801 (red, N = 11, n = 20), nimodipine (blue, N = 8, n = 15), or ryanodine (green, N = 8, n = 22) treated ER+ spines. (C) Dot plot with a bar graph showing individual integrated ER Ca2+ depletion in untreated (formula image) versus MK801 (formula image), nimodipine (formula image), and ryanodine (formula image) treated ER+ spines. All treatments significantly block ER Ca2+ depletion. (D) Mechanism for HFGU-evoked ER Ca2+ signals in ER+ spines.
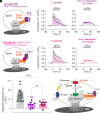
Fig. 3.
Fig. 3.
Ca2+ release-activated STIM1–Orai1 Ca2+ entry enhances cytosolic Ca2+ signals in ER+ spines. (A) Orai1,2 inhibition by the pore blocker, Synta66. (B) Mean (solid line) ± SEM (bars) HFGU-evoked cytosolic Ca2+ signals in untreated (gray, N = 19, n = 29) versus Synta66 treated (purple, N = 5, n = 8) ER+ spines. (C) Resultant “Orai1,2 dependent” Ca2+ signal after subtracting residual Ca2+ signal after Synta66 treatment (purple trace) from total untreated Ca2+ signal (gray trace). (D) Blockage of STIM1 binding to Orai1 by AnCoA4. (E) Mean ± SEM HFGU-evoked cytosolic Ca2+ signals in untreated versus AnCoA4 treated (purple, N = 5, n = 9) ER+ spines. (F) “Orai1-dependent” Ca2+ signal after subtracting residual Ca2+ signal after AnCoA4 treatment (magenta trace) from total untreated Ca2+ signal (gray trace). (G) Dot plot with a bar graph showing individual integrated Orai1,2-dependent Ca2+ signals (formula image) and Orai1-dependent Ca2+ signals (formula image) compared to total cytosolic Ca2+ signals (formula image). Both Orai1,2-dependent and Orai1-dependent Ca2+ signals are significantly smaller than untreated total cytosolic Ca2+ signals, but Orai1,2-dependent and Orai1-dependent Ca2+ signals are not significantly different. (H) Graphical illustration of signal enhancement in ER+ spines.
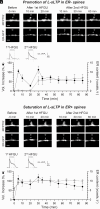
Fig. 4.
Fig. 4.
Spine ER content determines the persistence of sLTP expression. (A) Representative images of spine volume (iRFP) and ER content (ER-moxGFP) in ER− spines in response to a HFGU train. (B) HFGU-evoked mean ± SEM time course of spine volume and ER content changes in ER− spines (N = 6, n = 7). (Top) Inset showed the average HFGU-evoked Ca2+ signal in these ER− spines. (C) Comparison of initial sizes for ER− spines (N = 20, n = 54), ER+ spines primed for L-sLTP (N = 18, n = 41), and ER+ spines refractory to L-sLTP (N = 5, n = 7). (D) Representative images of spine volume and ER content in ER+ spines primed for expression of L-sLTP. (E) HFGU-evoked mean ± SEM time course of spine volume and ER content changes in ER+ spines primed for expression of L-sLTP (N = 7, n = 8). (Top) Inset showed the average HFGU-evoked Ca2+ signals in these ER+ spines primed for L-sLTP. (F) Unpaired t test comparison plot shows no significant difference in the initial sizes of ER− spines and primed ER+ spines. (G) Representative images of spine volume and ER content in the subset of ER+ spines refractory to HFGU-induced L-sLTP. (H) Mean ± SEM time course of spine volume and ER content changes in ER+ spines refractory to L-sLTP (N = 5, n = 7). Inset showed average HFGU-evoked Ca2+ signals in these refractory ER+ spines. (I) Unpaired t test comparison plot shows that the initial sizes of ER− spines and refractory ER+ spines are significantly different. White circles indicate region of HFGU. (Scale bar, 2 μm.)
Fig. 5.
Fig. 5.
Repetitive stimulation induces L-sLTP in ER− spines but renders ER+ spines refractory to additional sLTP induction. (A) Representative images of spine volume and ER content in ER− spines stimulated by a single HFGU train and then 20 min later by a second HFGU train. (B) Mean Ca2+ signals (Top Insets) and mean ± SEM time course of changes in volume and ER content of ER− spines (N = 4, n = 8) evoked by repetitive HFGU stimulation. (C) Representative images of spine volume and ER content in ER+ spines stimulated by repetitive HFGU stimulation. (D) Mean Ca2+ signals (Top Insets) and mean ± SEM time course of changes in volume and ER of ER+ spines (N = 6, n = 10) evoked by repetitive HFGU stimulation. White circles indicate region of HFGU. (Scale bar, 2 μm.)
Fig. 6.
Fig. 6.
LTCC-RyR-STIM1 signaling controls L-sLTP in ER+ spines. (A) Mean ± SEM time course of HFGU-evoked changes in volume (left) and ER content (right) in nimodipine-treated ER+ spines (Blue, N = 4, n = 7) compared to untreated ER+ spines (Gray, N = 7, n = 8). (B) Mean ± SEM time course of HFGU-evoked changes in volume (left) and ER content (right) in ryanodine treated ER+ spines (Green, N = 4, n = 7) versus untreated ER+ spines. (C) Mean ± SEM time course of HFGU-evoked changes in volume (left) and ER content (right) in ER+ spines with STIM1 expression knocked down by pSilencer-shSTIM1 (Orange, N = 4, n = 7) compared to ER+ spines expressing the empty pSilencer vector (Gray, N = 3, n = 9).
Fig. 7.
Fig. 7.
Interaction between Orai1 and STIM1, but not Orai1-mediated Ca2+ entry, is required for L-sLTP. (A, Top) Images of ER+ spine volumes treated with Synta66 before, during, and after HFGU. (Bottom) Mean ± SEM time course of HFGU-evoked volume changes in untreated ER+ spines (N = 5, n = 7) compared to Synta66 treated ER+ spines (N = 6, n = 8). (B, Top) Images of ER content in ER+ spines treated with Synta66 in response to HFGU. (Bottom) Mean ± SEM time course of HFGU-evoked ER content changes in the same ER+ spines as A. P = 0.19. (C, Top) images of ER+ spine volumes treated with AnCoA4 before, during, and after HFGU. (Bottom) Mean ± SEM time course of HFGU-evoked volume changes in untreated versus AnCoA4 treated ER+ spines (N = 4, n = 7). (D, Top) Images of ER content in ER+ spines treated with AnCoA4 in response to HFGU. (Bottom) Mean ± SEM time course of HFGU-evoked ER content changes in the same ER+ spines as C. White circles indicate region of HFGU. (Scalebar, 2 µm).

References

    1. Sala C., Segal M., Dendritic spines: The locus of structural and functional plasticity. Physiol. Rev. 94, 141–188 (2014). - PubMed
    1. Nakahata Y., Yasuda R., Plasticity of spine structure: Local signaling, translation and cytoskeletal reorganization. Front. Synaptic Neurosci. 10, 29 (2018). - PMC - PubMed
    1. Matsuzaki M., Honkura N., Ellis-Davies G. C., Kasai H., Structural basis of long-term potentiation in single dendritic spines. Nature 429, 761–766 (2004). - PMC - PubMed
    1. Nishiyama J., Yasuda R., Biochemical computation for spine structural plasticity. Neuron 87, 63–75 (2015). - PMC - PubMed
    1. Stein I. S., Gray J. A., Zito K., Non-ionotropic NMDA receptor signaling drives activity-induced dendritic spine shrinkage. J. Neurosci. 35, 12303–12308 (2015). - PMC - PubMed

MeSH terms

LinkOut - more resources