. 2024 Aug 23;10(34):eadi0302.
doi: 10.1126/sciadv.adi0302. Epub 2024 Aug 23.

Sexually dimorphic computational histopathological signatures prognostic of overall survival in high-grade gliomas via deep learning

Affiliations

Sexually dimorphic computational histopathological signatures prognostic of overall survival in high-grade gliomas via deep learning

Ruchika Verma et al. Sci Adv. .

Abstract

High-grade glioma (HGG) is an aggressive brain tumor. Sex is an important factor that differentially affects survival outcomes in HGG. We used an end-to-end deep learning approach on hematoxylin and eosin (H&E) scans to (i) identify sex-specific histopathological attributes of the tumor microenvironment (TME), and (ii) create sex-specific risk profiles to prognosticate overall survival. Surgically resected H&E-stained tissue slides were analyzed in a two-stage approach using ResNet18 deep learning models, first, to segment the viable tumor regions and second, to build sex-specific prognostic models for prediction of overall survival. Our mResNet-Cox model yielded C-index (0.696, 0.736, 0.731, and 0.729) for the female cohort and C-index (0.729, 0.738, 0.724, and 0.696) for the male cohort across training and three independent validation cohorts, respectively. End-to-end deep learning approaches using routine H&E-stained slides, trained separately on male and female patients with HGG, may allow for identifying sex-specific histopathological attributes of the TME associated with survival and, ultimately, build patient-centric prognostic risk assessment models.


Figures
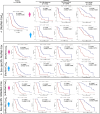
Fig. 1.
Fig. 1.. KM curves that split low- and high-risk groups across the training and three validation cohorts (TS1-TS3).
For each plot, x axis represents the OS in days, y axis represents the estimated survival probability, and the P value is obtained from the log-rank test. The number of female/male studies used for training and three validation cohorts is provided on the top of the figure. In (A) to (C), top row represents KM curves for female-specific validation cohorts, while bottom row represents KM curves for male-specific validation cohorts. (A) (ResNet-Cox)all, when validated on three hold-out cohorts in a sex-specific manner, did not yield significant differences (P > 0.05) across the low- and high-risk groups across all validation cohorts. (B) KM curves for the sex-specific ResNet-Cox models. C-indices for training and three validation cohorts were (0.673, 0.714, 0.724, and 0.712) and P value (<0.0001, 0.0004, 0.0002, and <0.0001), respectively using (ResNet-Cox)F, while P < 0.0001 and C-index (0.712, 0.709, 0.698, and 0.651) were obtained for (ResNet-Cox)M cohort, respectively. (C) KM curves of the mResNet-Cox model; concordance index for training and three validation cohorts were found to be C-index (0.696, 0.736, 0.731, and 0.729) and P = (<0.0001, <0.0001, 0.0002, and <0.0001) using (mResNet-Cox)F cohort, while P < 0.0001 and C-index (0.729, 0.738, 0.724, and 0.696) for (mResNet-Cox)M, cohort respectively.
Fig. 2.
Fig. 2.. t-SNE and UMAP visualization of sex-specific survival model features.
t-SNE and UMAP plots illustrating the distribution of 512-dimensional features derived from sex-specific survival models, with consistent patterns of high-risk and low-risk patches in male and female cohorts. Each point on the plots represents a patch (with 0.5-μm magnification per pixel), color coded according to the predicted risk score [in (A), (C), (E), (G)] and tissue acquisition sites [in (B), (D), (F), (H)]. In (B), (D), (F), and (G), green denotes patches from site 1 (TS1), orange represents patches from site 2 (TS2), and purple represents patches from site 3 (TS3). t-SNE and UMAP plots, each comprising two components, were generated using a perplexity of 30 for t-SNE and 25 neighbors for UMAP. In (A), (C), (E), and (G), the risk scores were derived from the sex-specific survival models where the red cluster denotes patches with relatively higher risk scores, while the blue cluster represents lower risk scores. Key examples of representative patches are highlighted in (A) to (F). In males, patches associated with higher risk scores corresponded to (A) microvascular proliferation (MVP) and (B) pseudopalisading cells, while low-risk patches in males were linked to the peritumoral region, often referred to as the leading edge (C). Similarly, in females, patches with high risk scores were related to infiltrating tumors (E) and MVP (F), whereas low-risk patches were associated with stromal regions (D).
Fig. 3.
Fig. 3.. A representative WSI and the associated risk map visualization of each gender.
Risk maps were obtained using sex-specific ResNet-Cox predictions on tumor regions of WSIs (with 0.5-μm magnification per pixel) to identify different histologic patterns. Red indicates relatively higher risk, and blue indicates lower risk. As evident from the top row, female-specific ResNet-Cox model specifically predicts high risks for regions of MVP and infiltrating tumor. Similarly, male-specific ResNet-Cox model predicts high risks for regions of MVP and pseudopalisading cells.
Fig. 4.
Fig. 4.. Boxplots depicting the distribution of histological attributes between low- and high-risk groups in the Ivy GAP cohort (n = 41).
The top row presents boxplots derived from female-specific data (n = 20), while the bottom row showcases boxplots from the male cohort (n = 21). In line with our qualitative observations, we observed significant separations (P < 0.05) in the proportions of infiltrating tumor and pseudopalisading cells between the low- and high-risk groups within the female- and male-specific cohorts, respectively.
Fig. 5.
Fig. 5.. Inclusion and exclusion criteria for patient selection for the training and validation cohorts.
Fig. 6.
Fig. 6.. Overview of our framework.
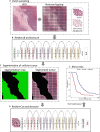
(A) Patch sampling process: Illustration of a WSI (with 0.5-μm magnification per pixel) from where nonoverlapping patches were sampled from the tumor and background/nontumor region. Patches extracted from the tumor region were labeled as 1 while others were labeled as 0. (B) ResNet18 Architecture: The extracted patches and labels were used to train ResNet18 model to classify tumor and nontumor patches. (C) Segmentation of cellular tumor: The trained ResNet18 model was used to identify the tumor region (shown in green) and to create the segmentation maps. (D) ResNet-Cox architecture: The patches from the segmented tumor region were used to train sex-specific ResNet-Cox models. Patient-specific risk scores were obtained using median score across the patches sampled from the tumor region of each patient. (E) Survival analysis using KM curves was investigated in sex-specific cohorts.

References

    1. Stupp R., Mason W. P., van den Bent M. J., Weller M., Fisher B., Taphoorn M. J. B., Belanger K., Brandes A. A., Marosi C., Bogdahn U., Curschmann J., Janzer R. C., Ludwin S. K., Gorlia T., Allgeier A., Lacombe D., Cairncross J. G., Eisenhauer E., Mirimanoff R. O., Radiotherapy plus concomitant and adjuvant temozolomide for glioblastoma. N. Engl. J. Med. 352, 987–996 (2005). - PubMed
    1. Ostrom Q. T., Rubin J. B., Lathia J. D., Berens M. E., Barnholtz-Sloan J. S., Females have the survival advantage in glioblastoma. Neuro Oncol. 20, 576–577 (2018). - PMC - PubMed
    1. A. F. Tamimi, M. Juweid, Epidemiology and Outcome of Glioblastoma, in Glioblastoma, S. De Vleeschouwer, Ed. (Codon Publications, Brisbane (AU), 2017); http://www.ncbi.nlm.nih.gov/books/NBK470003/. - PubMed
    1. Carrano A., Juarez J. J., Incontri D., Ibarra A., Guerrero Cazares H., Sex-specific differences in glioblastoma. Cells 10, 1783 (2021). - PMC - PubMed
    1. Lee J., Kay K., Troike K., Ahluwalia M. S., Lathia J. D., Sex differences in glioblastoma immunotherapy response. Neuromolecular Med. 24, 50–55 (2022). - PubMed

Publication types