. 2024 Aug 23;10(34):eadp2636.
doi: 10.1126/sciadv.adp2636. Epub 2024 Aug 23.

CD4+ and CD8+ T cells are required to prevent SARS-CoV-2 persistence in the nasal compartment

Affiliations

CD4+ and CD8+ T cells are required to prevent SARS-CoV-2 persistence in the nasal compartment

Meenakshi Kar et al. Sci Adv. .

Abstract

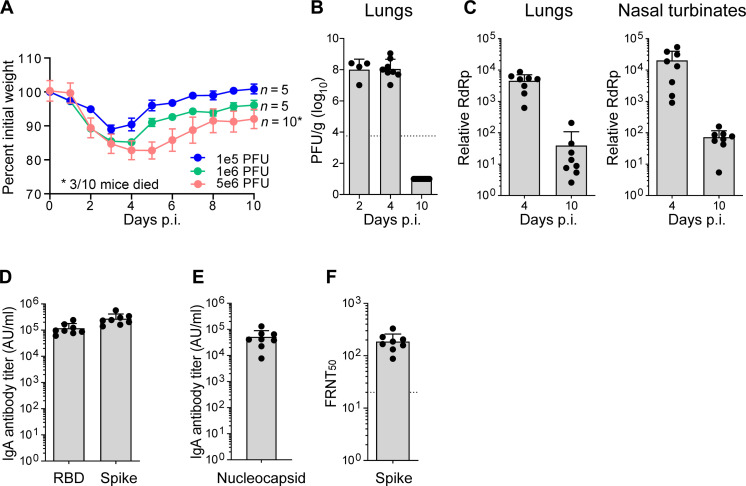
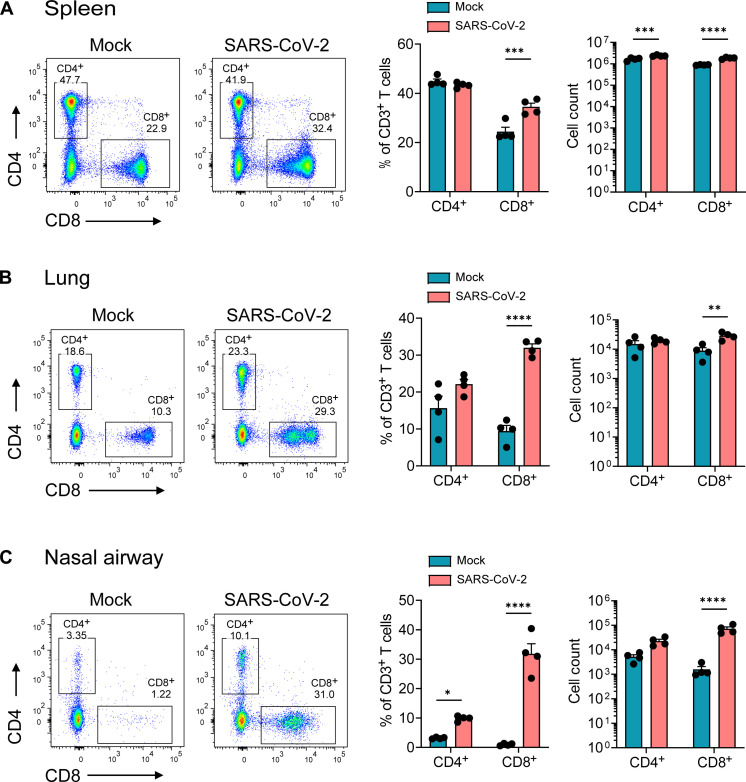
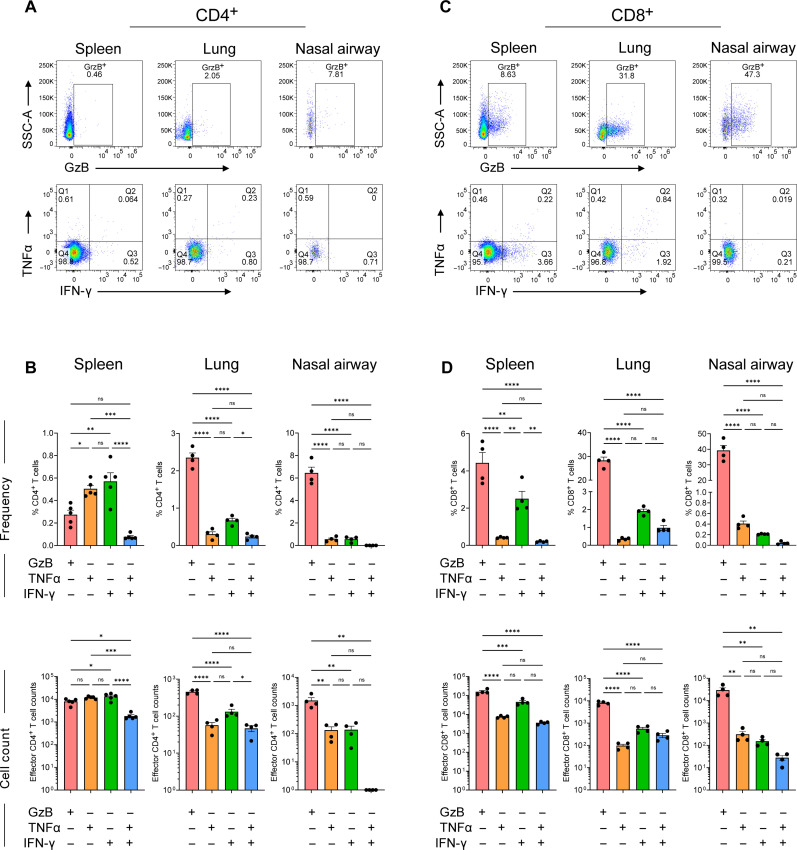
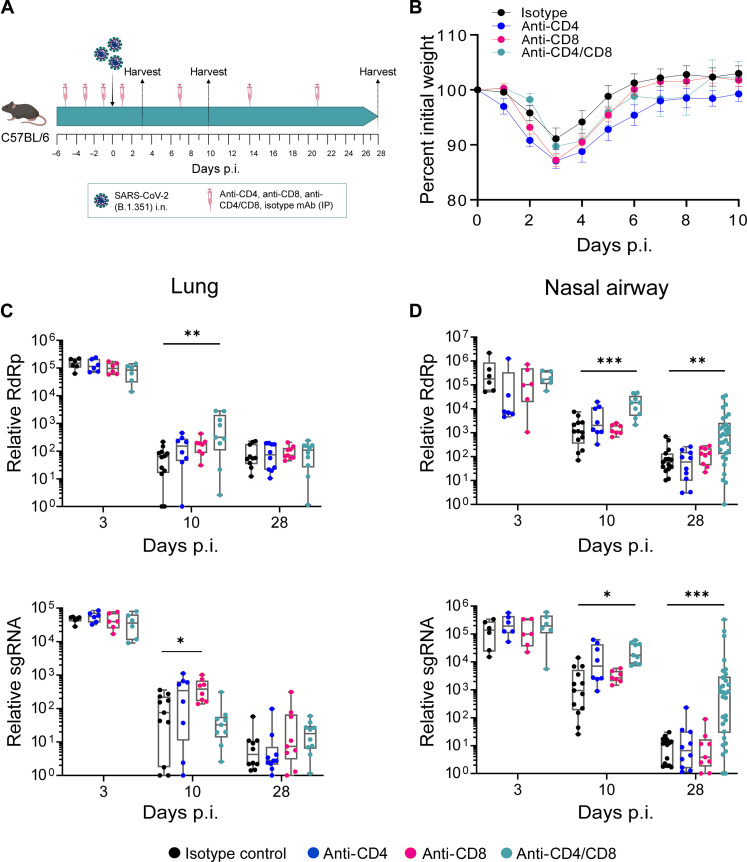
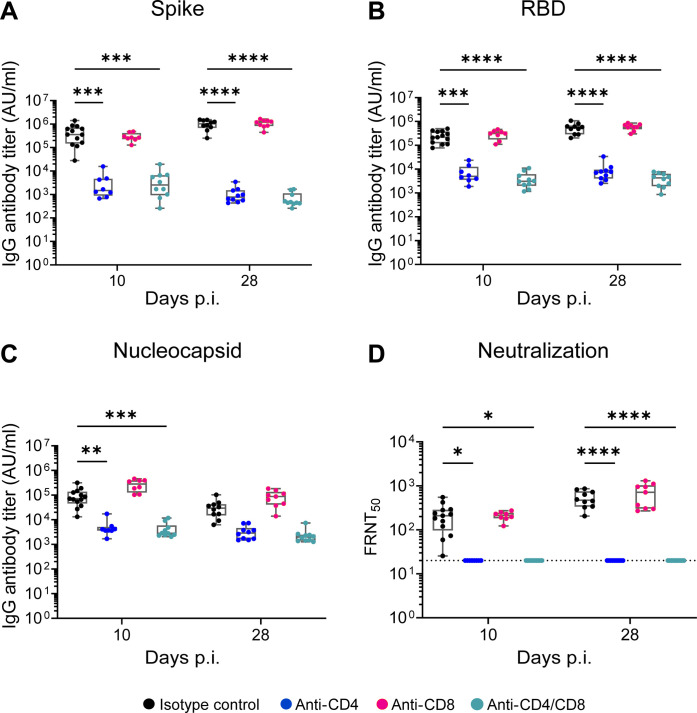
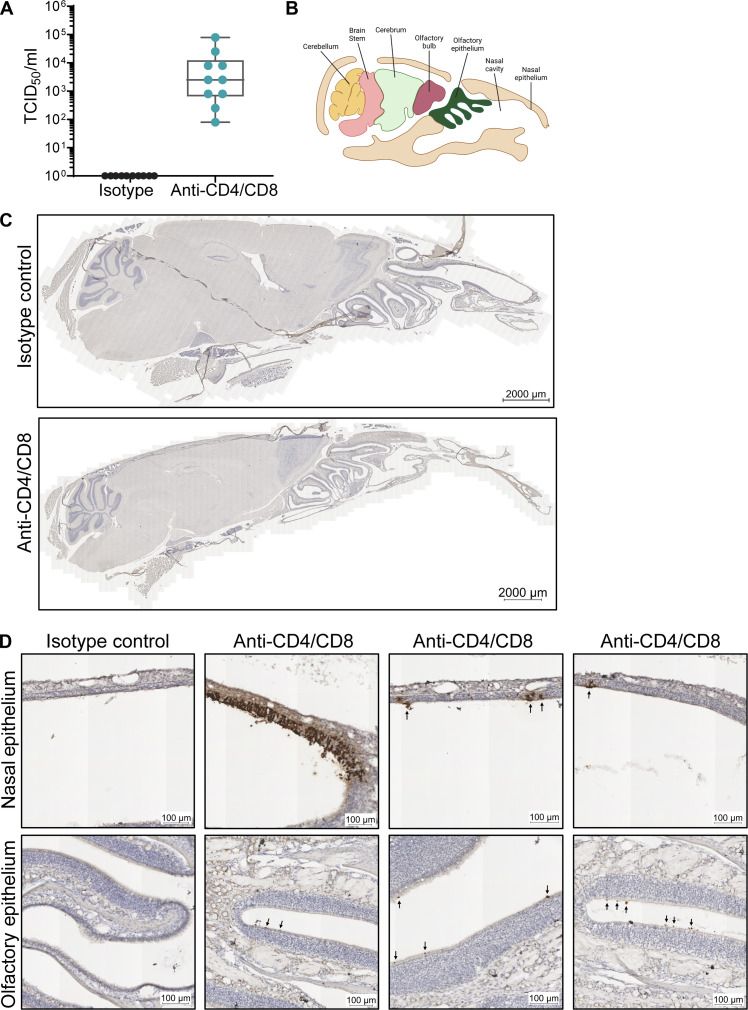
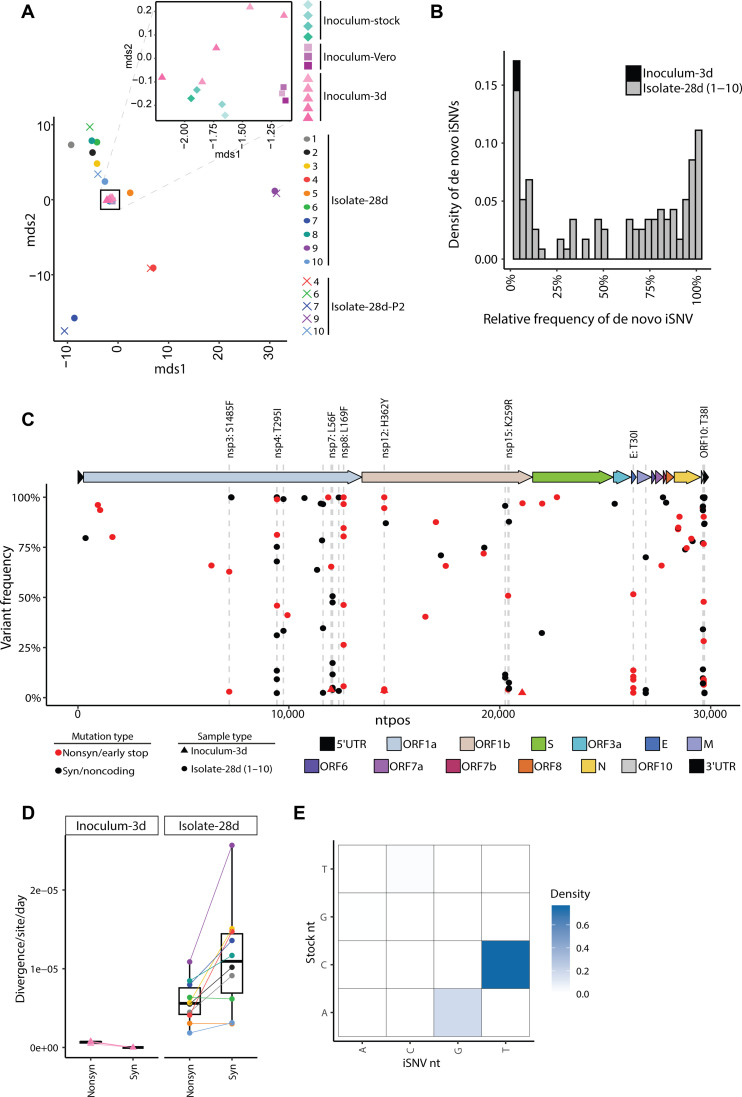
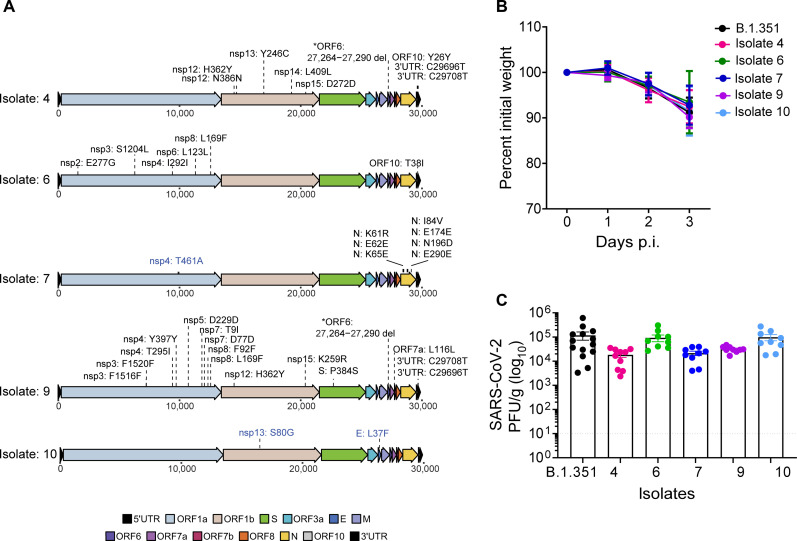
SARS-CoV-2 infection induces the generation of virus-specific CD4+ and CD8+ effector and memory T cells. However, the contribution of T cells in controlling SARS-CoV-2 during infection is not well understood. Following infection of C57BL/6 mice, SARS-CoV-2-specific CD4+ and CD8+ T cells are recruited to the respiratory tract, and a vast proportion secrete the cytotoxic molecule granzyme B. Using depleting antibodies, we found that T cells within the lungs play a minimal role in viral control, and viral clearance occurs in the absence of both CD4+ and CD8+ T cells through 28 days postinfection. In the nasal compartment, depletion of both CD4+ and CD8+ T cells, but not individually, results in persistent, culturable virus replicating in the nasal epithelial layer through 28 days postinfection. Viral sequencing analysis revealed adapted mutations across the SARS-CoV-2 genome, including a large deletion in ORF6. Overall, our findings highlight the importance of T cells in controlling virus replication within the respiratory tract during SARS-CoV-2 infection.


Figures

Fig. 1.
Fig. 1.. SARS-CoV-2 variant B.1.351 replicates in the lungs and nasal airways of C57BL/6 mice.
C57BL/6 mice were infected with the SARS-CoV-2 B.1.351 (Beta) variant or an equal volume of saline for mock mice. (A) Percent of initial weight for Beta infected mice at indicated PFUs over 10 days. (B) Quantification of infectious virus at indicated days p.i. as measured by plaque assay and expressed as PFU per gram of lung tissue. (C) Quantification of viral RNA by qRT-PCR for SARS-CoV-2 RdRp in the lungs (left) and nasal turbinates (right). CT values represented as relative fold change over mock (log10). IgG antibody titers against (D) RBD and spike and (E) nucleocapsid as measured by an electrochemiluminescent multiplex immunoassay and reported as arbitrary units per ml (AU/ml) and normalized by a standard curve for the B.1.351 SARS-CoV-2 variant. (F) Neutralizing antibody response measured as 50% inhibitory titer (FRNT50) by focus reduction neutralization assay. Graphs show mean ± SD. Results are representative of data from two independent experiments. Day 2 p.i. (n = 4), day 4 p.i. (n = 8), and day 10 p.i. (n = 10).
Fig. 2.
Fig. 2.. SARS-CoV-2 B.1.351 infection leads to increased infiltration of CD8+ T cells in the respiratory tract but not in the periphery.
C57BL/6 mice were infected with the SARS-CoV-2 B.1.351 (Beta) variant at 106 PFU intranasally, and at day 7 pi, spleen, lungs, and nasal airway tissues were harvested, processed for flow cytometry, and analyzed via FlowJo. Frequency and cell count for CD4+ and CD8+ T cells in (A) spleen, (B) lungs, and (C) nasal airway; representative flow plots on the left, frequency of cells in the middle, and cell counts on the right. Graphs show mean ± SD. A two-way analysis of variance (ANOVA) statistical test was performed. *P < 0.05, **P < 0.01, ***P < 0.001, and ****P < 0.0001; no symbol, not significant. Results are representative of data from three independent experiments with five mice per group.
Fig. 3.
Fig. 3.. SARS-CoV-2 B.1.351 infection triggers antigen-specific effector T cell responses in the upper and lower respiratory tract.
C57BL/6 mice were infected with the SARS-CoV-2 B.1.351 (Beta) variant at 106 PFU intranasally, and at day 7 pi, virus-specific CD4+ and CD8+ T cell responses were evaluated by ex vivo peptide stimulation using spike peptide pools in spleen, lungs, and nasal airways. (A) Representative flow plots for GzB (top), TNFα, and IFN-γ (bottom) expression in CD4+ T cells in spleen, lungs, and nasal airways. (B) Frequency (top) and cell counts (bottom) of CD4+ T cells positive for GzB, TNFα, and IFN-γ expression in spleen, lungs, and nasal airways. (C) Representative flow plots for GzB (top), TNFα, and IFN-γ (bottom) expression in CD8+ T cells in spleen, lungs, and nasal airways. (D) Frequency (top) and cell counts (bottom) of CD4+ T cells positive for GzB, TNFα, and IFN-γ expression in spleen, lungs, and nasal airways. Graphs show mean ± SD. A two-way ANOVA statistical test was performed. *P < 0.05, **P < 0.01, ***P < 0.001, and ****P < 0.0001; no symbol, not significant (ns). Results are representative of data from three independent experiments with five mice per group.
Fig. 4.
Fig. 4.. CD4+ and CD8+ T cells are dispensable for protection against SARS-CoV-2 in the lungs but required for viral control within the upper respiratory tract.
(A) Study design: C57BL/6 mice were depleted of either CD4+ or CD8+ or both T cells using 200 μg of anti-mouse CD4 or anti-mouse CD8α or both respectively via intraperitoneal (IP) route at day −5, −3, −1, 1, 7, 14, and 21 p.i. (B) Percent initial weight in SARS-CoV-2 (B.1.351) infected mice through 10 days p.i. Viral RNA levels as measured by relative RdRp levels (top) and subgenomic RNA (sgRNA) levels (bottom) at indicated time points in (C) lungs (D) nasal airways. Graphs show mean ± SEM. Kruskal-Wallis statistical test was performed comparing all depletion groups with the isotype control. *P < 0.05, **P < 0.01, and ***P < 0.001; no symbol, not significant. Data are an aggregate of two independent experiments with group sizes between 6 and 30 mice. i.n., intranasal administration.
Fig. 5.
Fig. 5.. SARS-CoV-2 antibody responses are CD4+ T cell–dependent but not required for viral control in the respiratory tract.
C57BL/6 mice were depleted of either CD4+ or CD8+ or both T cells, and at indicated days p.i., binding and neutralizing antibody response against SARS-CoV-2 B.1.351 spike, RBD, and nucleocapsid were measured by electrochemiluminescent multiplex immunoassay and reported as arbitrary units per ml (AU/ml) against SARS-CoV-2. IgG antibody responses were measured against (A) Spike, (B) RBD, and (C) Nucleocapsid. (D) The 50% inhibitory titer (FRNT50) on the FRNT was measured at day 10 p.i. and day 28 p.i. The dotted line in the FRNT assay represents the maximum concentrations of the serum tested (1/20). A two-way ANOVA statistical test was performed. *P < 0.05, **P < 0.01, ***P < 0.001, and ****P < 0.0001; no symbol, not significant.
Fig. 6.
Fig. 6.. SARS-CoV-2 persists predominantly within the nasal epithelium in the absence of CD4+ and CD8+ T cells.
C57BL/6 mice were depleted of both CD4+ or CD8+ and assessed for localization of viral antigen in mouse heads at 28 days p.i. (A) Tissue culture infectious dose (TCID50) per milliliter of nasal turbinate suspension assessed in mice where both CD4+ and CD8+ T cells were depleted. (B) Representation of the sagittal section of a mouse skull showing various parts of the nasal cavity and brain (created with BioRender.com). (C) Representative images of ISH for RNA Spike antigen performed on heads of mice where both CD4+ and CD8+ T cells were depleted and compared to isotype control mice. (D) Representative images of nasal epithelium (top) and olfactory epithelium (bottom) of ISH for RNA Spike antigen. Arrows represent anti-spike RNA (dark brown). Representative images from 3 of 10 T cell–depleted mice.
Fig. 7.
Fig. 7.. Intrahost SARS-CoV-2 variants emerge during infection in tandem CD4+/CD8+ T cell–depleted mice.
(A) MDS plot of the pairwise genetic distance (L1-norm) calculations across all samples in the dataset. The inset zooms in on the black box to show the positions of the inoculum samples. Point color and shape represent the sample and collection type. For the inoculum-stock, the color gradient represents different aliquots of the stock. For inoculum-Vero and inoculum-3d, the color gradients represent different infections. (B) The frequency distribution of de novo variants identified in the inoculum-3d (black) and isolate-28d (1 to 10, gray) samples. (C) The location, frequency, and characteristics of de novo variants in the inoculum-3d (triangle) and isolate-28d (1 to 10, circle) samples. The color of each point represents the type of mutation including mutations that are synonymous/in noncoding regions (black) or nonsynonymous/stop codon mutations (red). Point shape indicates the type of sample collection. Dashed lines highlight the genomic positions where a de novo mutation was found in more than one mouse isolate-28d sample. Labels are added for the nonsynonymous substitutions only. The colors on the genome map represent the different gene regions. 5′UTR, 5′ untranslated region; ORF, open reading frame; S, spike; E, envelope; M, membrane; N, nucleocapsid; nsp, nonstructural protein. (D) The nonsynonymous and synonymous divergence rates normalized by the expected number of sites in the coding sequence for the inoculum-3d samples and T cell–depleted mouse isolate-28d samples. Point color and shape represent the sample and collection type as outlined in Fig. 7A. (E) The density of transitions and transversions for all de novo mutations (2 to 100%). nt, nucleotide.
Fig. 8.
Fig. 8.. De novo mutations lead to differences in virus replication.
(A) Mutation maps of de novo SARS-CoV-2 consensus mutations (≥50%) in the mouse isolates 4, 6, 7, 9, and 10 and compared to the isolate-Vero samples. Blue labels represent mutations that reached ≥50% in the isolate-Vero sample but were present at <50% in the original mouse isolate. Labels represent amino acid information for mutations in coding regions and nucleotide information for deletions or mutations in the noncoding regions of the genome. The colors on the genome map represent the different gene regions. (B) C57BL/6 mice were infected with mice isolates-P2 as indicated, and weight loss was measured over 3 days. The graph represents the percent initial weight compared to the initial weight on the day of infection. (C) Infectious virus from lungs of mice infected with indicated isolates at day 3 p.i. was quantified by plaque assay in VeroE6-ACE2-TMPRSS2 overexpressing cells and expressed as PFU per gram of lung tissue.

Update of

References

    1. Ahn J. H., Kim J., Hong S. P., Choi S. Y., Yang M. J., Ju Y. S., Kim Y. T., Kim H. M., Rahman M. D. T., Chung M. K., Hong S. D., Bae H., Lee C. S., Koh G. Y., Nasal ciliated cells are primary targets for SARS-CoV-2 replication in the early stage of COVID-19. J. Clin. Invest. 131, e148517 (2021). - PMC - PubMed
    1. Jayaweera M., Perera H., Gunawardana B., Manatunge J., Transmission of COVID-19 virus by droplets and aerosols: A critical review on the unresolved dichotomy. Environ. Res. 188, 109819 (2020). - PMC - PubMed
    1. Lamers M. M., Haagmans B. L., SARS-CoV-2 pathogenesis. Nat. Rev. Microbiol. 20, 270–284 (2022). - PubMed
    1. Jackson C. B., Farzan M., Chen B., Choe H., Mechanisms of SARS-CoV-2 entry into cells. Nat. Rev. Mol. Cell Biol. 23, 3–20 (2022). - PMC - PubMed
    1. Fraser R., Orta-Resendiz A., Mazein A., Dockrell D. H., Upper respiratory tract mucosal immunity for SARS-CoV-2 vaccines. Trends Mol. Med. 29, 255–267 (2023). - PMC - PubMed

MeSH terms