. 2024 Aug 23;20(8):e1012495.
doi: 10.1371/journal.ppat.1012495. eCollection 2024 Aug.

Fitness factor genes conserved within the multi-species core genome of Gram-negative Enterobacterales species contribute to bacteremia pathogenesis

Affiliations

Fitness factor genes conserved within the multi-species core genome of Gram-negative Enterobacterales species contribute to bacteremia pathogenesis

Harry L T Mobley et al. PLoS Pathog. .

Abstract

There is a critical gap in knowledge about how Gram-negative bacterial pathogens, using survival strategies developed for other niches, cause lethal bacteremia. Facultative anaerobic species of the Enterobacterales order are the most common cause of Gram-negative bacteremia, including Escherichia coli, Klebsiella pneumoniae, Serratia marcescens, Citrobacter freundii, and Enterobacter hormaechei. Bacteremia often leads to sepsis, a life-threatening organ dysfunction resulting from unregulated immune responses to infection. Despite a lack of specialization for this host environment, Gram-negative pathogens cause nearly half of bacteremia cases annually. Based on our existing Tn-Seq fitness factor data from a murine model of bacteremia combined with comparative genomics of the five Enterobacterales species above, we prioritized 18 conserved fitness genes or operons for further characterization. Mutants were constructed for all genes in all five species. Each mutant was used to cochallenge C57BL/6 mice via tail vein injection along with each respective wild-type strain to determine competitive indices for each fitness gene. Five fitness factor genes, when mutated, attenuated mutants in four or five species in the spleen and liver (tatC, ruvA, gmhB, wzxE, arcA). Five additional fitness factor genes or operons were validated as outcompeted by wild-type in three, four, or five bacterial species in the spleen (xerC, prc, apaGH, atpG, aroC). Overall, 17 of 18 fitness factor mutants were attenuated in at least one species in the spleen or liver. Together, these findings allow for the development of a model of bacteremia pathogenesis that may include future targets of therapy against bloodstream infections.


Conflict of interest statement

The authors have declared that no competing interests exist.

Figures

Fig 1
Fig 1. Prioritized multi-species bacteremia fitness genes.
Colored arrows represent fitness genes that were targeted for mutagenesis via recombineering. The genetic organization of E. coli CFT073 is shown for reference, but corresponding mutations were generated in each of the five species of interest. ORF length are not to scale.
Fig 2
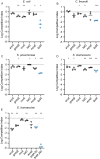
Fig 2. Competitive Indices of competition of mutants and respective wild type strains co-cultured in lysogeny broth.
Stationary phase cultures of selected mutants and their respective wild type strains were normalized to OD600 = 1.0 in PBS, pH7.2, and mixed 1:1, then diluted 1:100 into 2 ml of lysogeny broth and cultured for 24 h at 37°C with aeration. Co-cultures were serially diluted and differentially plated on Luria agar with and without antibiotic selection and CFUs were quantified. Data are expressed as competitive indices as defined in footnote “a” of Table 3. Each data point represents an independent competition experiment. Significance was determined by a one-sample t-test performed on log10-transformed competitive indices (*, p < .05; **, p < .01; ***, p < .001). Blue circles indicate lpdA control competition experiments after 24 h with the exception of E. hormaechei which was also determined at 5 h.
Fig 3
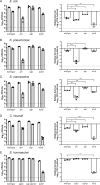
Fig 3. Susceptibility of Enterobacterales species to human serum.
1x10⁷ CFU/mL of bacteria (A-E: named species and strain) were incubated with normal human serum and heat-inactivated human serum to indicate complement-specific killing for 90 minutes at 37°C. 90% pooled human serum was used for K. pneumoniae KPPR1 and 40% pooled human serum for C. freundii UMH14, E. coli CT073, S. marcescens UMH9, and E. hormaechei UM_CRE_14. (Left panels) Individual CFUs with mean +/- SEM (n = 3) were plotted at t = 0 (white) and t = 90 in heat-inactivated human serum (light gray) and normal human serum (dark gray). (Right panels) Viability was calculated relative to t = 0 with statistical differences in susceptibility to heat-inactivated human serum or normal human serum determined using an unpaired t-test (*p<0.05, **p<0.01, ***p<0.001, ****p<0.0001). Dashed line denotes limit of detection. Data are presented as the mean ± SEM and are representative of 3 independent experiments each with 3 biological replicates.
Fig 4
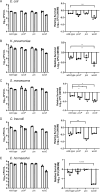
Fig 4. Susceptibility of Enterobacterales species to Polymyxin B.
1x10⁷ CFU/mL of bacteria (A-E: named species and strain) were incubated with Polymyxin B in PBS for 45 minutes at 37°C. (Left panels) Individual CFUs with mean +/- SEM (n = 3) were plotted at t = 0 (white) and t = 45 (gray). (Right panels) Viability was calculated relative to t = 0 with statistical differences in sensitivity to Polymyxin B determined using an unpaired t-test (*p<0.05, **p<0.01, ***p<0.001, ****p<0.0001). Polymyxin B concentrations used are as follows: 1 μg/mL for E. coli CFT073; 2.5 μg/mL for C. freundii UMH14; 5 μg/mL for K. pneumoniae Kppr1; 10 μg/mL for S. marcescens UMH9 and 1 μg/mL for E. hormaechei UM_CRE_14. sap operon indicates sapBCADTEF mutant. arn indicates arnABCDF mutant. Dashed line denotes Limit of Detection. Data are presented as the mean ± SEM and are representative of 3 independent experiments each with 3 biological replicates. Statistical significance was assessed by the t-test.
Fig 5
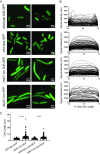
Fig 5. Demonstration of Tat pathway secretion in S. marcescens.
A. S. marcescens wild-type and tatC mutant bacteria harboring plasmids that encoded an unmodified GFP (GFP) or an engineered fusion of the SufI N-terminal twin-arginine signal peptide with GFP (SufI-GFP) were visualized by fluorescence microscopy. Fluorescence intensity as a function of cell length (B) and total cell length (C) were determined for bacteria (n≥100) from multiple fields using Image J. Statistical significance for panel C was assessed by unpaired t-test: ****, p<0.0001.
Fig 6
Fig 6. Small colony phenotype of arcA mutants.
Wild-type and arcA mutants were cultured overnight in LB with aeration at 37°C. Ten-fold dilutions were spread plated onto Luria agar and incubated overnight at 37°C. Colony diameters were measured using ImageJ software (http://imagej.nih.gov/ij). #For all five species, arcA mutants had statistically significantly smaller colony diameters than wild-type strains as determined using an unpaired t-test. #(p < .0001). The small colony phenotype has been observed previously in arcA mutants [33,34].
Fig 7
Fig 7. Siderophore production.
(A) Siderophore production was detected on chrome azurol S (CAS) plates supplemented with 1% tryptone. A sample (2 μl) of overnight stationary phase LB medium cultures was spotted in triplicate onto CAS agar plates and incubated at 37°C for 16 h. (B) Siderophore activity was measured from the linear distance from the edge of the colony to the edge of the chelation halo at positions 12, 3, 6 and 9 o’clock (4 measurements/colony) using ImageJ software. Statistical significance is based on an unpaired two-tailed t-test (*p<0.05, ***p<0.005).
Fig 8
Fig 8. Susceptibility of Enterobacterales species to osmotic stress.
1x10⁷ CFU/mL of bacteria (A-E: named species and strain) were incubated with 0M or 2M D-sorbitol in PBS to induce osmotic stress for 30 minutes. (Left panels) Individual CFUs with mean +/- SEM (n = 3) were plotted after 30-minute incubation in 0M (white) and 2M (gray) sorbitol. (Right panels) Bacterial viability was calculated relative to 0M sorbitol. Data are presented as the mean ± SEM and are representative of 3 independent experiments each with 3 biological replicates. Statistical significance was assessed by an unpaired t-test.
Fig 9
Fig 9. Envelope stress after exposure to bile salts.
Bacterial cultures were incubated at 37°C overnight in LB, diluted in PBS to a final concentration of 104 CFU/mL. Bacterial suspensions were spread-plated onto MacConkey agar (Mac) and LB agar (LB) in triplicate and incubated overnight at 27°C Colonies were counted after 48 hours of incubation. Data are presented as the ratio of the number of CFU on MacConkey agar to the number of CFU on LB agar [79]. Significance was determined by paired ANOVA Dunnett’s multiple comparisons test.
Fig 10
Fig 10. Alkaline phosphatase activity of phosphate transport mutants.
Suspensions of wild-type strains normalized to OD600 = 0.1 (circle) E. coli CFT073, K. pneumoniae Kppr1, S. marcescens UMH9, C. freundii UMH14, E. hormaechei UM_CRE_14 and their respective pstSCABphoU mutants (square) were incubated with p-nitrophenylphosphate at 37°C for one hour. Hydrolysis of substrate was followed OD405 as a measure of alkaline phosphatase activity. Statistical differences were measured with an unpaired t-test and (**p<0.01, ***p<0.001, ****I<0.0001).
Fig 11
Fig 11. Model of Bacterial Pathogenesis of Bacteremia by Gram-negative Bacteremia.
Seven common pathways are depicted that contribute to pathogenesis of bacteremia by five bacterial species within the Enterobacterales. Genes shared within the multi-species core genome of five bacterial species including E. coli, K. pneumoniae, S. marcescens, C. freundii, and E. hormaechei, were predicted as common fitness genes using Tn-Seq screens in a murine model of bacteremia. Prioritized mutants were constructed in 18 conserved genes or operons in all 5 species. Mice were cochallenged with each mutant and its respective wild-type strain by tail vein injection of mice. Genes that were validated in from 1–5 species as attenuated as measured by competitive indices are included in the model. Created with BioRender.com.

References

    1. Commission TJ. Sepsis 2022. [Available from: https://www.jointcommission.org/resources/patient-safety-topics/infectio....
    1. Holmes CL, Albin OR, Mobley HLT, Bachman MA. Bloodstream Infections: Mechanisms of Pathogenesis and Opportunities for Intervention. Nature Reviews Microbiology. 2024;in press.
    1. Collaborators GBDAR. Global mortality associated with 33 bacterial pathogens in 2019: a systematic analysis for the Global Burden of Disease Study 2019. Lancet. 2022;400(10369):2221–48. doi: 10.1016/S0140-6736(22)02185-7 - DOI - PMC - PubMed
    1. Diekema DJ, Hsueh PR, Mendes RE, Pfaller MA, Rolston KV, Sader HS, et al.. The Microbiology of Bloodstream Infection: 20-Year Trends from the SENTRY Antimicrobial Surveillance Program. Antimicrob Agents Chemother. 2019;63(7). doi: 10.1128/AAC.00355-19 - DOI - PMC - PubMed
    1. Antimicrobial Resistance C. Global burden of bacterial antimicrobial resistance in 2019: a systematic analysis. Lancet. 2022;399(10325):629–55. doi: 10.1016/S0140-6736(21)02724-0 - DOI - PMC - PubMed

Substances

LinkOut - more resources