. 2024 Oct:76:103320.
doi: 10.1016/j.redox.2024.103320. Epub 2024 Aug 20.

Dopamine-modified hyaluronic acid (DA-HA) as a novel dopamine-mimetics with minimal autoxidation and cytotoxicity

Affiliations

Dopamine-modified hyaluronic acid (DA-HA) as a novel dopamine-mimetics with minimal autoxidation and cytotoxicity

Sunpil Kim et al. Redox Biol. 2024 Oct.

Erratum in

Abstract

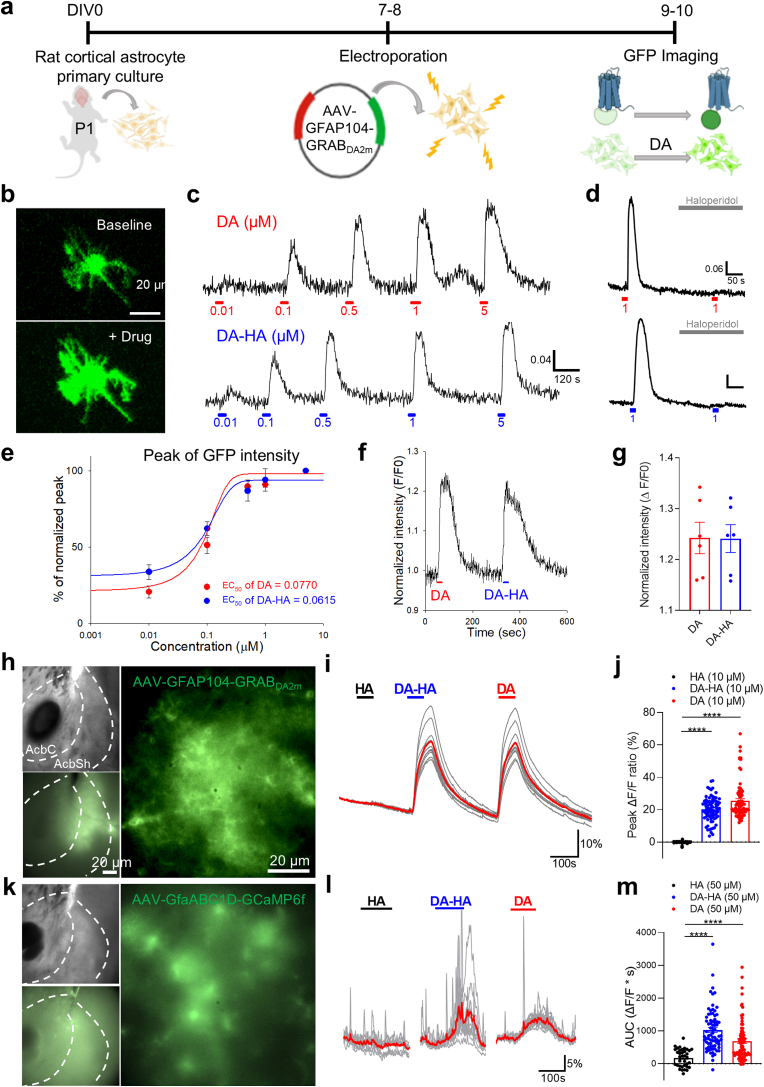
Dopamine-modified hyaluronic acid (DA-HA) has been initially developed as an efficient coating and adhesion material for industrial uses. However, the biological activity and safety of DA-HA in the brain have not been explored yet. Here, we report a series of evidence that DA-HA exhibits similar functionality as dopamine (DA), but with much lower toxicity arising from autoxidation. DA-HA shows very little autoxidation even after 48-h incubation. This is profoundly different from DA and its derivatives including l-DOPA, which all induce severe neuronal death after pre-autoxidation, indicating that autoxidation is the cause of neuronal death. Furthermore, in vivo injection of DA-HA induces significantly lower toxicity compared to 6-OHDA, a well-known oxidized and toxic form of DA, and alleviates the apomorphine-induced rotational behavior in the 6-OHDA animal model of Parkinson's disease. Our study proposes that DA-HA with DA-like functionalities and minimal toxicity has a great potential to treat DA-related disease.

Keywords: And a 6-OHDA-Induced mouse model of Parkinson's disease; Autoxidation; DA-Induced cytotoxicity; Dopamine (DA); Dopamine-modified hyaluronic acid (DA-HA).


Conflict of interest statement

Declaration of competing interest A patent was filed (KR 10-2022-0058461/2023.05.11) by the Institute for Basic Science (IBS) and Korea Institute of Toxicology (KIT).

Figures

Fig. 1
Fig. 1
Process of DA-HA synthesis and oxidation processes and polymerization of DA and its derivatives. a A schematic diagram of the process of DA-HA synthesis. b-d Oxidation processes and polymerization of DA (b), l-DOPA (c), and 6-OHDA (d).
Fig. 2
Fig. 2
Functional characterization of DA-HA and DA by GRABDA2mDA sensor and GCaMP6f Ca2+sensor. a A schematic diagram for an experimental schedule of GFP imaging in AAV-GFAP104-GRABDA2m transfected astrocyte. b Intensity of GRABDA2m before (top) and after (bottom) treatment of DA. Scale bar: 20 μm. c Representative traces of GFP transients with a dose of 0.01, 0.1, 0.5, 1, and 5 μM of DA (top) and DA-HA (bottom) from a primary cultured astrocyte. d Representative traces of GFP trancients with 1 μM of DA and DA-HA under treatment of 100 nM haloperidol (D2 receptor inhibitor). e Dose-dependent curves for the normalized peak of GFP transients and EC50 of DA (red, n = 3) and DA-HA (blue, n = 4). f Normalized GRABDA2m transients of 1 μM DA and 1 μM DA-HA in the same astrocyte. g Summary bar graph for normalized peak amplitude from f (n = 6 for each condition). h Expression of AAV-GFAP104-GRABDA2m virus in NAc. Dotted lines indicate accumbens core (AcbC, Inside) and accumbens shell (AcbSh). Scale bar: 200 μm and 50 μm. i Representative traces of GRABDA2m under treatment of 10 μM HA, 10 μM DA-HA and 10 μM DA. Red trace indicates averaged trace. j Summary bar graph of peak amplitude of GRABDA2m transients from i (n = 79 ROIs for each condition). k Expression of AAV-GfaABC1D-GCaMP6f virus in NAc. l Representative traces of Ca2+ transients under treatment of 50 μM HA, 50 μM DA-HA, and 50 μM DA. Red traces indicate averaged trace. m Summary bar graph of the area under curve (AUC) analysis of Ca2+ transients from l (n = 36, 75, and 75 ROIs). One-way ANOVA followed by Tukey's multiple comparisons test for i and l. ****p < 0.0001. (For interpretation of the references to color in this figure legend, the reader is referred to the Web version of this article.)
Fig. 3
Fig. 3
Conjugation of DA and HA is critical for safety. a A schematic diagram for an experimental schedule of cell toxicity test with cultured cortical neurons. b Representative immunostaining images of cultured neurons (NeuN, green) with various concentration of vehicle, DA, HA, DA + HA, and DA-HA for 7 days. c Summary bar graph of NeuN + cell density (the number of NeuN + cells in 0.1 mm2) under treatment of vehicle, DA, HA, DA + HA, and DA-HA from 1 to 100 μM (n = 18, 9, 9, 9, 19, 18, 19, 19, 19, 19, 9, 9, and 9). All comparisons were made with the vehicle group. One-way ANOVA followed by Sidak's multiple comparisons test for c. **p < 0.01, ****p < 0.0001. (For interpretation of the references to color in this figure legend, the reader is referred to the Web version of this article.)
Fig. 4
Fig. 4
Long-term stability and safety of DA-HA on cultured neurons. a-c Representative images of NeuN (green), MAP2 (red), and DAPI (blue) of cultured neurons with no treatment (a), 10 μM DA (b), and 10 μM DA-HA (c) for 14 days. Scale bar: 50 μm. Insets of lower pictures indicate NeuN + cells. d Time-dependent changes of survived neurons under treatment of DA and DA-HA for 14 days (n = 6 for each condition). e Summary bar graph of the percentage of survived neurons at day 14 from d (n = 6 for each condition). f Summary bar graph of the number of NeuN (n = 6 for each condition). g-h Bright-field images (g) and representative sEPSC traces (h) of cultured neurons under the treatment of vehicle (control, left), 10 μM DA (middle), and 10 μM DA-HA (right) at day 14. i Superimposed traces of averaged sEPSC with no treatment (black), DA (red), and DA-HA (blue). j Summary bar graph of sEPSC frequency (n = 7, 9, and 11 for j-m). k Summary bar graph of sEPSC amplitude. l Summary bar graph of the rise time of sEPSC. m Summary bar graph of the decay time of sEPSC. One-way ANOVA followed by Tukey's multiple comparison test for e, f, j, k, and m. *p < 0.05, ***p < 0.001, ****p < 0.0001. (For interpretation of the references to color in this figure legend, the reader is referred to the Web version of this article.)
Fig. 5
Fig. 5
DA-HA shows virtually no toxicity, which is highly correlated with a low level of autoxidation. a Representative photographs for color change of neurobasal medium in the presence of 0, 1, 5, 10, 50, and 100 μM of DA, DA + HA, and DA-HA for 24 h b Summary bar graph of autoxidation in the presence of DA, DA + HA, and DA-HA for 24 h (n = 3 for DA and DA-HA; n = 4 for DA + HA). c Summary bar graph of autoxidation in the presence of DA, DA + HA, and DA-HA for 72 h (n = 3 for DA and DA-HA; n = 4 for DA + HA). d An experimental schedule for measuring autoxidation and cell viability of DIV 14 cortical cultured neurons with everyday supplementation of 1, 10, 50, and 100 μM DA, DA + HA, and DA-HA for 7 days. e Bright-field images of control, DA, DA + HA, and DA-HA treated neurons. Scale bar: 50 μm. f-h Summary bar graph of oxidation level in the presence of DA (f, n = 24, 24, 24, 15, and 24), DA + HA (g, n = 12 for each condition), DA-HA (h, n = 18, 24, 23, 12, and 22). i Summary bar graph of oxidation level comparing control, 100 μM of DA, DA + HA, and DA-HA (n = 42, 24, 12 and 22). j-l Summary bar graph of cell viability in the presence of DA (j, n = 24, 24, 24, 15, and 23), DA + HA (k, n = 12 for each condition), and DA-HA (l, n = 18, 24, 23, 12, and 22) m Summary bar graph of cell viability comparing control, 100 μM of DA, DA + HA, and DA-HA (n = 42, 23, 12 and 22). n-p Summary bar graph of the ratio of cell viability/autoxidation in the presence of DA (n, n = 24, 24, 24, 15, and 23), DA + HA (o, n = 12 for each condition), and DA-HA (p, n = 18, 24, 23, 12, and 22). q Summary bar graph of safety (ratio of cell viability/autoxidation) comparing control, 100 μM of DA, DA + HA, and DA-HA (n = 42, 23, 12 and 22). Two-way ANOVA test for b and c. One-way ANOVA followed by dunnett's test for f-q. *p < 0.05, **p < 0.01, ***p < 0.001, ****p < 0.0001. (For interpretation of the references to color in this figure legend, the reader is referred to the Web version of this article.)
Fig. 6
Fig. 6
Minimal extracellular autoxidation is the key molecular factor for safety and stability. a Representative photographs of color change of neurobasal medium treated with 200 μM DA, l-DOPA, 6-OHDA, and DA-HA at 0, 24, 48, and 72 h b Summary for autoxidation level of 200 μM DA, l-DOPA, 6-OHDA, and DA-HA at 0, 24, 48 and 72 h (n = 6 for each condition). c Summary bar graph of autoxidation at 0 h (n = 6 for each condition). d Summary bar graph of autoxidation at 72 h (n = 6 for each condition). e Experimental schedule for cell viability and oxidation level with no autoxidation. f Summary bar graph of cell viability with no autoxidation (n = 4 for each condition). g Summary bar graph of oxidation level with and without neuronal cells with no autoxidation condition (n = 6 and 3). h Experimental schedule for cell viability and oxidation level with 48 h autoxidation. i Summary bar graph of cell viability with autoxidation of 200 μM DA, l-DOPA, 6-OHDA, and DA-HA for 48 h (n = 4 for each condition). j Summary bar graph of autoxidation level with and without neuronal cells with 48 h autoxidation condition (n = 6 and 4). k The relationship between cell viability and autoxidation from e-j. One-way ANOVA followed by Dunnett's multiple comparisons test for c, f, and i. One-way ANOVA followed by Tukey's multiple comparison test for d. Unpaired t-test for g and j. *p < 0.05, **p < 0.01, ***p < 0.001, ****p < 0.0001. (For interpretation of the references to color in this figure legend, the reader is referred to the Web version of this article.)
Fig. 7
Fig. 7
DA-HA does not induce dopaminergic neuronal death in vivo. a A schematic diagram of drug injection into SNpc. b Representative fluorescent images of TH staining in the striatum with the injection of saline, 5 mM HA, 5 mM DA-HA, 5 mM 6-OHDA, and 50 mM 6-OHDA into SNpc. Scale bar: 1 mm. c Summary bar graph of optical density of TH + fluorescence (n = 16, 8, 16, 16, 24, and 24 of slices). One-way ANOVA followed by Tukey's multiple comparison test for c. ****p < 0.0001.
Fig. 8
Fig. 8
DA-HA alleviates apomorphine-induced rotational behavior in 6-OHDA Parkinson's disease model. a Experimental schedule and detailed schematic diagrams for surgery and apomorphine-induced rotation test. b Representative TH + fluorescent image of striatum for validation of guide cannula location. Dotted lines indicate guide cannula tracts and striatum. Scale bar: 1 mm. c Unpaired comparison of apomorphine-induced rotation test with 10 min after injection of vehicle (0.02 % ascorbic acid), 2.5 mM DA-HA, 2.5 mM L-DOPA or 2.5 mM DA (n = 22, 10, 10, 7) into striatum. d Paired comparison between vehicle, 10 min and 24 h after drug injection (n = 6, 6, 7). One-way ANOVA followed by Tukey's multiple comparison test for c. Paired t-test for d. *p < 0.05, **p < 0.01.

References

    1. Dews P.B. Studies on behavior. IV. Stimulant actions of methamphetamine. J. Pharmacol. Exp. Therapeut. 1958;122:137–147. - PubMed
    1. Lippa A.S., Antelman S.M., Fisher A.E., Canfield D.R. Neurochemical mediation of reward: a significant role for dopamine? Pharmacol. Biochem. Behav. 1973;1:23–28. doi: 10.1016/0091-3057(73)90050-6. - DOI - PubMed
    1. Kobayashi K. Role of catecholamine signaling in brain and nervous system functions: new insights from mouse molecular genetic study. J. Invest. Dermatol. Symp. Proc. 2001;6:115–121. doi: 10.1046/j.0022-202x.2001.00011.x. - DOI - PubMed
    1. Dismukes R.K., Rake A.V. Involvement of biogenic amines in memory formation. Psychopharmacologia. 1972;23:17–25. doi: 10.1007/BF00414410. - DOI - PubMed
    1. Lustig C., Meck W.H. Chronic treatment with haloperidol induces deficits in working memory and feedback effects of interval timing. Brain Cognit. 2005;58:9–16. doi: 10.1016/j.bandc.2004.09.005. - DOI - PubMed

Publication types

LinkOut - more resources