Review
. 2024 Aug 22;187(17):4458-4487.
doi: 10.1016/j.cell.2024.07.036.

Multiphoton fluorescence microscopy for in vivo imaging

Affiliations
Review

Multiphoton fluorescence microscopy for in vivo imaging

Chris Xu et al. Cell. .

Abstract

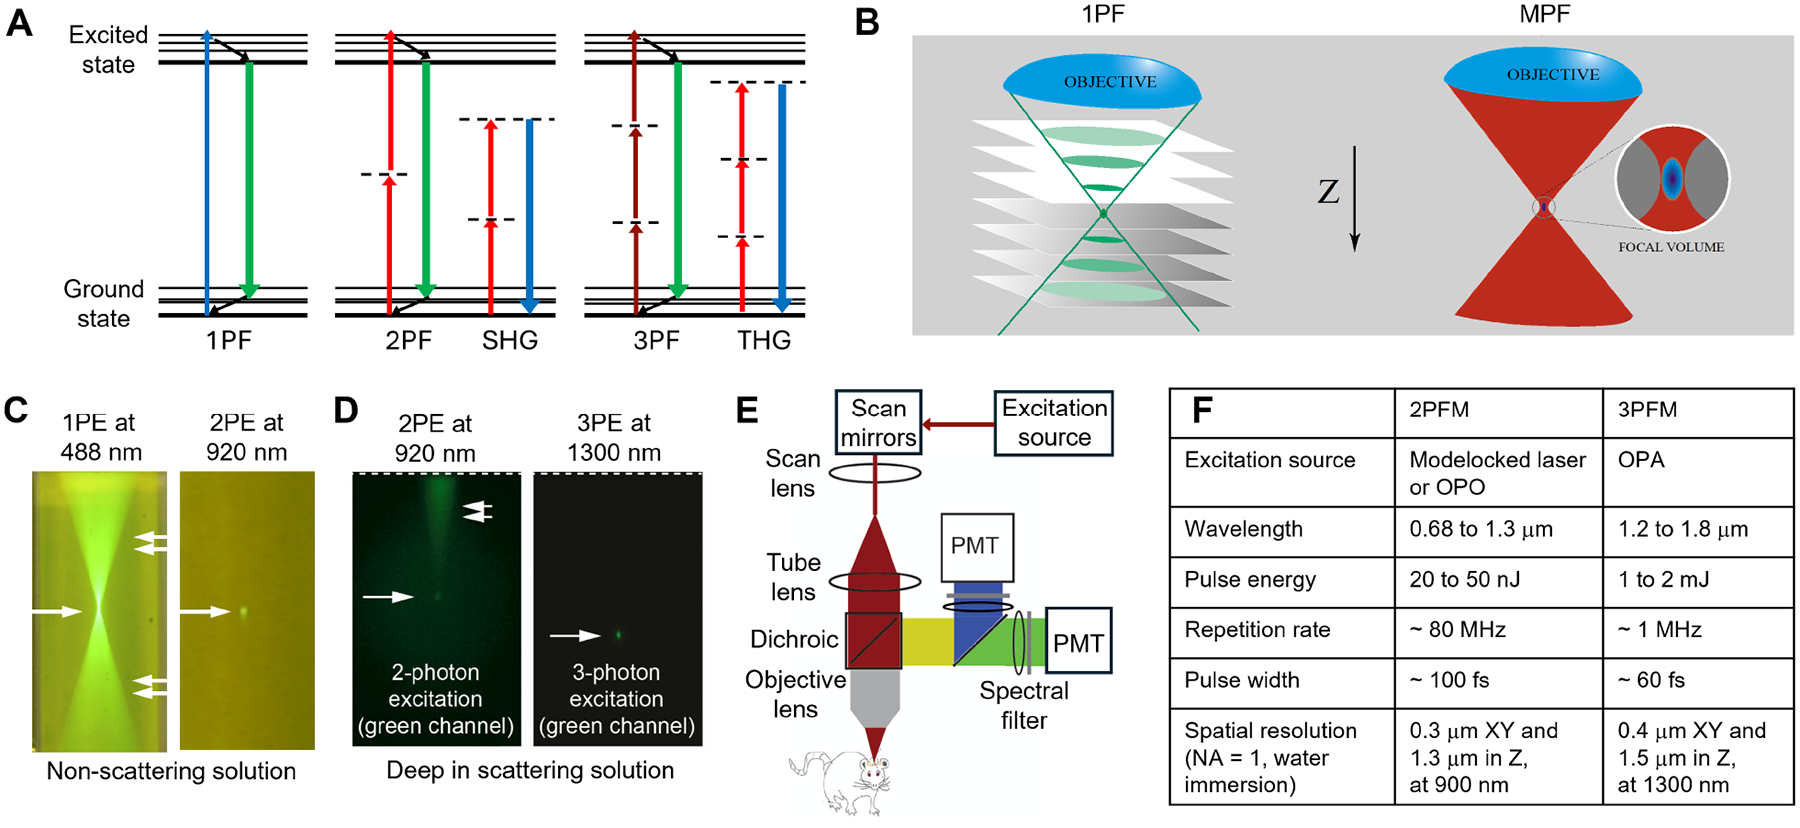
Multiphoton fluorescence microscopy (MPFM) has been a game-changer for optical imaging, particularly for studying biological tissues deep within living organisms. MPFM overcomes the strong scattering of light in heterogeneous tissue by utilizing nonlinear excitation that confines fluorescence emission mostly to the microscope focal volume. This enables high-resolution imaging deep within intact tissue and has opened new avenues for structural and functional studies. MPFM has found widespread applications and has led to numerous scientific discoveries and insights into complex biological processes. Today, MPFM is an indispensable tool in many research communities. Its versatility and effectiveness make it a go-to technique for researchers investigating biological phenomena at the cellular and subcellular levels in their native environments. In this Review, the principles, implementations, capabilities, and limitations of MPFM are presented. Three application areas of MPFM, neuroscience, cancer biology, and immunology, are reviewed in detail and serve as examples for applying MPFM to biological research.


Conflict of interest statement

Declaration of interests M.N. is a paid consultant for CNS2 for unrelated work.

Figures

Figure 1.
Figure 1.. Principle and implementation of multiphoton laser scanning fluorescence microscopy (MPFM).
(A) Jablonski diagrams for 1-photon fluorescence (1PF), 2-photon fluorescence (2PF) and second harmonic generation (SHG), and 3-photon fluorescence (3PF) and third-harmonic generation (THG). The dashed lines indicate virtual states. (B) Schematic illustration of 1PF and multiphoton excited fluorescence (MPF). In 1PF, total fluorescence from each XY-plane is the same, assuming negligible attenuation of the excitation beam. In MPF, nonlinear excitation confines the fluorescence mostly to the focal volume of the objective lens. (C,D) Side view photos of fluorescence distribution recorded with a camera. The cuvettes contain fluorescein solution in (C) and scattering tissue phantoms mixed with yellow-green fluorescent beads in (D). The arrows point to the foci, and the double arrows point to the out-of-focus background. Photos in (D) courtesy of Jason Kerr (Max Planck Institute for Neurobiology of Behavior, Bonn). (E) A typical implementation of a multiphoton laser scanning microscope with epi-fluorescence collection using two photomultiplier tubes (PMTs). (F) Typical parameters for 2PFM and 3PFM. OPO: optical parametric oscillator. OPA: optical parametric amplifier.
Figure 2.
Figure 2.. Typical applications of in vivo fluorescence microscopy with optical sectioning capability and subcellular spatial resolution.
The imaging speed largely determines the imaging field of view (FOV) and volume at a specific spatial and temporal resolution. The imaging depth is in arbitrary unit (a.u.). Inset on the top right shows a few examples of typical imaging depth limits (in mm) for GFP-based probes in mouse models where quantitative data are available.
Figure 3.
Figure 3.. Examples of in vivo 2PFM imaging of neurons in the mouse brain.
(A) Images of a dendritic segment acquired over sequential days. Blue, red and yellow arrowheads: transient, semi-stable and stable spines. From Ref. . Reproduced with permission from Springer Nature. (B) AMPA receptor GluA1 subunit (tagged with super ecliptic pHluorin, SEP) levels increase in spines on the apical dendrites (labeled with cytosolic DsRed) of a layer 5 pyramidal neuron in the visual cortex during motor learning. Reprinted from Ref. , with permission from Elsevier. (C) 2P-FLIM sensor tAKARa detects PKA activation through decreased fluorescence lifetime in motor cortical neurons during enforced running (running speed indicated below lifetime traces). Reprinted from Ref. . (D) A layer 2/3 neuron of the primary auditory cortex, filled with the synthetic calcium indicator OGB-1 by a pipette (yellow arrow), with subthreshold calcium transients in two example spines (S1, S2) evoked by four consecutive trials of auditory stimulation (vertical lines). From Ref. . Reproduced with permission from Springer Nature. (E) Vibrissal motor cortex axons expressing GCaMP3 in the C1 barrel column, fluorescence traces from their varicosities (i.e., putative bouton), and the same axons whose activity decodes different behavioral features. From Ref. . Reproduced with permission from Springer Nature. (F) A layer 2/3 neuron of the somatosensory cortex, labeled with the voltage indicator postASAP, with spine-only depolarization. From Ref. . Reprinted with permission from AAAS. (G) In vivo recordings of calcium transients evoked by whisker deflection from two example layer 2/3 barrel cortex neurons bulk-loaded with OGB-1 AM ester. From Ref. . Copyright (2003) National Academy of Sciences, U.S.A. (H) CA1 place cells in the dorsal hippocampus labeled with GCaMP3 and their place field position. From Ref. . Reproduced with permission from Springer Nature.
Figure 4.
Figure 4.. Examples of in vivo 2PFM imaging of non-neuronal cells and CSF transport in the mouse brain.
(A) Astrocytes. Four astrocytes, from which fluorometric Ca2+ imaging was made, are outlined. From Ref. . (B) Human microglia response to focal brain injury. Example images from a time-lapse recording showing tdTomato-expressing human microglia (white; cell bodies and processes) before and at the indicated time points after focal laser lesion (red arrowhead and circle). The data were recorded in an adult NOD/SCID mouse 26 weeks after transplantation of an immunocompetent human brain organoid into the animal’s retro-splenial cortex. Image stack interval: 69 s. Courtesy of Axel Nimmerjahn. (C) Oligodendrocyte precursor cells (OPCs).Longitudinal imaging of OPCs expressing mEGFP in the somatosensory cortex of adult Matn4-mEGFP mice for 100 days. One OPC (highlighted by yellow arrow) divides (day 15), with one sister cell migrating away (green arrow). Image interval: 2–3 days. Courtesy of Dwight Bergles. (D) Oligodendrocytes. Oligodendrocytes expressing EGFP in the somatosensory cortex of an adult Mobp-EGFP;Mobp-Cre;R26-lsl-DTR mouse. Courtesy of Dwight Bergles. (E) Choroid plexus epithelial cells. ChP epithelial cell in a transgenic mouse (FoxJ1-Cre::Ai95D) expressing GCaMP6f. Reprinted from Ref. , with permission from Elsevier. (F) Cerebral vasculature. Time-lapse images of the cross-section of a penetrating cortical artery (green, plasma labeled with FITC-dextran) exposed to photolysis of DMNP-EDTA. Ca2+ uncaging (lightning symbol) triggered a rapid increase of Ca2+ in the astrocytic endfoot (red, labeled with synthetic calcium indicator rhod-2 AM) and arterial vasodilation. From Ref. . Reproduced with permission from Springer Nature. (G) Pericytes. In vivo imaging of a pericyte reporter mouse (NG2-DsRed) revealed that pericyte cell bodies were located along many (left panel, red arrow) but not all (right panel, white arrow) cortical capillaries (plasma labeled with FITC-dextran). Capillary branches lacking pericytes (white arrow) were identified by the absence of NG2-DsRed+ cell bodies (red). Reprinted from Ref. , with permission from Elsevier. (H) Glymphatic transport. Tracers injected in a sleeping mouse and then again after the mouse was awakened. The vasculature was visualized by means of cascade blue-dextran administered via the femoral vein. FITC-dextran (green) was first injected in the cisterna magna in a sleeping mouse and visualized by collecting repeated stacks of z-steps. Thirty min later, the mouse was awakened and Texas red-dextran (red) was administered 15 min later. The experiments were performed mostly asleep (12 to 2 p.m.). Arrow: penetrating arteries. From Ref. . Reprinted with permission from AAAS. (I) Meningeal lymphatic vessels. Representative z-stack of cerebrospinal fluid-filled vessel from a mouse injected with QDot655 and Alexa488-conjugated anti-Lyve-1 antibody. CSF, cerebrospinal fluid. From Ref. . Reproduced with permission from Springer Nature. (J) SLYM, a meningeal membrane. Maximum projection and 3D views depict the spatial distribution of dura mater collagen fibers (gray; detected by SHG), Prox1-EGFP+ cells (green; 2PFM) intermixed with the irregular sparse collagen fibers (purple; SHG) localized below dura, and blood vessels (red, Cascade Blue conjugated dextran; 2PFM) at the surface of somatosensory cortex. SLYM: subarachnoid lymphatic-like membrane. From Ref. . Reprinted with permission from AAAS.
Figure 5.
Figure 5.. Examples of intravital 2P imaging of immune responses in inflamed tissues.
(A) Surveillance mechanisms in the intestine. Intraepithelial lymphocytes send dynamic cellular protrusions between intestinal epithelial cells to scan for microbomes, termed ‘flossing’. This behavior is intensified during infection. Left panel: intraepithelial lymphocytes (arrow) (green, TCRγδGFP) following Salmonella Typhimurium infection; mice injected with Hoechst dye (blue) for visualization of epithelial cell nuclei. Right panel: zoom of 1 villus showing a flossing (arrow) movement, 4D tracking of TCRγδGFP cells (colorful lines) was performed. Line delineates the intraepithelial (IE) compartment. Arrow shows tracked flossing movements. LP: Lamina Propria, Lu: lumen. Reprinted from Ref. , with permission from Elsevier. (B) Surveillance mechanisms in the lung. Alveolar macrophages actively patrol the aveolar space. Time-lapse of alveolar macrophages (green, PKH-AM) migrating towards and capturing Pseudomonas aeruginosa (red, P. aeruginosa). Reprinted from Ref. , with permission from Elsevier. (C) Neutrophil swarming following tissue damage. Time-lapse of neutrophils (green, Lyz2GFP neutrophils/monocytes) recruited to the dermis following laser-induced sterile skin injury (blue dotted line) undergo coordinated LTB4-dependent aggregation or swarming behavior. Neutrophils swarming leads to the rearrangement of collagen fibers (visualized by second harmonic generation, white). From Ref. . Reproduced with permission from Springer Nature. (D) Leukocyte extravasation at ‘hot spots’ enriched for chemokine producing cells. Time-lapse of the inflamed skin dermis, CXCR3+ CD4+ T effector cells (arrow) (green, CFSE-labeled Th1 cells) exiting the vasculature (magenta, CD31-labeled blood vessels) in areas of CXCL10 chemokine production (blue, CXCL10BFP). From Ref. . (E) T cell interstitial migration in the inflamed dermis along extracellular matrix fibers, dependent on T cell integrin alpha-v/beta-3 and fibronectin. Time-lapse of migrating Th1 cells (blue pseudo-colored, CMTMR-labeled Th1 cells) along fibronectin-labeled fibers (green, FN-AF488). From Ref. . (F) Perivascular niches at tissue sites enhance T cell activation through the coordinated aggregation of multiple immune cells types. Left panel: perivascular niche in the inflamed dermis. CD4+ Th1 cells (green, CFSE-labeled Th1 cells) form pronged contacts with activated APCs (blue, CXCL10BFP) in the perivascular niche (red, CD31-labeled blood vessels). From Ref. . Right panel: perivascular niche in the stroma of implanted melanomas. CD8+ T cells (red, WT T cells; green, Cxcr6−/− T cells) accumulating at sites of dense perivascular dendritic cell clustering (yellow, IL-12p40YFP dendritic cells). Blood vessels (white, injected QTracker655). Reprinted from Ref. , with permission from Elsevier.
Figure 6.
Figure 6.. SHG, THG and 2P/3P fluorescence microscopy applications in cancer research.
(A) Plasticity of breast cancer invasion programs within the same tumor at the onset of invasion into the normal mammary gland. Images depict deep 3D stacks (maximum intensity projection). Fluorescent dextran, perfused blood vessels. From Ref. , reproduced with permission from Company of Biologists. (B) Arrival of individual or clustered circulating tumor cells in lung vessels prior to metastatic colonization. Images depict a time series of cells moving along the same vessel. From Ref. , reproduced with permission from AACR. (C) SHG, THG and 2P fluorescence microscopy detecting interface guidance of invading sarcoma cells (yellow) in different tissue compartments. Arrowheads denote examples of cell alignment along the tissue interface. From Ref. (©2012 Weigelin et al. Originally published in IntraVital. https://doi.org/10.4161/intv.21223). (D) Radiosensitization of sarcoma tumors by anti-integrin therapy combining RNA interference with antibody-based targeting (left panel). White asterisks denote dying tumor cells. Right panel: Identification of perivascular survival niche of tumor cells resisting therapy 26 days after irradiation. Zoom shows surviving cells without mitotic activity (arrowheads) and cytoplasm-free, condensed nuclei of disintegrated cells (asterisks). From Ref. (©2020 Haeger et al. Originally published in J Exp Med. https://doi.org/10.1084/jem.20181184). (E) Induction of cytotoxic hits in antigenic melanoma by adoptively transferred CTLs by pharmacological inhibition of adenosine signaling. GCaMP6s intensity and OT-I CTL density in B16F10/OVA tumors treated with vehicle or ZM-241385. The white box indicates the zoomed area (3.2-fold magnification of the overview image). Cyan: OT-I CTL. LUT: GCaMP6s intensity. From Ref. , reproduced with permission from AACRjournals.org.

References

    1. Einstein A (1905). On a heuristic point of view concerning the production and transformation of light. Ann. Phys 332, 132–148. 10.1002/andp.19053220607. - DOI
    1. Göppert-Mayer M (1931). Über Elementarakte mit zwei Quantensprüngen. Ann. Phys 401, 273–294. 10.1002/andp.19314010303. - DOI
    1. Hughes V, and Grabner L (1950). The radiofrequency spectrum of Rb85F andRb87F by the electric resonance method. Phys. Rev 79, 314–322. 10.1103/physrev.79.314. - DOI
    1. Kaiser W, and Garrett CGB (1961). Two-Photon Excitation in CaF2:Eu2+. Phys. Rev. Lett 7, 229–231. 10.1103/physrevlett.7.229. - DOI
    1. Singh S, and Bradley LT (1964). Three-Photon Absorption in Napthalene Crystals by Laser Excitation. Phys. Rev. Lett 12, 612–614. 10.1103/PhysRevLett.12.612. - DOI

LinkOut - more resources