. 2024 Oct 3;187(20):5679-5697.e23.
doi: 10.1016/j.cell.2024.07.041. Epub 2024 Aug 22.

Thyroid hormone remodels cortex to coordinate body-wide metabolism and exploration

Affiliations

Thyroid hormone remodels cortex to coordinate body-wide metabolism and exploration

Daniel R Hochbaum et al. Cell. .

Abstract

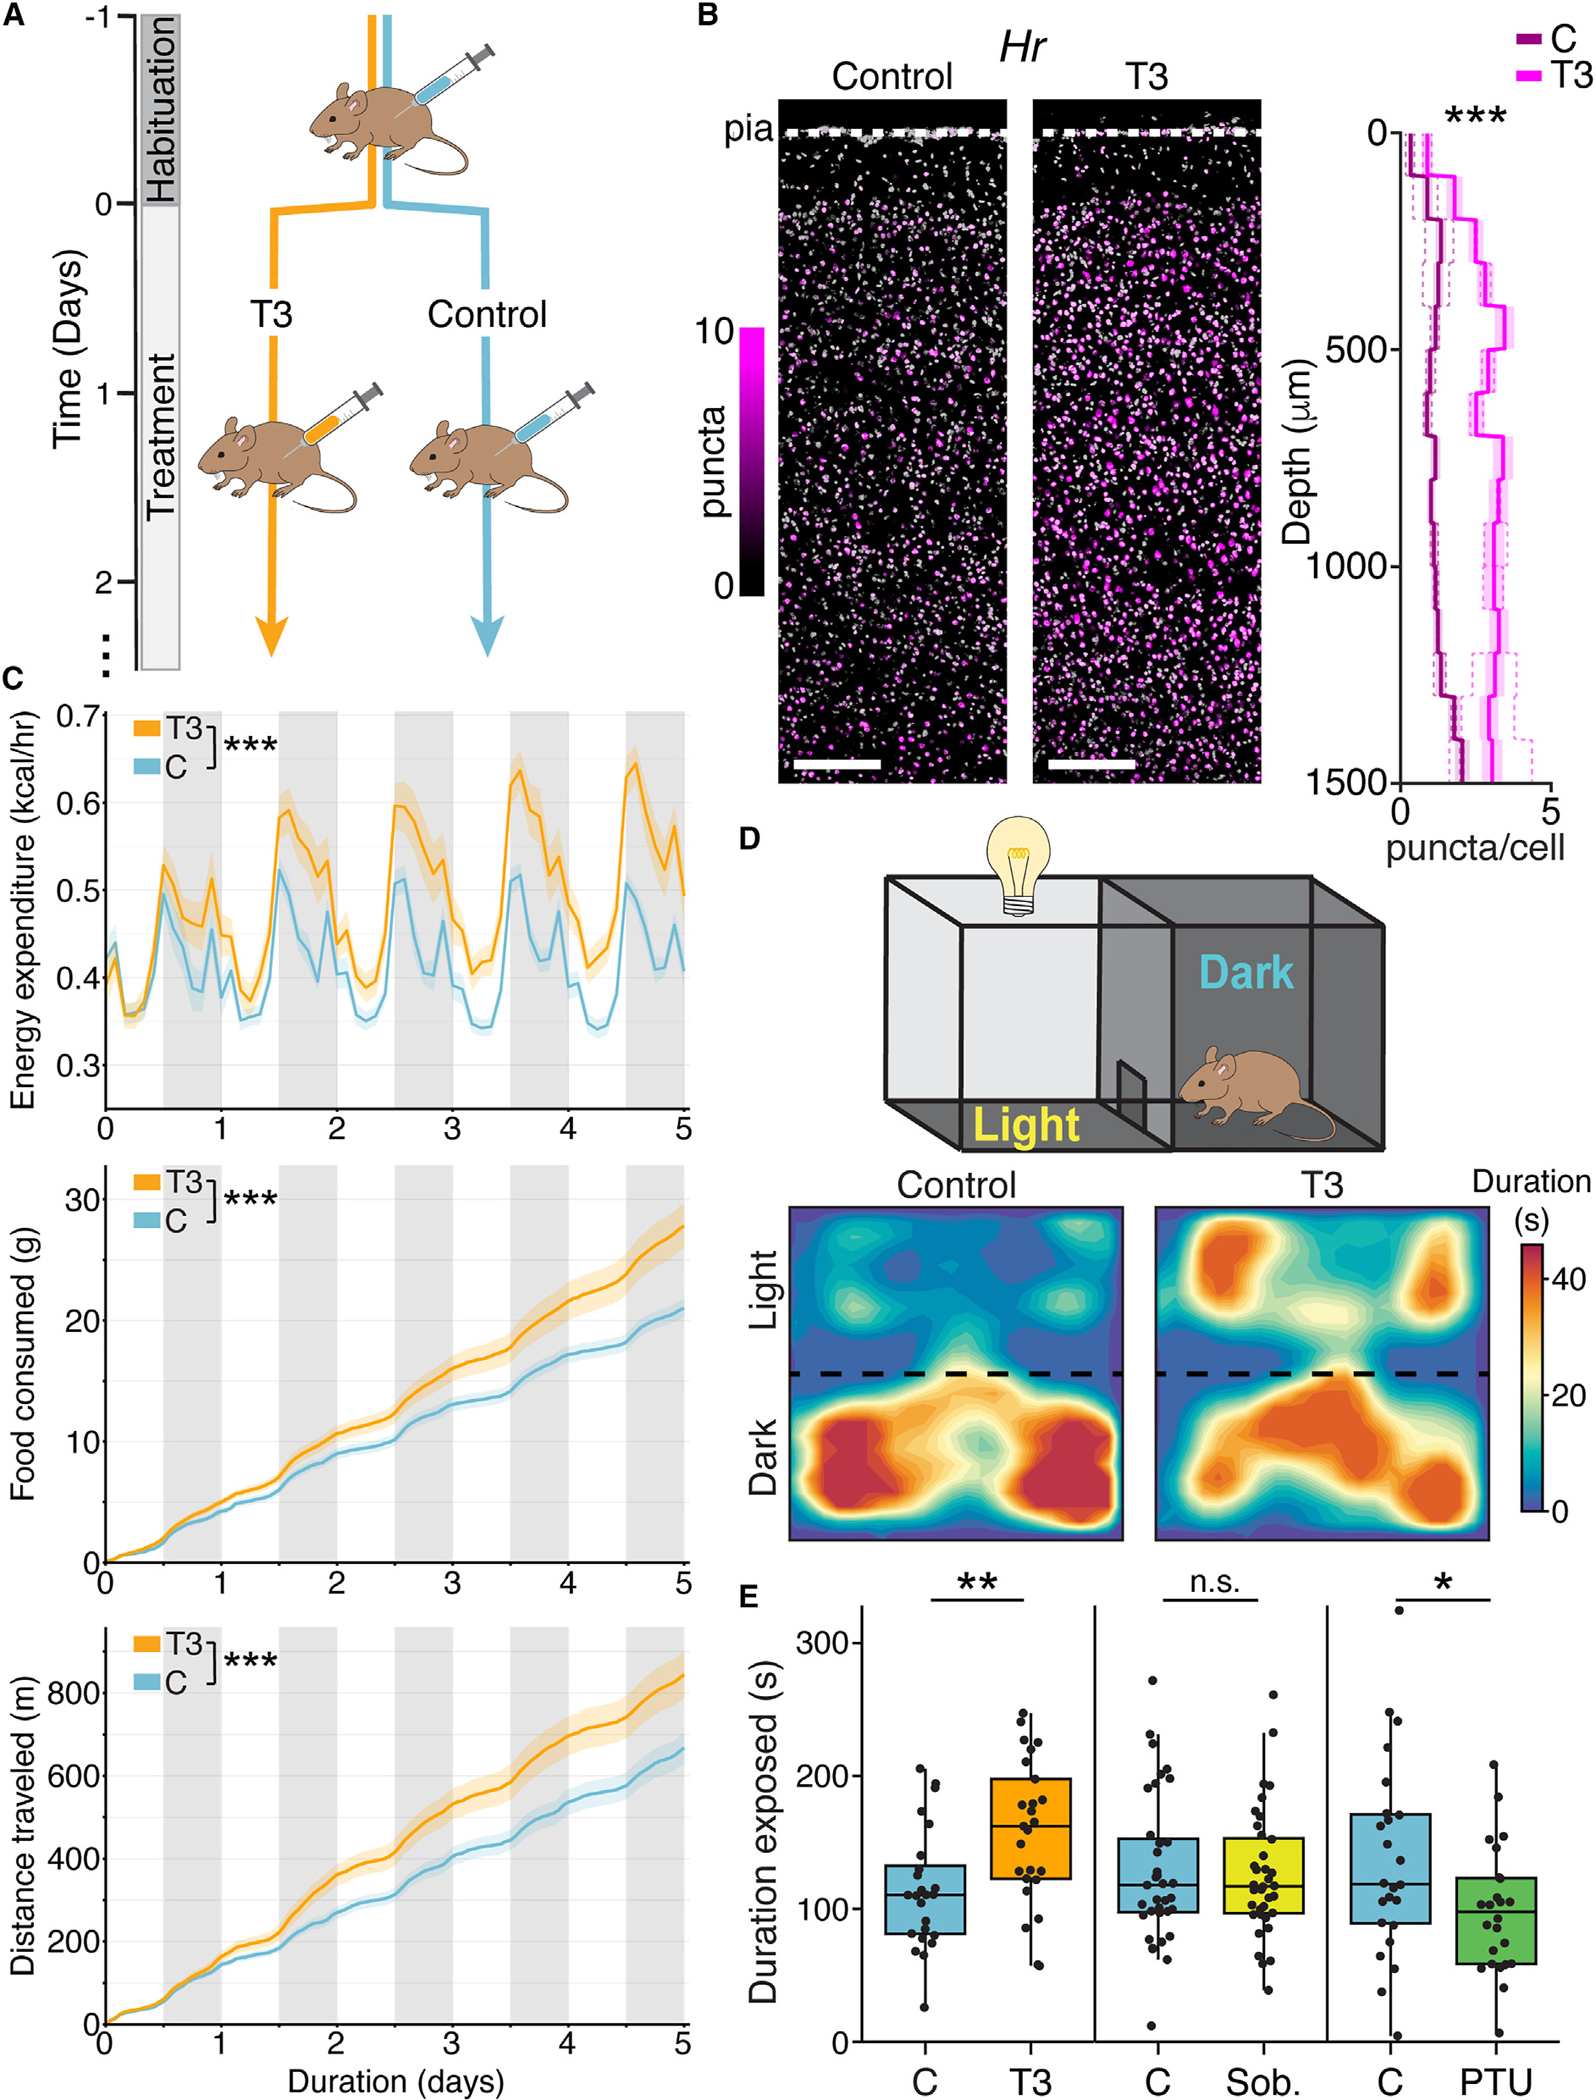
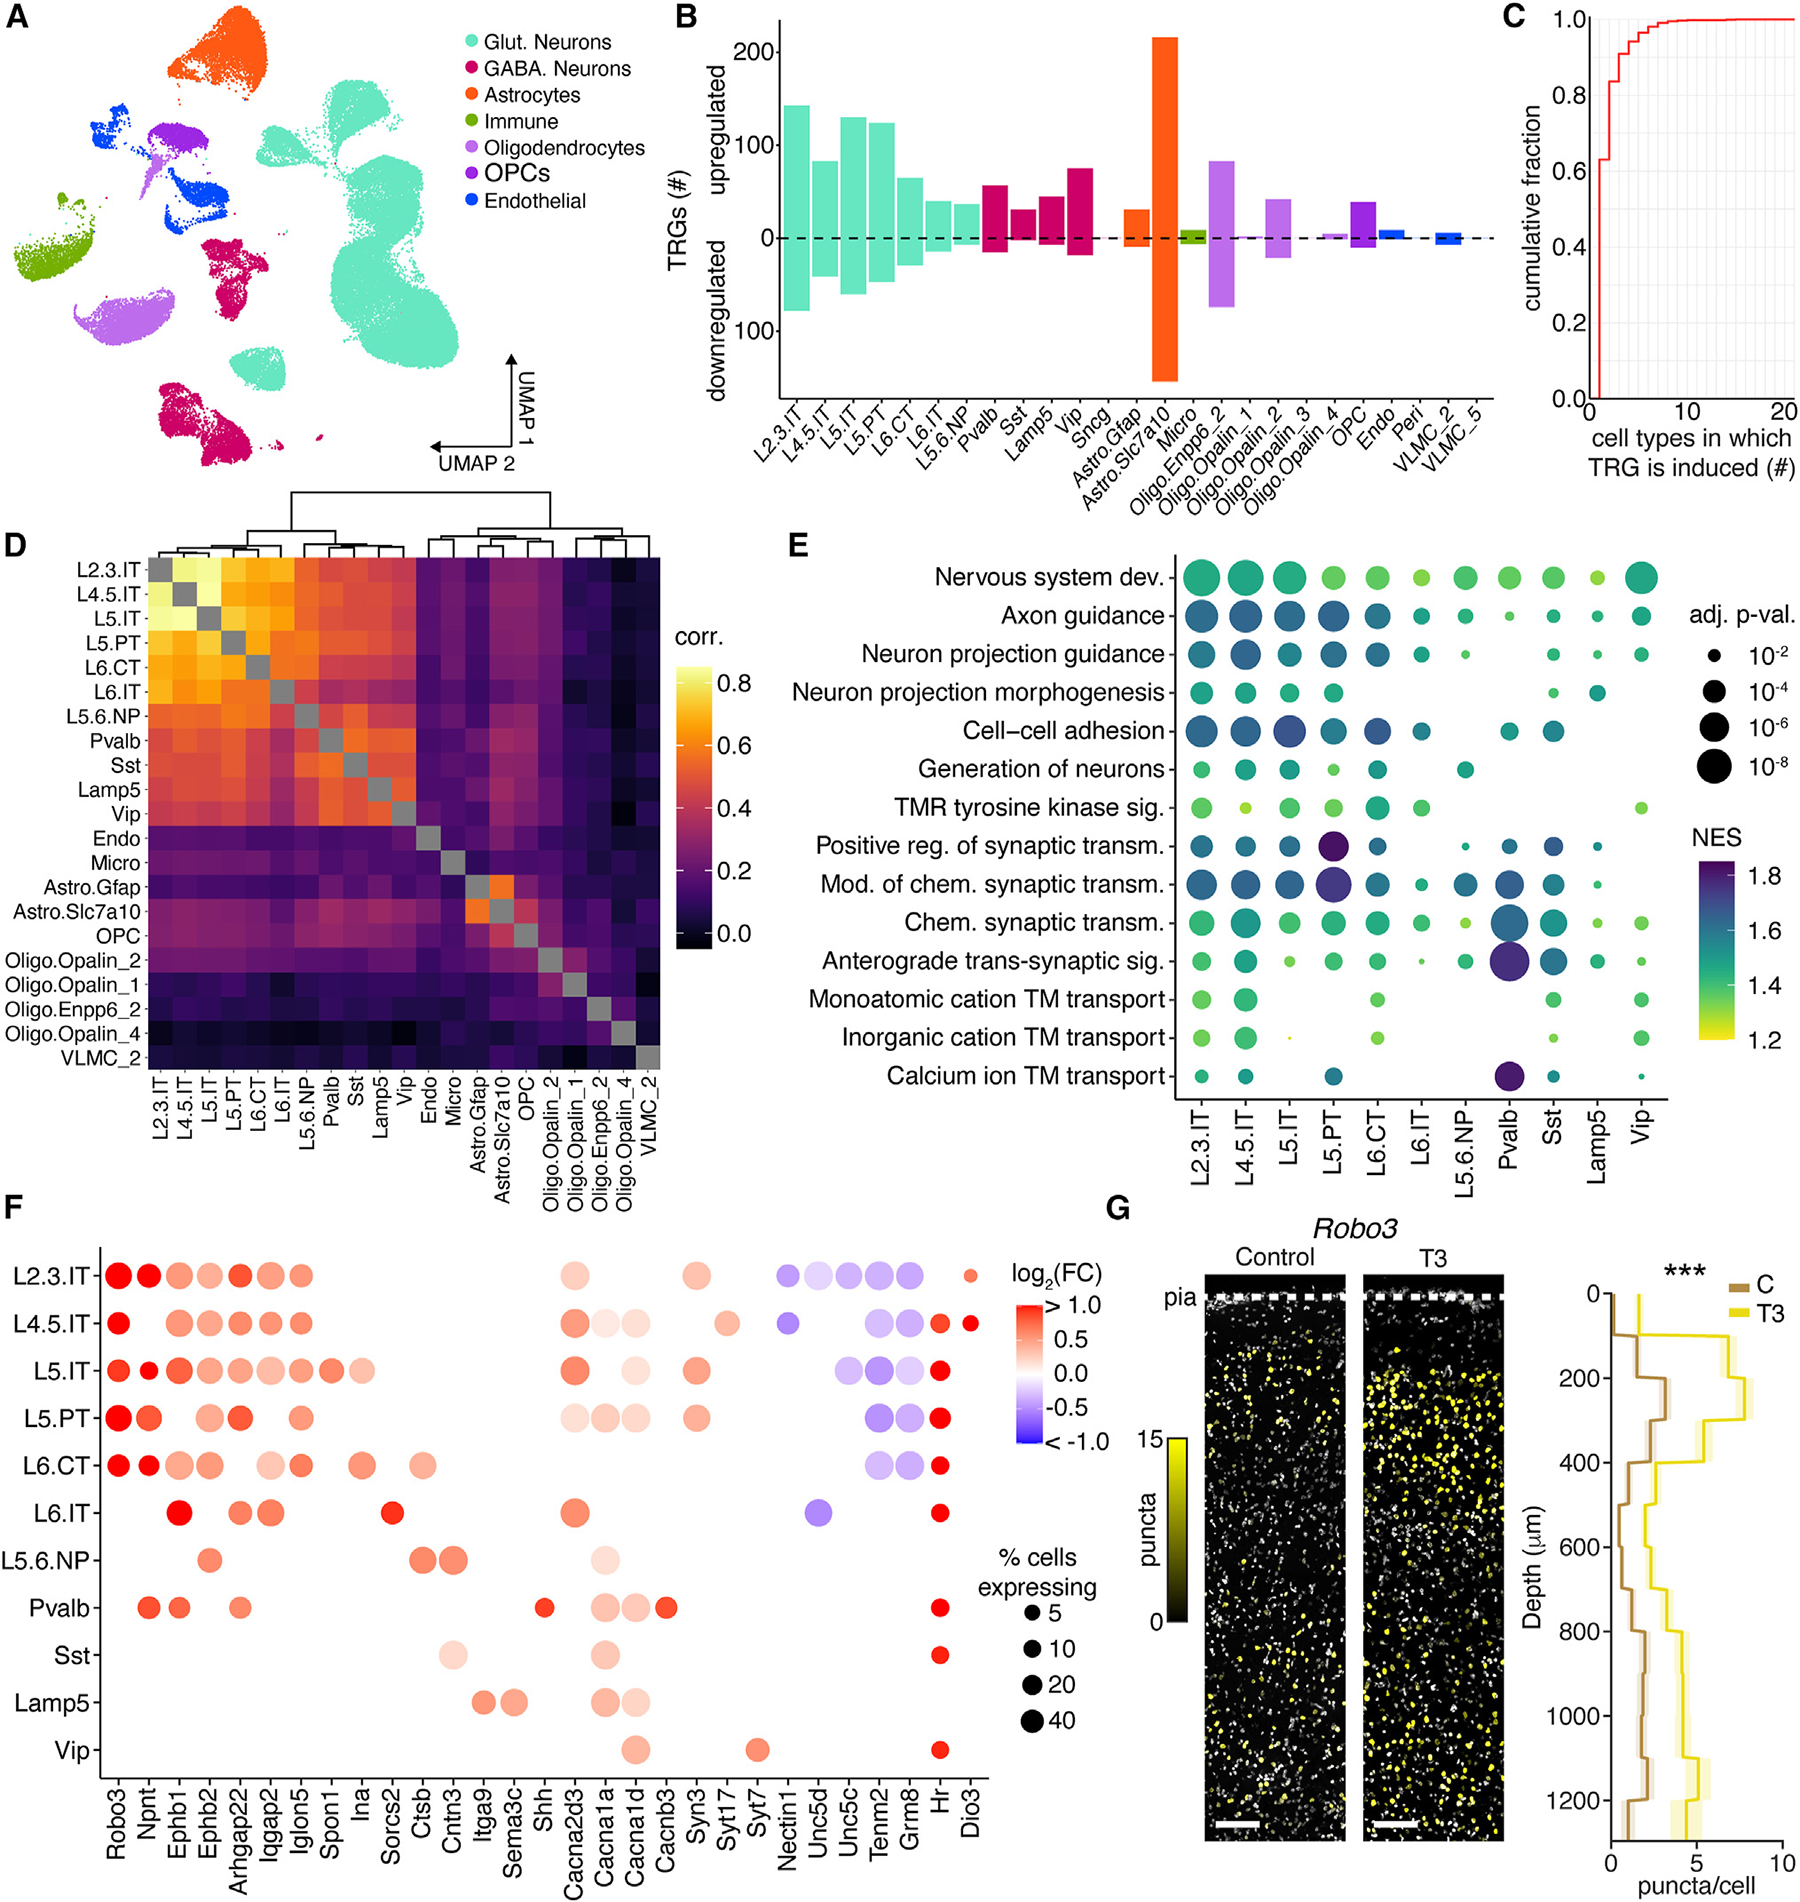
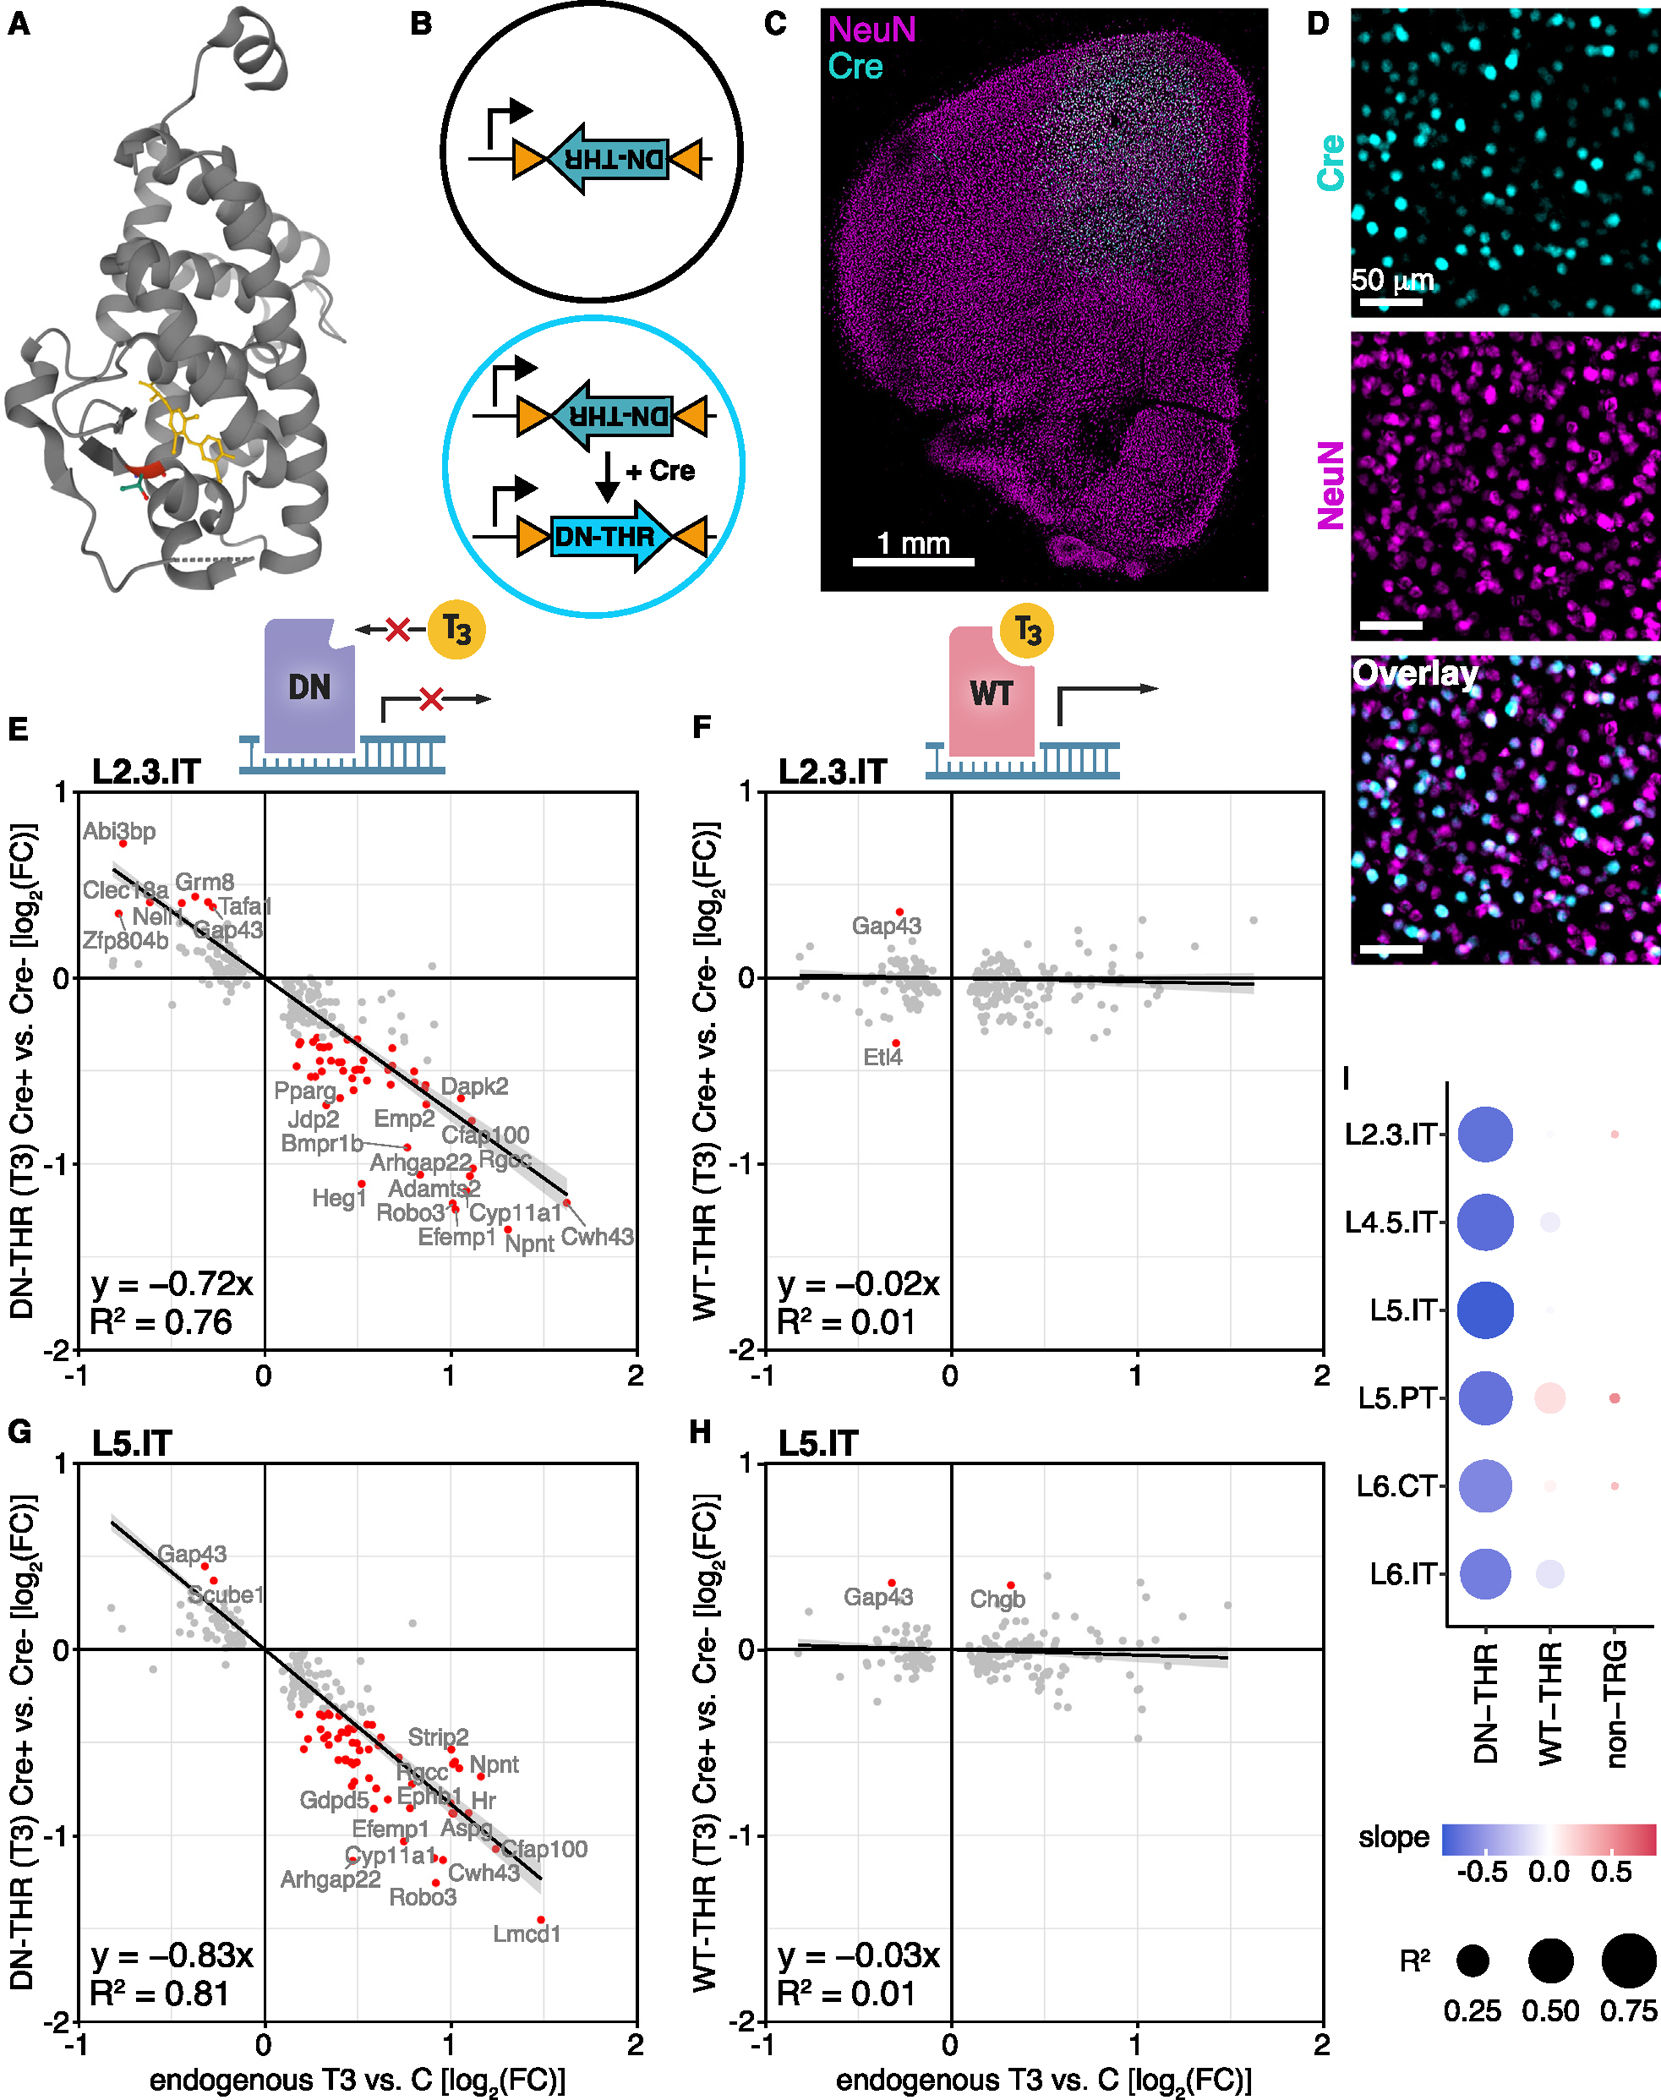
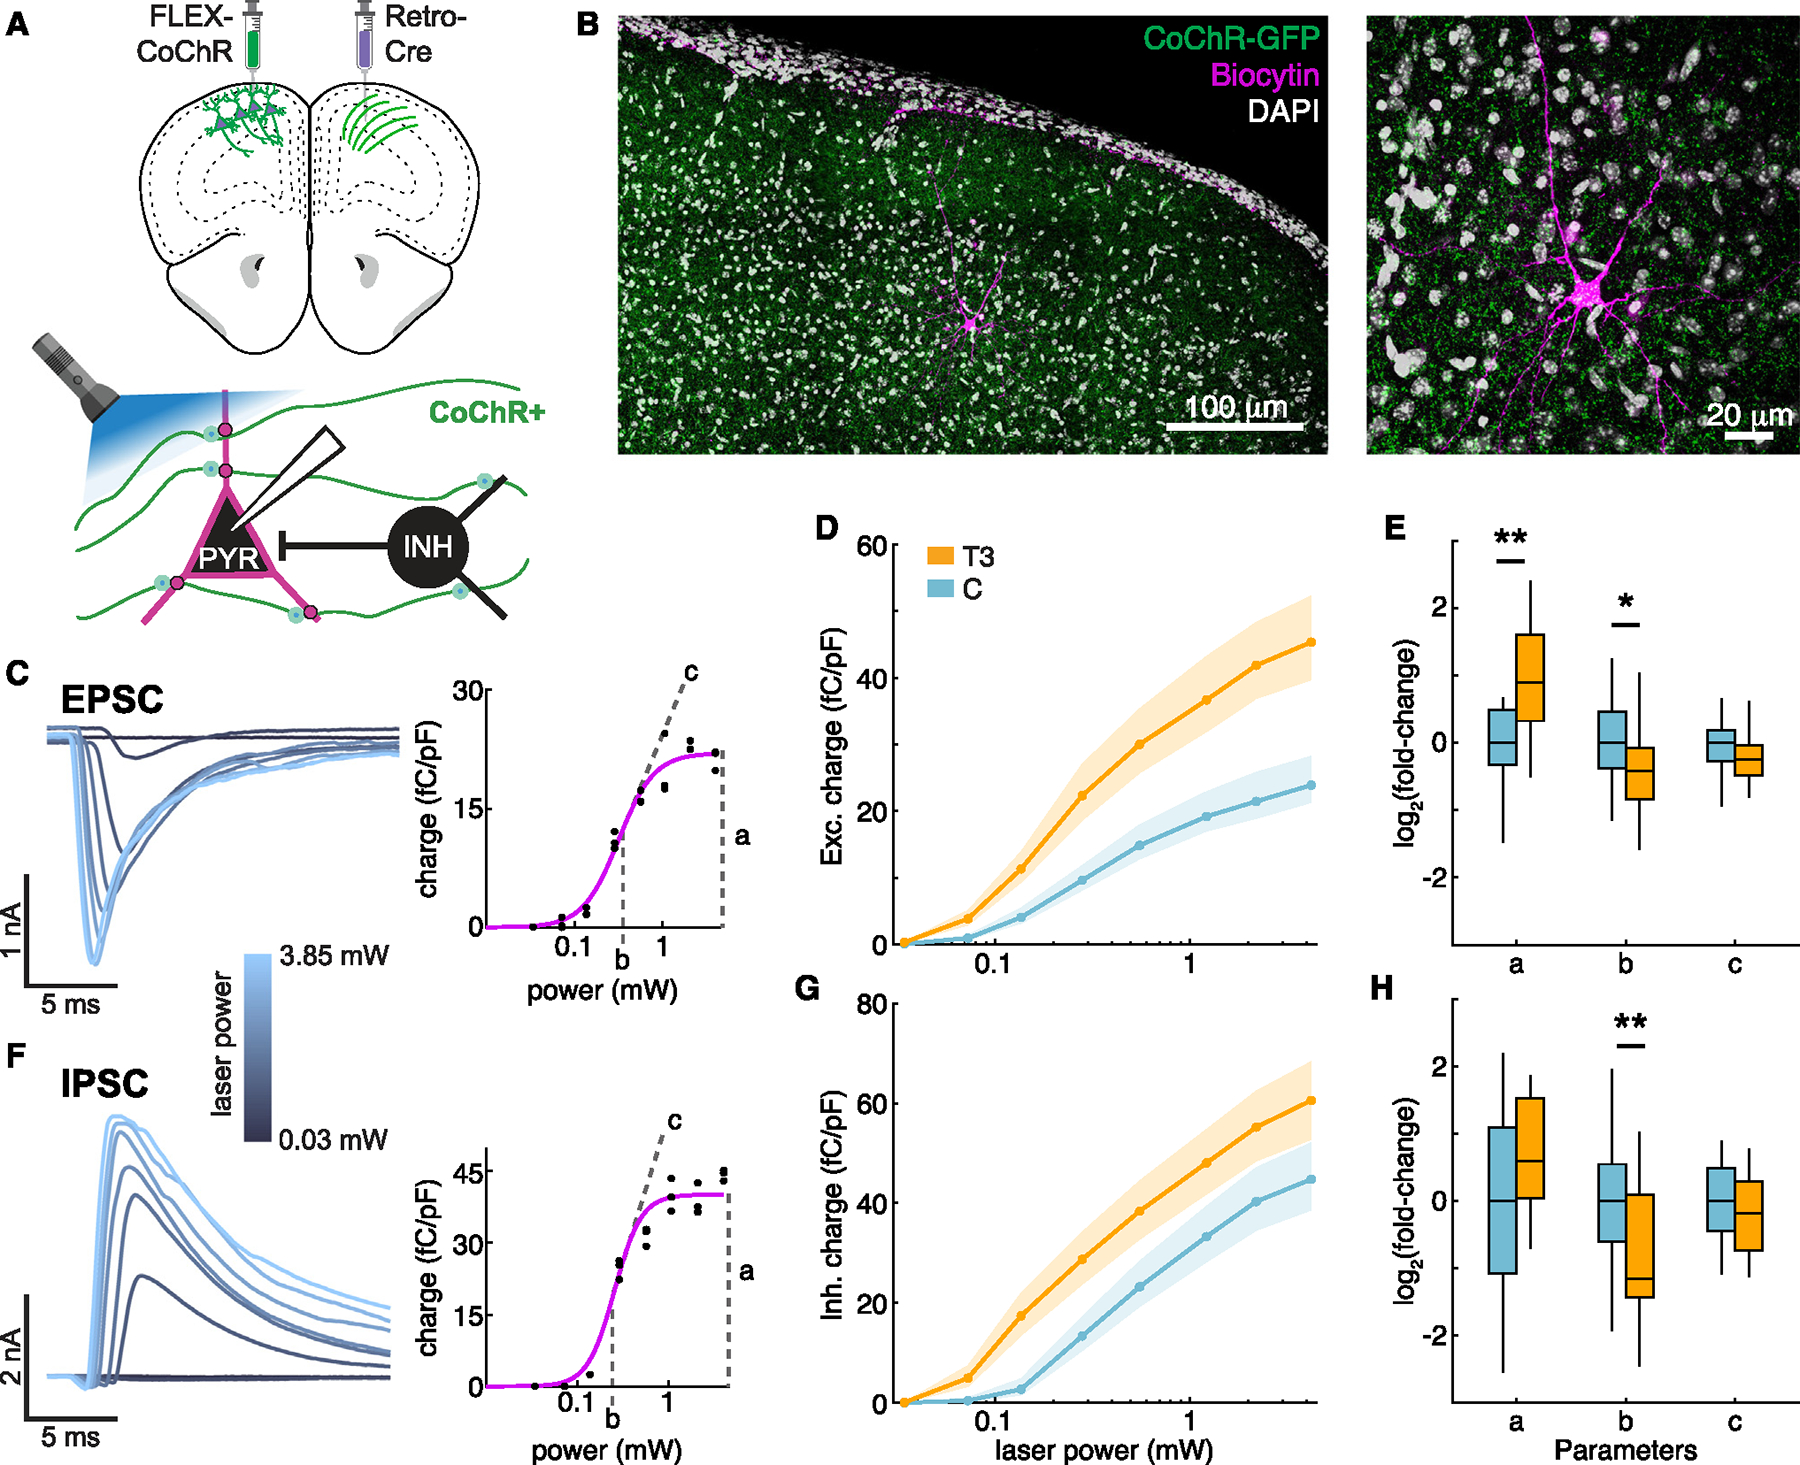
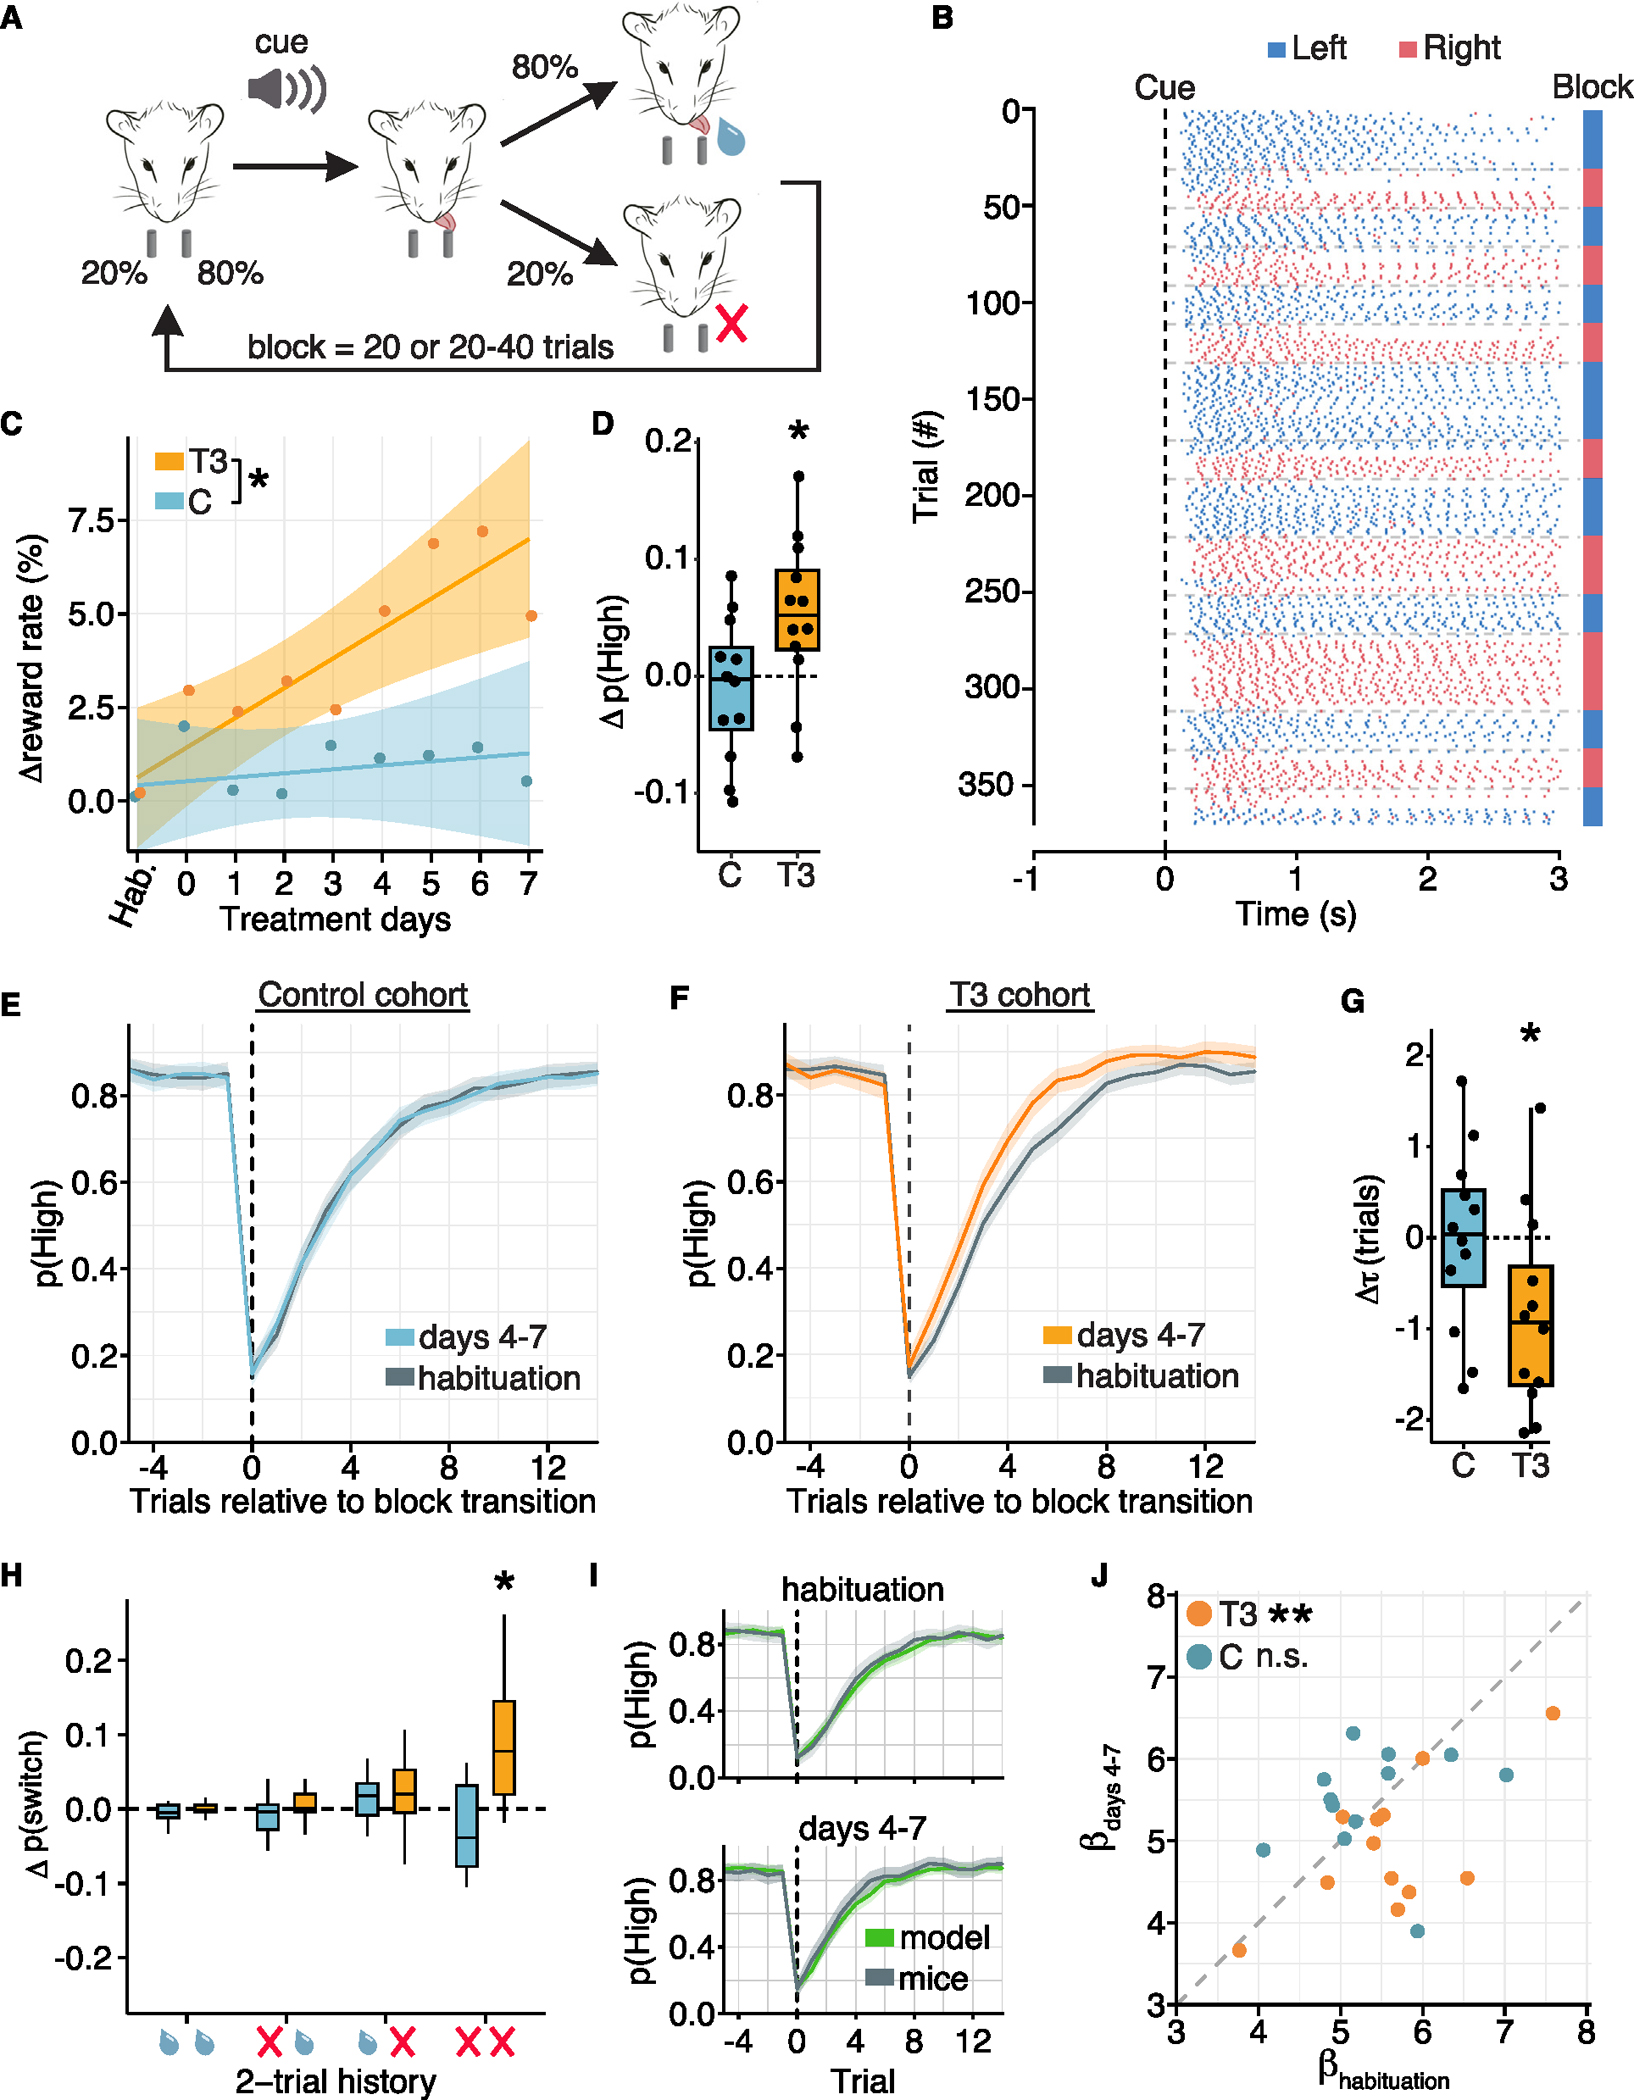
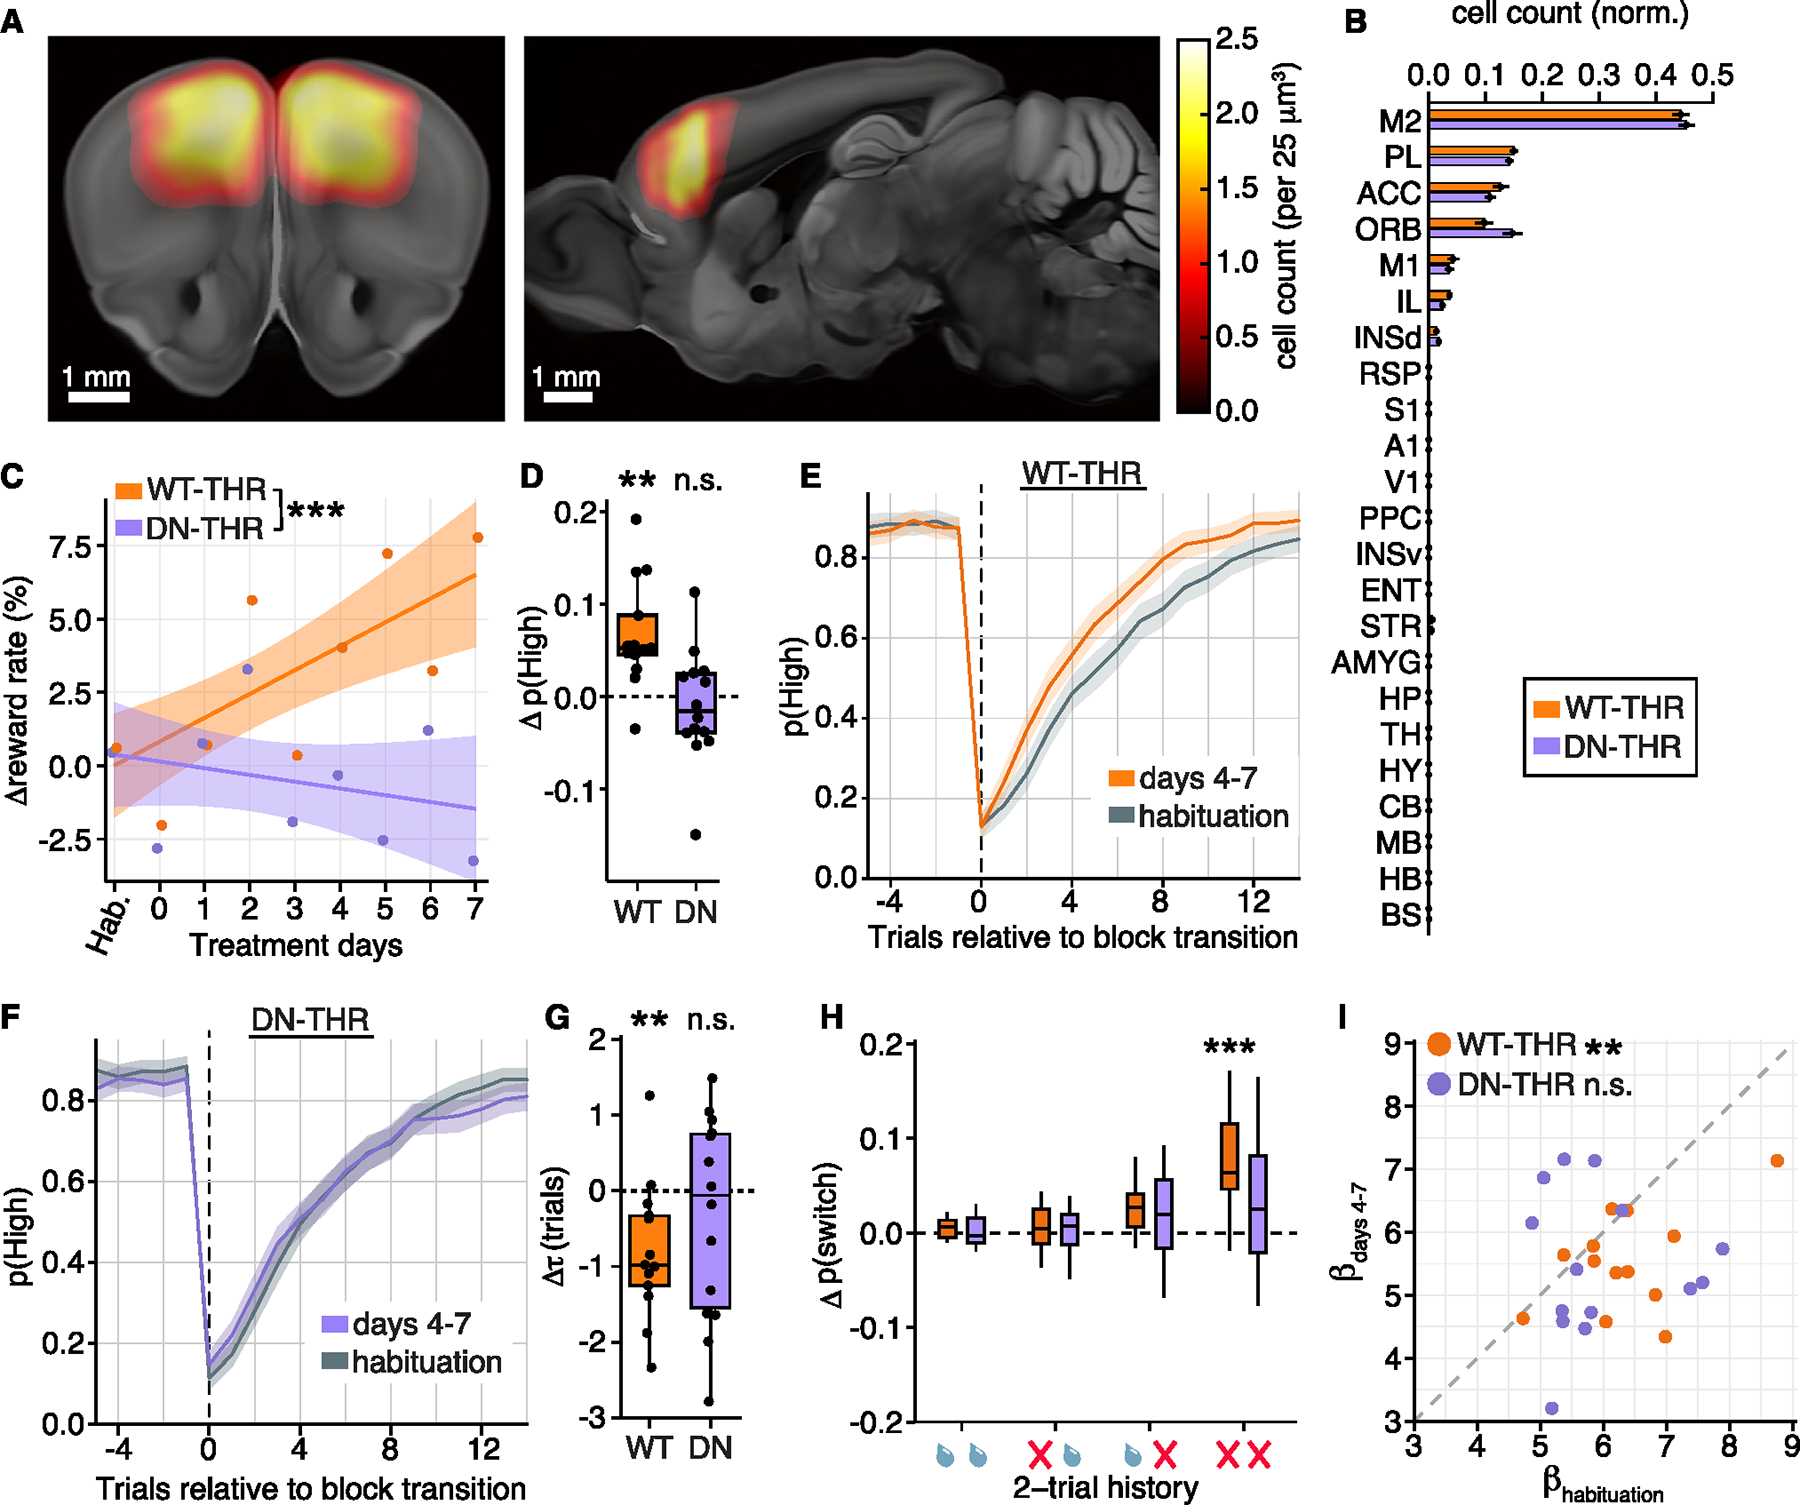
Animals adapt to environmental conditions by modifying the function of their internal organs, including the brain. To be adaptive, alterations in behavior must be coordinated with the functional state of organs throughout the body. Here, we find that thyroid hormone-a regulator of metabolism in many peripheral organs-directly activates cell-type-specific transcriptional programs in the frontal cortex of adult male mice. These programs are enriched for axon-guidance genes in glutamatergic projection neurons, synaptic regulatory genes in both astrocytes and neurons, and pro-myelination factors in oligodendrocytes, suggesting widespread plasticity of cortical circuits. Indeed, whole-cell electrophysiology revealed that thyroid hormone alters excitatory and inhibitory synaptic transmission, an effect that requires thyroid hormone-induced gene regulatory programs in presynaptic neurons. Furthermore, thyroid hormone action in the frontal cortex regulates innate exploratory behaviors and causally promotes exploratory decision-making. Thus, thyroid hormone acts directly on the cerebral cortex in males to coordinate exploratory behaviors with whole-body metabolic state.

Keywords: body-brain coordination; exploration; metabolism; neuroscience; synaptic plasticity; thyroid hormone; transcriptionally regulated behavior.


Conflict of interest statement

Declaration of interests T.S.S. is an advisor and founder of Autobahn Therapeutics and is an inventor on several patents related to sobetirome and its derivatives. T.S.S. provided the sobetirome used in this study but was not involved in the study design, performing the work described, or in the analysis and presentation of the results.

Figures

Figure 1.
Figure 1.. Brain-penetrant T3 induces transcription in cortex and modulates spontaneous exploratory behaviors
(A) Mice were habituated to IP injections with vehicle and were then divided into T3 and vehicle control cohorts. (B) FISH of Hr in M2 (left: control; middle: T3; nuclei pseudo-colored by number of puncta, see Figure S1E). Scale bars, 200 μm. Right: Hr expression as a function of cortical depth. Hr is upregulated by T3 across cortex (p = 0, Wilcoxon rank-sum test comparing treatment effect across entire cortical depth; control: n = 5,494 cells; T3: n = 6,061; 2 mice per condition). Central line/shade: mean/95% confidence intervals. Dotted lines: mean expression values per mouse. (C) Home-cage indirect calorimetry revealed that energy expenditure, food consumption, and distance traveled significantly increased with T3 treatment (p < 10−4, likelihood ratio tests, n = 16 control, n = 15 T3-treated mice). Central line/shade: mean/SEM. (D) Top: schematic of light-dark preference assay (LD). Bottom: example heatmaps of the duration that a control (left) and a T3-treated (right) mouse occupied each area of the LD box. (E) Duration male mice stayed in the light-exposed zone increased with T3 (left) (p = 0.004, n = 24 control, n = 25 T3 mice), was unaffected by sobetirome (middle) (p = 0.818, n = 35 control, n = 36 sobetirome mice), and decreased with PTU (right) (p = 0.04, n = 24 control, n = 24 mice). Welch’s t tests. Central line: median, box: IQ, whiskers: data within 1.5× IQR. Black dots indicate data from single mice. For all panels: n.s., not significant; *p < 0.05, **p < 0.01, ***p < 0.001. See also Figures S1, S2, and S3.
Figure 2.
Figure 2.. snRNA-seq of M2 reveals cell-type-specific T3-induced transcriptional programs
(A) Uniform manifold approximation and projection (UMAP) representation of nuclear transcriptomes (each dot = one nucleus). Sequenced nuclei clustered into broad cell classes and were subsequently mapped onto specific cell types (Figure S4B). (B) The numbers of TRGs within each cell type (false discovery rate [FDR]-adjusted p < 0.05, |robScore_logFC| ≥ 0.5). Full list of TRGs: Table S1. (C) Cumulative distribution of the number of cell types in which TRGs are induced. Most TRGs (~60%) were detected in only one cell type. (D) Heatmap representation of the Spearman correlation of changes in expression of TRGs across cell types. Cell types without TRGs were excluded. The dendrogram shows the hierarchical clustering of cell types based on changes in expression of TRGs. (E) Dot plot of top terms from GSEA of TRGs in glutamatergic and GABAergic neurons. The union of the top 3 terms per cell type is displayed. Color: normalized enrichment score for a given term associated with TRGs. Size: FDR-adjusted p value. TM, transmembrane; TMR, transmembrane receptor. Full GSEA results for each cell type with sufficient sample size: Table S2. (F) Dot plot of TRGs expression changes across glutamatergic and GABAergic neurons. Neuronal TRGs were enriched for many genes driving axon-guidance GSEA terms, including Robo3, Npnt, and ephrins (Ephb1, Ephb2) in glutamatergic projection neurons, and genes associated with presynaptic function such as Cacna2d3, Cacna1a, Syn3, and synaptotagmins (Syt7, Syt17). Downregulated genes included Grm8, a presynaptic, putative negative regulator of glutamatergic transmission. Color: fold-change in expression level. Size: percent of cells expressing the TRG in the T3 state. (G) FISH of Robo3 in M2 (left: control; middle: T3; nuclei pseudo-colored by number of puncta, see Figure S4D). Scale bars, 100 μm. Right: Robo3 expression as a function of depth. Robo3 is upregulated by T3 across cortical layers (p < 10−4, Wilcoxon rank-sum test comparing treatment effect across entire cortical depth; control: n = 9,675 cells; T3: n = 16,105; 3 mice per condition). Central line/shade: mean/95% confidence intervals. See also Figure S4.
Figure 3.
Figure 3.. T3-induced transcriptional programs are due to direct T3 action on its receptors
(A) Crystal structure of human THR bound to T3 (PDB: 3GWS). Threonine 337 is highlighted in red; its deletion prevents T3 binding. (B) Schematic of viral strategy. An AAV driving expression of a Cre-dependent DN-THR was transduced broadly. A second self-complementary AAV driving expression of Cre was delivered at low infectious titer to produce mosaic tissue in which only a subset of neurons express Cre and activate expression of DN-THR. (C) Image of cortical hemisphere showing a representative injection with expression of Cre (cyan) labeled by an HA tag, centered on M2, and all neurons labeled by neuronal peri-nuclei (NeuN) (magenta). Scale bar, 1 mm. (D) Magnified images within the injection site, showing Cre-expressing neurons (top: cyan, HA labeled) and all neurons (middle: magenta, NeuN labeled), and their overlay (bottom). We found Cre expressed in 44% of neurons (1,639/3,708 NeuN-labeled cells were also HA positive, from n = 2 animals). Scale bars, 50 μm. (E) Plot showing on the y axis the log2(fold-change) of L2.3.IT TRGs between Cre+ (DN-THR expressing) L2.3.IT cells and Cre− (lacking DN-THR) L2.3.IT cells after T3 treatment. The x axis shows the log2(fold-change) of L2.3.IT TRGs between the T3 and vehicle control conditions from the original dataset (Figure 2). Red dots highlight TRGs whose expression was significantly disrupted due to DN-THR (FDR-adjusted p < 0.05, and fractional change in expression of at least ±25%). Lines/shade: linear regression fit/95% confidence interval. Fit equation and R2 value are displayed. See Figure S4G. (F) As in (E), but for WT-THR expressing tissue. See Figure S4H. (G) As in (E), but for L5.IT neurons and L5.IT TRGs. (H) As in (F), but for L5.IT neurons and L5.IT TRGs. (I) Dot plot of linear regression fits across glutamatergic projection neurons. DN-THR expression disrupted TRG programs, resulting in a large negative slope across cell types. This indicated that normally upregulated TRGs are downregulated by DN-THR, and normally downregulated TRGs are upregulated by DN-THR. By contrast, slopes were near zero and had low R2 for comparisons between WT-THR expressing and lacking cells, indicating that over-expression of the functional receptor does not broadly disrupt TRG programs. Similarly, DN-THR did not disrupt non-TRG expression. See also Figure S4.
Figure 4.
Figure 4.. T3 alters synaptic connectivity of cortical glutamatergic neurons
(A) Top: AAV encoding Cre-dependent CoChR (FLEX-CoChR) was delivered to the upper layers of M2 in one hemisphere, and a retrograde AAV encoding Cre was delivered to the contralateral hemisphere, resulting in CoChR expression in neurons that send projections to contralateral M2. Bottom: whole-cell recordings from contralateral L2/3 pyramidal neurons within the field of CoChR-expressing axons were used to measure PSCs triggered by whole-field optogenetic stimulation. (B) Low-magnification (left; scale bar, 100 μm) and enlarged (right; scale bar, 20 μm) images of a streptavidin-labeled L2/3 pyramidal neuron filled with biocytin (pink) via the recording pipette amidst CoChR-expressing axons (green). (C) Left: example of light-evoked EPSCs. Currents are color coded by the light stimulus intensity. Right: excitatory charge in a post-stimulus 10 ms window normalized by cell capacitance as a function of light stimulus power. Data were fit by a sigmoid (pink) characterized by a saturation amplitude (a), a half-maximum inflection point (b, measure of sensitivity), and the slope (c). (D) Normalized post-synaptic excitatory charge as a function of laser stimulus power for T3 (orange, n = 21 neurons, 8 mice) and vehicle (blue, n = 29 neurons, 10 mice) treated mice. Dots/shade: mean/bootstrapped SEM. (E) Boxplot of changes in sigmoid parameter (from single-cell fits of excitatory charge vs. laser power curves) relative to the median control value. T3-treatment significantly increased the saturation amplitude (a, p = 0.001) and decreased the power to half-maximum (b, p = 0.04), without changing the slope (c, p = 0.10). Central line: median, box: IQ, whiskers: data within 1.5× IQR. (F–H) As in (C)–(E), but for light-evoked IPSCs and normalized inhibitory charge. T3 treatment significantly decreased the power to half-maximum IPSC charge (b, p = 0.005) but did not increase the saturation amplitude (a, p = 0.09) or change the slope (c, p = 0.35). All statistical comparisons: Wilcoxon rank-sum test. *p < 0.05, **p < 0.01. See also Figure S5.
Figure 5.
Figure 5.. T3 alters decision-making and exploration in the 2-armed bandit task
(A) Schematic of the 2ABT. On each trial, one spout is likely to dispense a water droplet (80%), and the other spout is unlikely (20%). A tone (5 kHz) cues the start of the selection period, during which a mouse can make a choice by licking one of the two spouts. The mouse then receives water drops according to its spout choice and reward probabilities. Reward probabilities are dynamic, switching without cue after a block of 20 trials for data presented in (C)–(J), or blocks of 20–40 trials for that in Figures 6C–6I. (B) Raster plot from a 2ABT session (blocks of 20–40 trials) showing individual licks to left (blue) and right (red) spouts as a function of time from start of tone, marking the selection period (black dotted line). Color code (right) indicates the identity of the highly rewarding spout. Gray dotted lines mark block transitions. (C) Percent change in reward rate (rewards/trial) relative to habituation days (Hab.) for T3 (orange) and vehicle (blue) treated mice. The reward rate of each mouse was normalized to the median rate during habituation. Dots indicate the average change in reward rate across mice per day. Lines/shade: linear fits/95% confidence intervals. There was a significant interaction of treatment condition and change in reward rate over the experiment (p = 0.03, likelihood ratio test), and the rate increased with T3 treatment (linear regression, F = 12.42 (1,134), p < 10−3), but was stable with control treatment (linear regression, F < 10−3 (1,139), p = 0.62). Normalized reward rate of T3-treated animals significantly increased on and after 4 days of treatment (day 0: p = 0.21, 1: p = 0.34, 2: p = 0.17, 3: p = 0.32, 4: p = 0.02, 5: p = 0.007, 6: p = 0.001, 7: p = 0.04; likelihood ratio test). (D) Change in probability of selecting the highly rewarding spout, p(High), between the habituation period and treatment days 4–7 calculated as the differences of median values. Black dots: single mice. T3-treated mice significantly increased p(High) (p = 0.02), whereas vehicle-treated mice did not (p = 0.55). Paired t tests. (E) p(High) as a function of trial position within a block for vehicle-treated mice during habituation (gray) or treatment days 4–7 (blue). Trial 0 marks the first trial of a new block. Shading: 95% confidence intervals. (F) As in (E) but for T3-treated mice (treatment days 4–7, orange). (G) Change in the time constant (τ) from exponential fits to p(High) after the block transition between habituation and treatment days 4–7. Black dots: single mice. T3-treated mice had a significant decline in τ (p = 0.02); vehicle-treated mice did not (p = 0.93). Paired t tests. (H) Change in conditional switch probabilities, dependent on reward outcomes of the previous 2 trials, between habituation and treatment days 4–7. The 4 most common histories are plotted, which resulted from selecting the same spout on two consecutive trials with varying reward outcomes, represented by a water droplet (reward) or red X (no reward). T3-treated mice increased their probability of switching spouts in response to two consecutive failures (p-adjusted = 0.02). No other conditional switch probabilities changed (p-adjusted > 0.05). Paired t tests with Benjamini-Hochberg correction. (I) Q-learning model predictions on held-out data of p(High) around block transitions from habituation (top) and days 4–7 (bottom). Gray line is mean probability from the mouse data (T3 cohort); green line is the model prediction. Shading: 95% confidence intervals. The model fit the data well for all treatments and epochs (for T3 cohort, spout-choice prediction accuracy on held-out data during habituation: 0.85 ± 0.03, mean ± SD; days 4–7: 0.85 ± 0.03; comparison between epochs: p = 0.52; for control cohort, spout-choice prediction accuracy on held-out data during habituation: 0.85 ± 0.03; days 4–7: 0.86 ± 0.03; comparison between epochs: p = 0.64; paired t tests). (J) Scatterplot of β parameter fits during habituation (x axis) and days 4–7 of treatment (y axis) for each animal. T3-treated mice had a significant decrease in β between habituation and days 4–7 (p = 0.008), whereas vehicle-treated mice did not (p = 0.69). Paired t test. For all analyses, n = 12 animals for each treatment condition (T3 or control). *p < 0.05, **p < 0.01. For all boxplots, central line: median, box: IQ, whiskers: data within 1.5× IQR. See also Figure S6.
Figure 6.
Figure 6.. T3-dependent transcriptional cascades in frontal cortex neurons underlie T3 mediated changes in exploratory decision-making
(A) Average heatmaps of DN-THR expression in the cohort of mice performing the 2ABT. Scale bars, 1 mm. Left: coronal section ~2 mm anterior to bregma. Right: sagittal section ~1 mm from midline. An extended selection of heatmaps of both DN-THR and WT-THR animals is in Figure S6M. (B) Bar plot of the normalized count of WT-THR (orange) and DN-THR (purple) cells across brain regions. Brain region expression was similar between WT-THR and DN-THR cohorts (Table S4). Bar/error bar: mean/SEM. (C) The percent change in reward rate (rewards/trial) over habituation and treatment. All habituation days are grouped (Hab.), and the reward rate of each mouse was normalized to the median rate during habituation. Dots indicate the average change in reward rate per day for WT-THR (orange) and DN-THR (purple) animals. Both cohorts received T3. Lines/shade: linear fits/95% confidence intervals. There was a significant interaction of genotype (WT-THR/DN-THR) and treatment duration (p < 10−3, likelihood ratio test). WT-THR animals increased their reward rate with T3 treatment (linear regression, F = 14.14 (1,154), p < 10−3), while DN-THR animals did not (linear regression, F = 1.11 (1,166), p = 0.29). (D) Change in p(High) between the habituation period and treatment days 4–7 calculated as the difference of median values from each period. WT-THR mice significantly increased p(High) (p = 0.001), DN-THR mice did not (p = 0.54). Paired t tests. (E) p(High) for WT-THR animals as a function of trial position within a block. Orange line: mean probabilities over days 4–7. Gray line: mean probabilities over habituation days. Shading: 95% confidence intervals. (F) As in (E) but for DN-THR animals (treatment days 4–7, purple). (G) Change in time constant (τ) of recovery of p(High) from exponential fits of the data (aligned to the block transition) between the habituation period and days 4–7. WT-THR mice had a significant decline in τ (p = 0.009), DN-THR mice did not (p = 0.35). Paired t tests. (H) Change in conditional switch probabilities between the habituation period and days 4–7 (as in Figure 5H). WT-THR mice increased their probability of switching spouts in response to two consecutive failures (p-adjusted < 10−3); DN-THR did not (p-adjusted = 0.40). No other conditional switch probabilities changed (p-adjusted > 0.05). Paired t tests with Benjamini-Hochberg correction. (I) Scatterplot of β parameter fits during habituation (x axis) and treatment days 4–7 (y axis) for each animal. WT-THR mice significantly decrease β between habituation and days 4–7 (p = 0.007); DN-THR mice did not (p = 0.28). Paired t tests. For post hoc histology and quantification in (A) and (B), WT-THR cohort: n = 12 animals, DN-THR cohort: n = 10 animals. For all other analyses, WT-THR cohort: n = 13 animals, DN-THR cohort: n = 14 animals. **p < 0.01, ***p < 0.001. Black dots represent data from single mice. For all boxplots, central line: median, box: IQ, whiskers: data within 1.5× IQR. See also Figure S6.

Update of

References

    1. Siers SR, Yackel Adams AA, and Reed RN (2018). Behavioral differences following ingestion of large meals and consequences for management of a harmful invasive snake: A field experiment. Ecol. Evol. 8, 10075–10093. 10.1002/ece3.4480. - DOI - PMC - PubMed
    1. Mohr SM, Bagriantsev SN, and Gracheva EO (2020). Cellular, molecular, and physiological adaptations of hibernation: the solution to environmental challenges. Annu. Rev. Cell Dev. Biol. 36, 315–338. 10.1146/annurev-cellbio-012820-095945. - DOI - PubMed
    1. Baile CA, Della-Fera MA, and Martin RJ (2000). Regulation of metabolism and body fat mass by leptin. Annu. Rev. Nutr. 20, 105–127. 10.1146/annurev.nutr.20.1.105. - DOI - PubMed
    1. Obradovic M, Sudar-Milovanovic E, Soskic S, Essack M, Arya S, Stewart AJ, Gojobori T, and Isenovic ER (2021). Leptin and obesity: role and clinical implication. Front. Endocrinol. 12, 585887. 10.3389/fendo.2021.585887. - DOI - PMC - PubMed
    1. Padamsey Z, Katsanevaki D, Dupuy N, and Rochefort NL (2022). Neocortex saves energy by reducing coding precision during food scarcity. Neuron 110, 280–296.e10. 10.1016/j.neuron.2021.10.024. - DOI - PMC - PubMed

Substances