. 2024 Sep 17;5(9):101697.
doi: 10.1016/j.xcrm.2024.101697. Epub 2024 Aug 22.

Next-generation lung cancer pathology: Development and validation of diagnostic and prognostic algorithms

Affiliations

Next-generation lung cancer pathology: Development and validation of diagnostic and prognostic algorithms

Carina Kludt et al. Cell Rep Med. .

Abstract

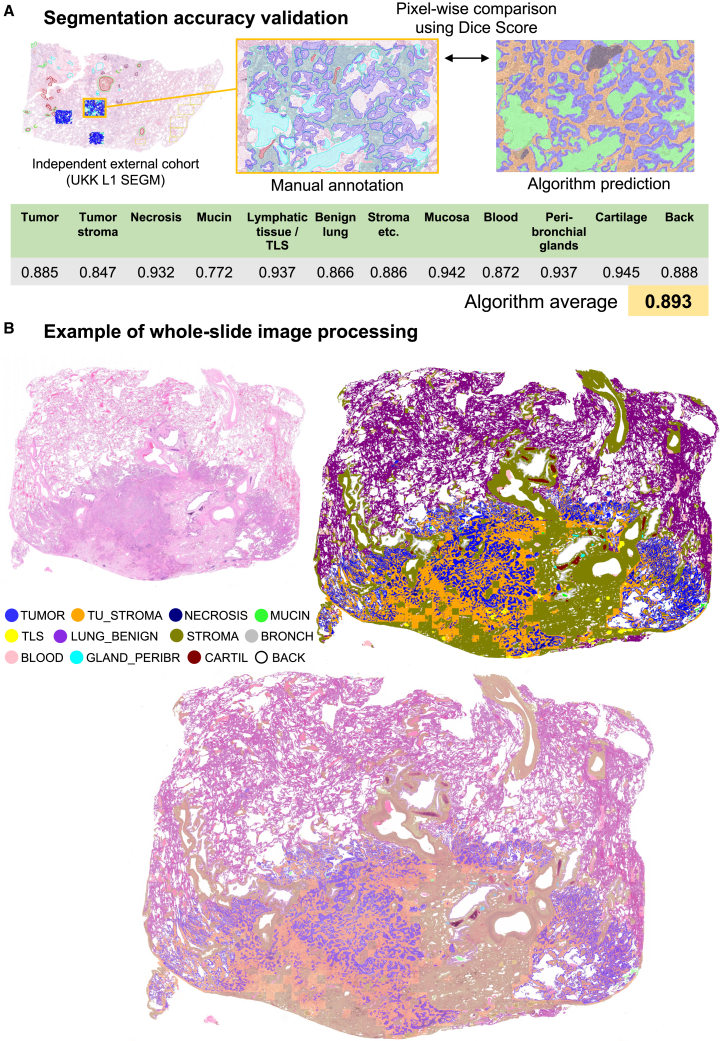
Non-small cell lung cancer (NSCLC) is one of the most common malignant tumors. In this study, we develop a clinically useful computational pathology platform for NSCLC that can be a foundation for multiple downstream applications and provide immediate value for patient care optimization and individualization. We train the primary multi-class tissue segmentation algorithm on a substantial, high-quality, manually annotated dataset of whole-slide images with lung adenocarcinoma and squamous cell carcinomas. We investigate two downstream applications. NSCLC subtyping algorithm is trained and validated using a large, multi-institutional (n = 6), multi-scanner (n = 5), international cohort of NSCLC cases (slides/patients 4,097/1,527). Moreover, we develop four AI-derived, fully explainable, quantitative, prognostic parameters (based on tertiary lymphoid structure and necrosis assessment) and validate them for different clinical endpoints. The computational platform enables the high-precision, quantitative analysis of H&E-stained slides. The developed prognostic parameters facilitate robust and independent risk stratification of patients with NSCLC.

Keywords: AI; NSCLC; algorithm; lung cancer; prognosis; subtyping.


Conflict of interest statement

Declaration of interests The authors declare no competing interests.

Figures

None
Graphical abstract
Figure 1
Figure 1
Development of computational platform for non-small cell lung cancer (A) Types of lung cancer specimens and principles of processing in pathology department. Digital pathology allows for diagnostic sign out of cases on the computer monitor and broad application of supportive AI-based tools for automatized slide analysis. (B) Training and external test study cohorts. The slides that were manually annotated and used for development of pixel-wise segmentation algorithms (main algorithm for tissue segmentation and subtyping algorithm) are outlined in “Training cohorts” as MAIN and SUBTYPE, respectively. UKK L1 SEGM is a manually annotated dataset that was used for formal validation of segmentation accuracy. Further datasets were used for validation of non-small cell lung cancer (NSCLC) subtyping algorithm (at slide level). Abbreviations: MAIN, main dataset for multi-class tissue segmentation algorithm; SUBTYPE, NSCLC subtyping algorithm dataset; LUAD, lung adenocarcinoma; LUSC, lung squamous cell carcinoma; Magn, magnification; Scanner, Le – Leica Aperio; Ham, Hamamatsu Nanozoomer; 3D Hist, 3D Histech; UKK, University Hospital Cologne; AAC, University Hospital Aachen; WNS, Hospital Wiener Neustadt; KAM, Kameda Medical Hospital; ESS, University Hospital Essen; CPTAC, Clinical Proteomic Tumor Analysis Consortium cohort. ∗ 107 slide were fully annotated as shown in (D), 61 slide were additionally annotated for underrepresented tissue classes; # most of the slides were 40x; some of the slides were scanned under 20x magnification. (C) The main segmentation algorithm was developed using a high-quality large manually annotated dataset. This can be used for quick, primary processing of the whole-slide images and creation of precise, fully quantitative tissue maps. These allow a multiple number of downstream applications, diagnostic (e.g., subtyping) or prognostic/predictive. (D) Principles of high-precision, extensive manual annotations with representative examples of 11 tissue classes are presented. The figure was prepared with BioRender. See also Table S1.
Figure 2
Figure 2
Validation of multi-class tissue segmentation accuracy and example of WSI processing by the backbone algorithm of platform (A) Segmentation accuracy was tested using an external cohort. Forty whole-slide images (patients n = 40) representative of the broad spectrum of morphologies and histological grades were extensively manually annotated (LUAD n = 20, LUSC n = 20). Dice metrics (intersection of annotated and predicted regions, with score = 1.0 representing ideal quality of segmentation) were calculated for each tissue class representing excellent quality of segmentation. Most inaccuracies were related not to the obvious false positive/false negative results but to a pixel-level variations of the “perceived” borders of the different tissue structures that are not relevant. (B) Example of processing of whole-slide image of lung adenocarcinoma (KAM RES cohort) showing original image, segmentation mask produced by algorithm, and overlay of the mask on the original image. Fully quantitative and precise “decoding” of image is possible with algorithm that can be used for further downstream applications. Class abbreviations: TUMOR, epithelial tumor component; TU_STROMA, tumor stroma; NECROSIS, necrotic debris; MUCIN, mucin; TLS, lymphatic tissue/tertiary lymphoid structures; LUNG_BENIGN, tumor-free lung parenchyma; STROMA, non-tumor-associated stroma, fat, vessels, and muscle tissue; BRONCH, bronchial mucosa; BLOOD, areas of bleeding or erythrocytes; GLAND_PERIBR, peribronchial mucous glands; CARTIL, cartilage; BACK, slide background.
Figure 3
Figure 3
Examples of platform application to resection and biopsy cases (A–F) Resection cases (A, C, and E) and corresponding overlays with multi-class tissue mask (B, D, and F). Cases (A) and (C) are from Wiener Neustadt (WNS) RES cohort; (E) UKK L1 RES cohort (note artificial changes∗ that are processed correctly by the algorithm). Resection cases are less challenging as they normally have much fewer tissue-processing artifacts (mechanical artifacts). (G–L) Biopsy cases (G, I, and K) and corresponding overlays produced by algorithm (H, J, and L). All cases are from WNS BX cohort. Naturally, biopsy samples are a very difficult material due to high levels of artificial changes; however, the segmentation quality for tumor tissue was estimated as excellent by participating pathologists, allowing usage of the platform on biopsy material as well. Uniformly excellent quality independent of cohort was evident in resection specimen cohorts, as estimated visually by participating expert pathologists. (M) Developed computational platform, optionally connected to single-cell detection/classification algorithms (available open-source), can be used for a large number of downstream applications. Examples of potential downstream applications are provided.
Figure 4
Figure 4
Development and evaluation of diagnostic downstream algorithm for NSCLC subtyping (A) The modus operandi of the subtyping algorithm includes analysis of tumor regions and epithelial tumor component detected by a platform’s backbone multi-class tissue segmentation algorithm. Precise mapping of glandular and squamous features is available for explainability to pathologists. Also precise quantifications of features are provided with resulting slide-level classification of tumor as adenocarcinoma or squamous cell carcinoma. Mucin is detected in form of intraglandular component or mucin lakes with quantification of mucin area within tumor that allows easy identification of mucinous and colloid adenocarcinoma subtype by pathologists. In case of multiple slides, metrics are provided per slide and per case. (B) Clinical validation of subtyping algorithm using large multi-institutional cohort of resection cases digitized by five most common scanning systems (institutes n = 6, patients n = 1,384, slides n = 3,787 including LUAD/LUSC 2,521/1,266). Slide-level classification is provided in confusion tables (with case level for misclassified slides). (C) Subtyping accuracy metrics at slide level for single cohorts. Abbreviations: ACC, overall accuracy; F1, F1 score; SENS, sensitivity; SPEC, specificity; Ad, Adenocarcinoma; SqCC, squamous cell carcinoma. (D) Analysis of per-slide area probability distributions (% area classified as LUAD or LUSC; the largest UKK L1 RES cohort of patients). Only single slides show borderline probabilities around 50% (40%–60%) while most cases are classified as a subtype with high levels of certainty. Most cases with borderline probabilities represent challenging cases (poorly differentiated solid carcinomas) which are not solvable without additional immunohistochemistry studies. Such cases are additionally investigated (Figures 5D–5F) with inclusion of five expert pathologists. See also Figures S1–S12.
Figure 5
Figure 5
Clinical validation of subtyping algorithm in biopsy cases and detailed investigation of “challenging” cases (A) Clinical validation of subtyping algorithm using two cohorts of biopsy cases digitized by two different scanning systems (slide n = 310 [LUAD/LUSC 202/108], patients n = 143). Slide-level classification is provided in confusion tables (with case level for misclassified slides). (B) Subtyping accuracy metrics at slide level for single cohorts. Abbreviations: ACC, overall accuracy; F1 – F1 score; SENS, sensitivity; SPEC, specificity; Ad, adenocarcinoma; SqCC, squamous cell carcinoma. (C) Example of algorithm processing of the biopsy case with visual outputs and quantitative metrics for classification of the case. Same color coding as in Figure 2B. (D) Two cohorts of “challenging” cases (cases misclassified by algorithm and borderline cases), resection and biopsy, were created. These cases were evaluated by five expert pathologists (P1–P5). (E) The results of subtyping by pathologists separately for resection (RES) and biopsy cohorts (BX) are shown with ground-truth classification result from pathology report (including immunohistochemistry evaluation) and AI tool prediction. Note that the cases were intentionally selected that were misclassified by the AI tool. High levels of deviation from the ground truth and interobserver variability were evident for all pathologists (P1–P5) implying that these cases could be only resolved reliable with a help of immunohistochemistry. Confusion table with simple agreement levels is provided on the right side, separately for RES and BX cohorts. (F) Examples of the most challenging cases with subtyping results provided by pathologists, AI tool, and ground truth (GT, immunohistochemistry).
Figure 6
Figure 6
Development of AI-based, quantitative prognostic parameters (A) AI-based quantification of tertiary lymphoid structure (TLS) density. Three lung cancer cases are shown with yellow regions corresponding to detected TLS objects. Other colors as in Figure 2B. (B) AI-based quantification of intratumoral necrosis density. Three lung cancer cases are shown with navy blue regions corresponding to detected necrosis regions. Other colors as in Figure 2B. (C) Principle of quantification for four new prognostic parameters: TLS tumor density (TLS-TD), necrosis tumor density (NECR-TD), TLS/necrosis ratio (T/NR), and cumulative score with three prognostic group based on combination of TLS-TD and NECR-TD. T/NR and cumulative scores are compound parameters based on TLS and NECR quantification in the tumor. The parameters are fully explainable and do not involve any “black box” features from deep learning algorithm. The parameters TLS-TD, NECR-TD, and T/NR are dichotomized using identified optimal cutoff to derive prognostic subgroups. (D) Distribution of TLS-TD, NECR-TD, and T/NR values among LUAD and LUSC cases of the prognostic test cohort. In each plot each measurement is a case-level value of the corresponding parameter. ∗ TLS-TD for LUAD/LUSC and NECR-TD for LUSC are linearly upscaled using x1,000 multiplication (NECR-TD for LUSC using x100) for easiness of perception. Red arrows represent identified best risk stratification cutoffs for corresponding parameters used later for prognostic analyses (Figure 7). See also Tables S2–S7.
Figure 7
Figure 7
Evaluation of prognostic role of AI-based prognostic parameters for cancer-specific and progression-free survival endpoints (A–H) Lung adenocarcinoma cohort: (A and E) TLS-TD, (B and F) NECR-TD, (C and G) T/NR, (D and H) [T + NR]. (I–P) Lung squamous cell carcinoma cohort: (I and M) TLS-TD, (J and N) NECR-TD, (K and O) T/NR, (L and P) [T + NR]. The parameters TLS-TD, NECR-TD, and T/NR are dichotomized using identified optimal cutoff to derive prognostic subgroups (same cutoff for all prognostic endpoints). (Q–X) Results of univariate and multivariate Cox proportional hazard model analysis for new prognostic parameters concerning cancer-specific survival (CSS) and progression-free survival (PFS). All parameters show independent prognostic value in multivariate analysis including common prognostic variables. (Q–T) Lung adenocarcinoma cohort. (U–X) Lung squamous cell carcinoma cohort. Comment: all multivariate models always include pT and pN classification of the tumor and one prognostic parameter; therefore, one plot shows several multivariate models, one for each of prognostic parameter for easiness of visualization. The analyzed parameter is included in frame. Plots show hazard ratios (HRs) and 95% confidence interval (95% CI). #p value 0.05–0.1 (statistical trend), ∗p value 0.01–0.05, ∗∗p value 0.001–0.01, ∗∗∗p value < 0.001. Detailed information to univariate and multivariate Cox analysis is provided in Tables S2–S7. See also Figure S13.

References

    1. Siegel R.L., Miller K.D., Wagle N.S., Jemal A. Cancer statistics, 2023. CA. Cancer J. Clin. 2023;73:17–48. - PubMed
    1. Zhang Y., Vaccarella S., Morgan E., Li M., Etxeberria J., Chokunonga E., Manraj S.S., Kamate B., Omonisi A., Bray F. Global variations in lung cancer incidence by histological subtype in 2020: a population-based study. Lancet Oncol. 2023;24:1206–1218. - PubMed
    1. Bera K., Schalper K.A., Rimm D.L., Velcheti V., Madabhushi A. Artificial intelligence in digital pathology — new tools for diagnosis and precision oncology. Nat. Rev. Clin. Oncol. 2019;16:703–715. doi: 10.1038/s41571-019-0252-y. - DOI - PMC - PubMed
    1. Echle A., Rindtorff N.T., Brinker T.J., Luedde T., Pearson A.T., Kather J.N. Deep learning in cancer pathology: a new generation of clinical biomarkers. Br. J. Cancer. 2021;124:686–696. - PMC - PubMed
    1. El Nahhas O.S.M., Loeffler C.M.L., Carrero Z.I., van Treeck M., Kolbinger F.R., Hewitt K.J., Muti H.S., Graziani M., Zeng Q., Calderaro J., et al. Regression-based Deep-Learning predicts molecular biomarkers from pathology slides. Nat. Commun. 2024;15 doi: 10.1038/S41467-024-45589-1. - DOI - PMC - PubMed

Publication types