. 2024 Sep 5;84(17):3271-3287.e8.
doi: 10.1016/j.molcel.2024.08.006. Epub 2024 Aug 22.

Histone chaperone HIRA, promyelocytic leukemia protein, and p62/SQSTM1 coordinate to regulate inflammation during cell senescence

Affiliations

Histone chaperone HIRA, promyelocytic leukemia protein, and p62/SQSTM1 coordinate to regulate inflammation during cell senescence

Nirmalya Dasgupta et al. Mol Cell. .

Abstract

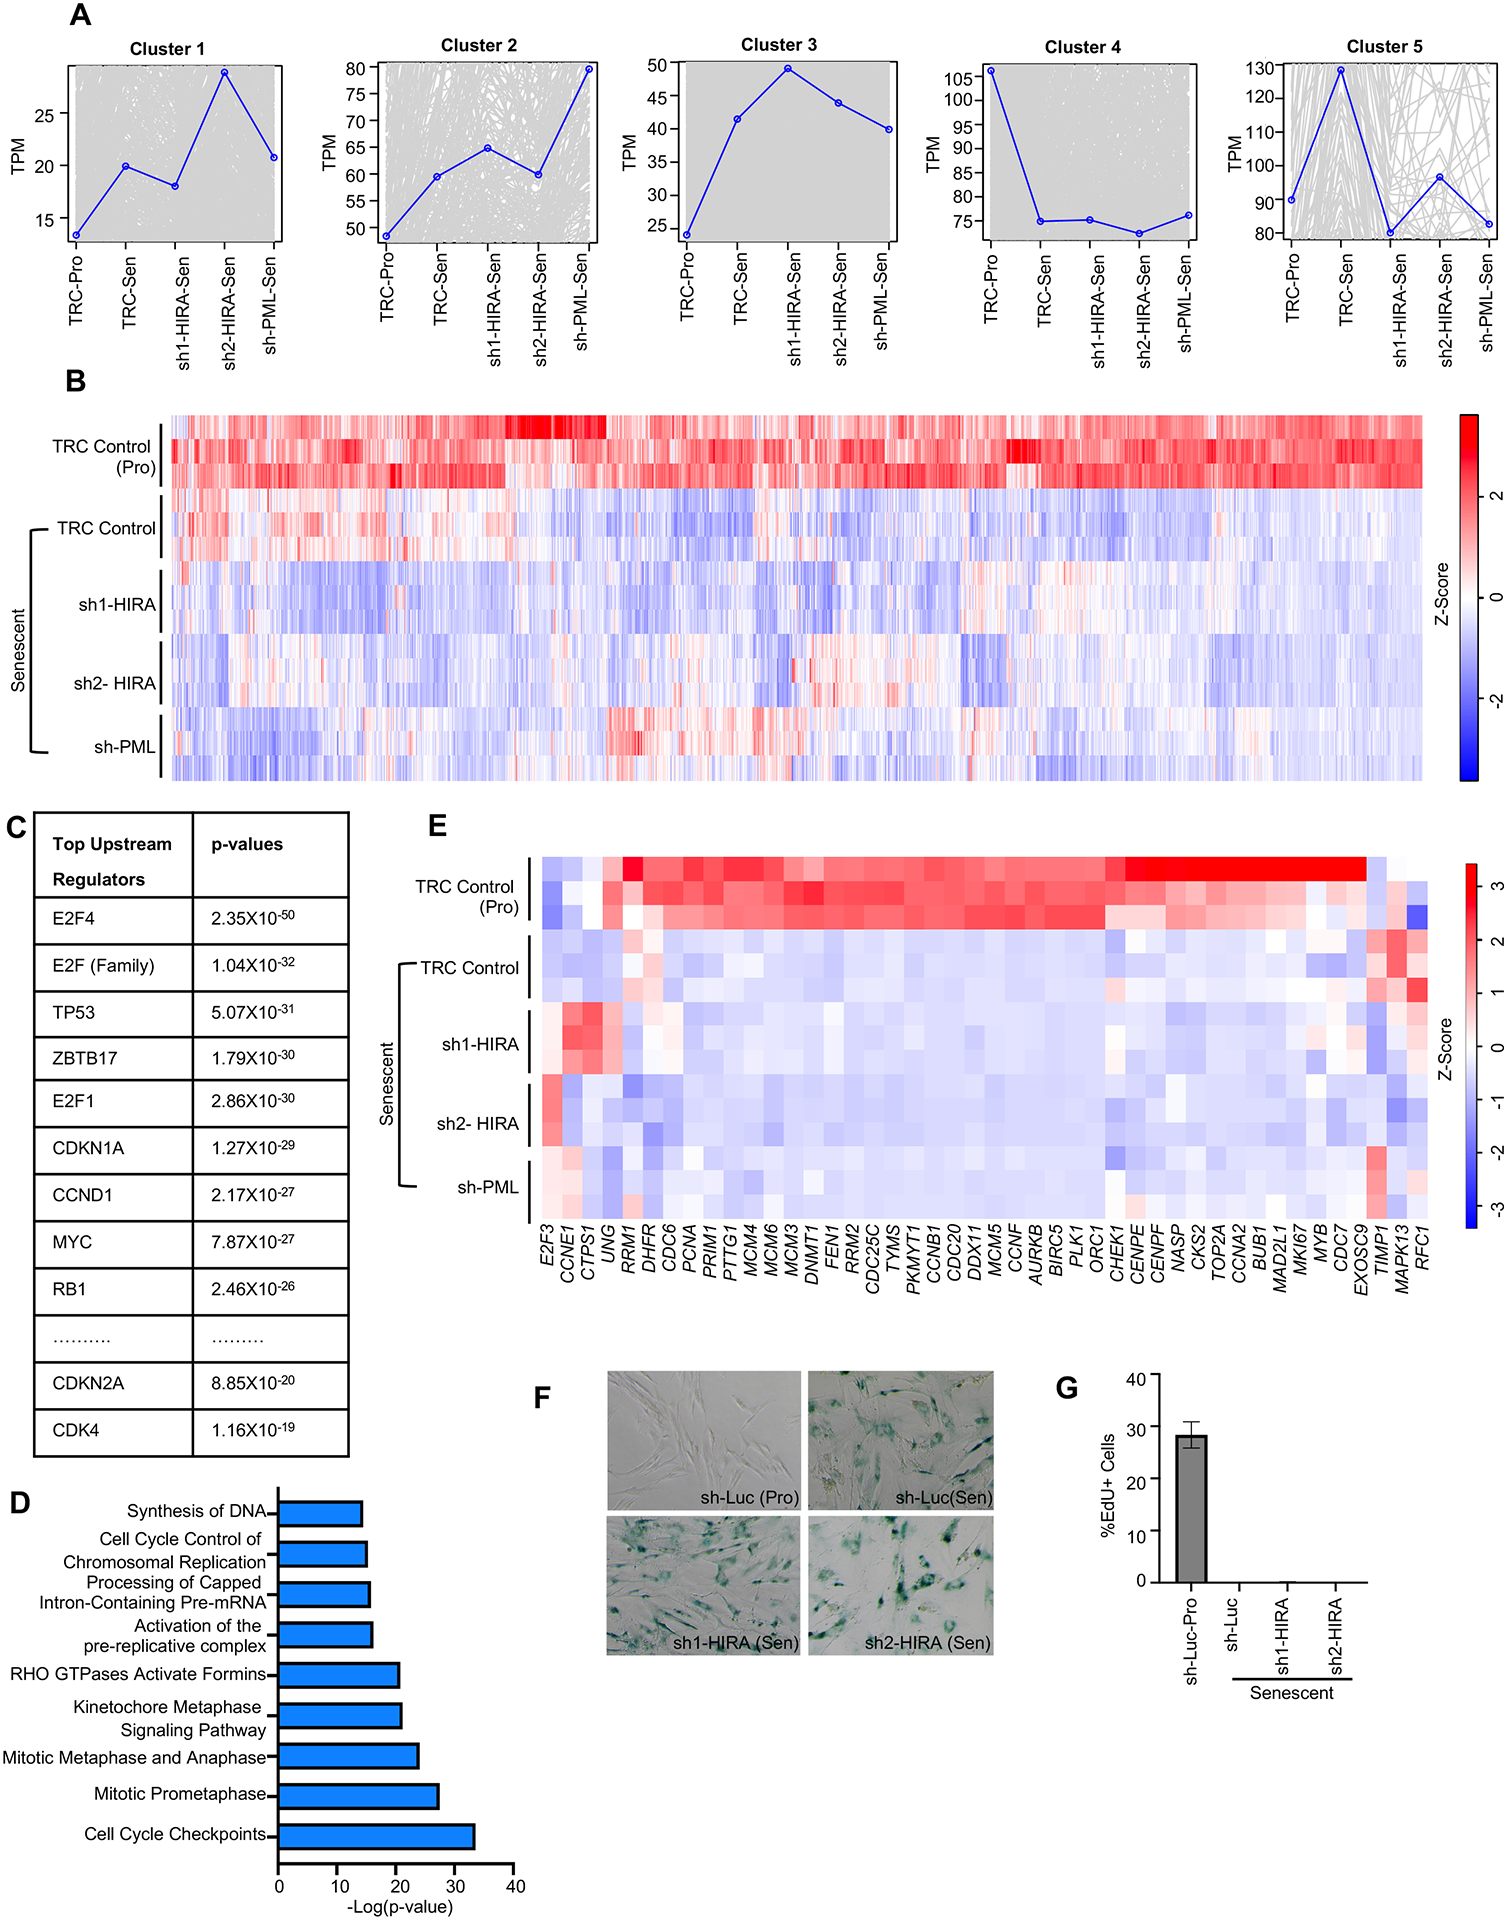
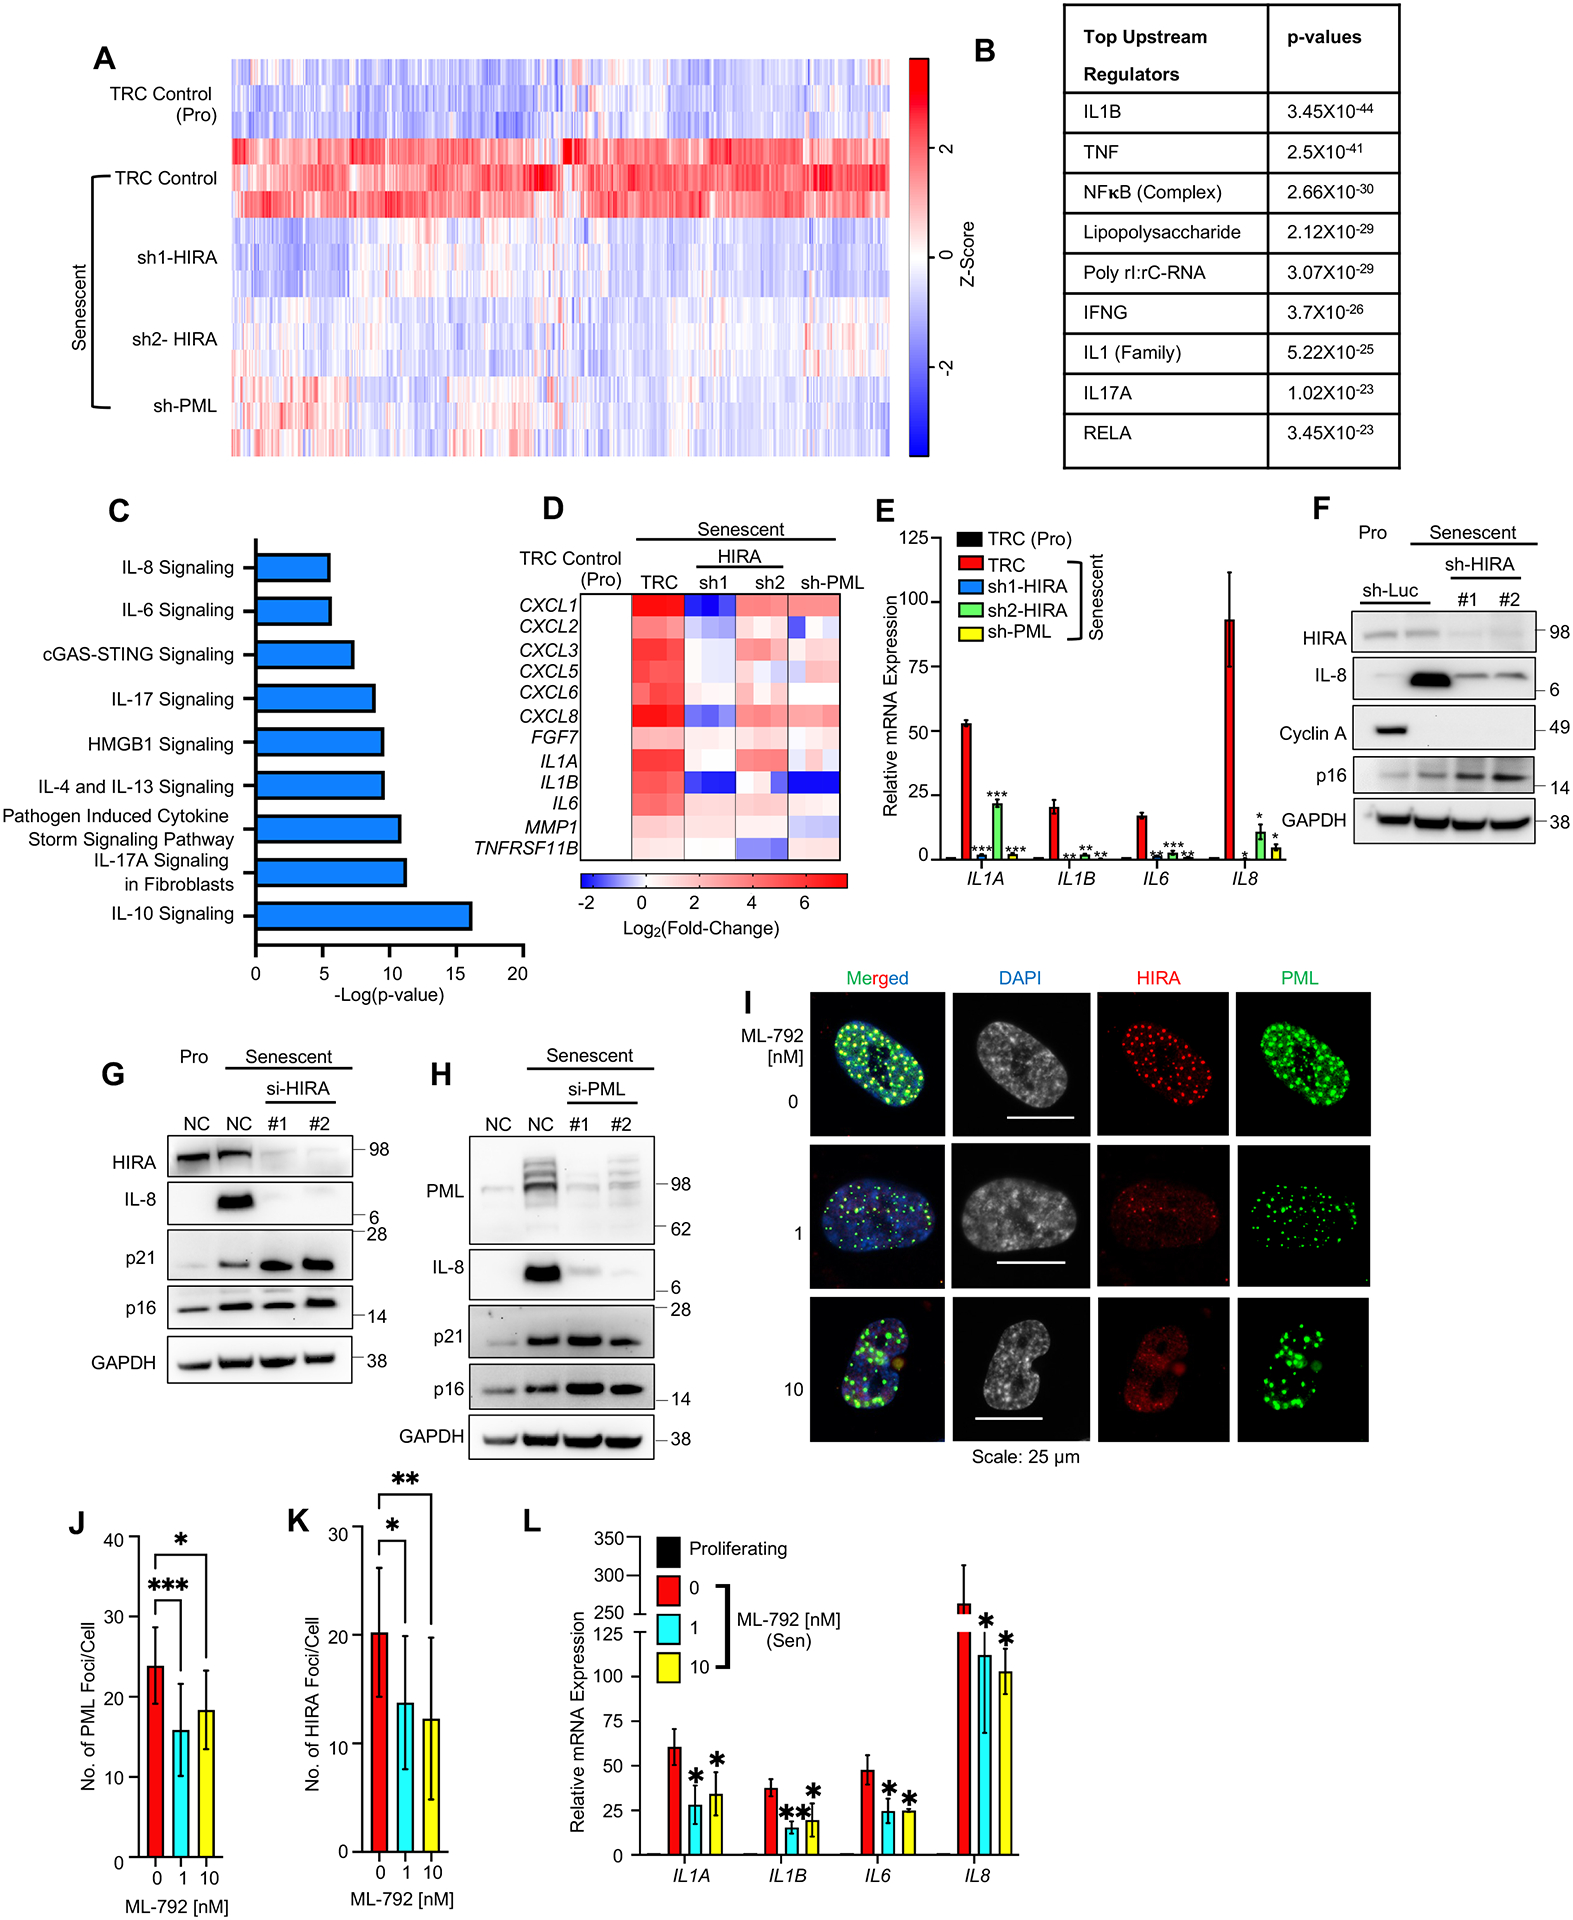
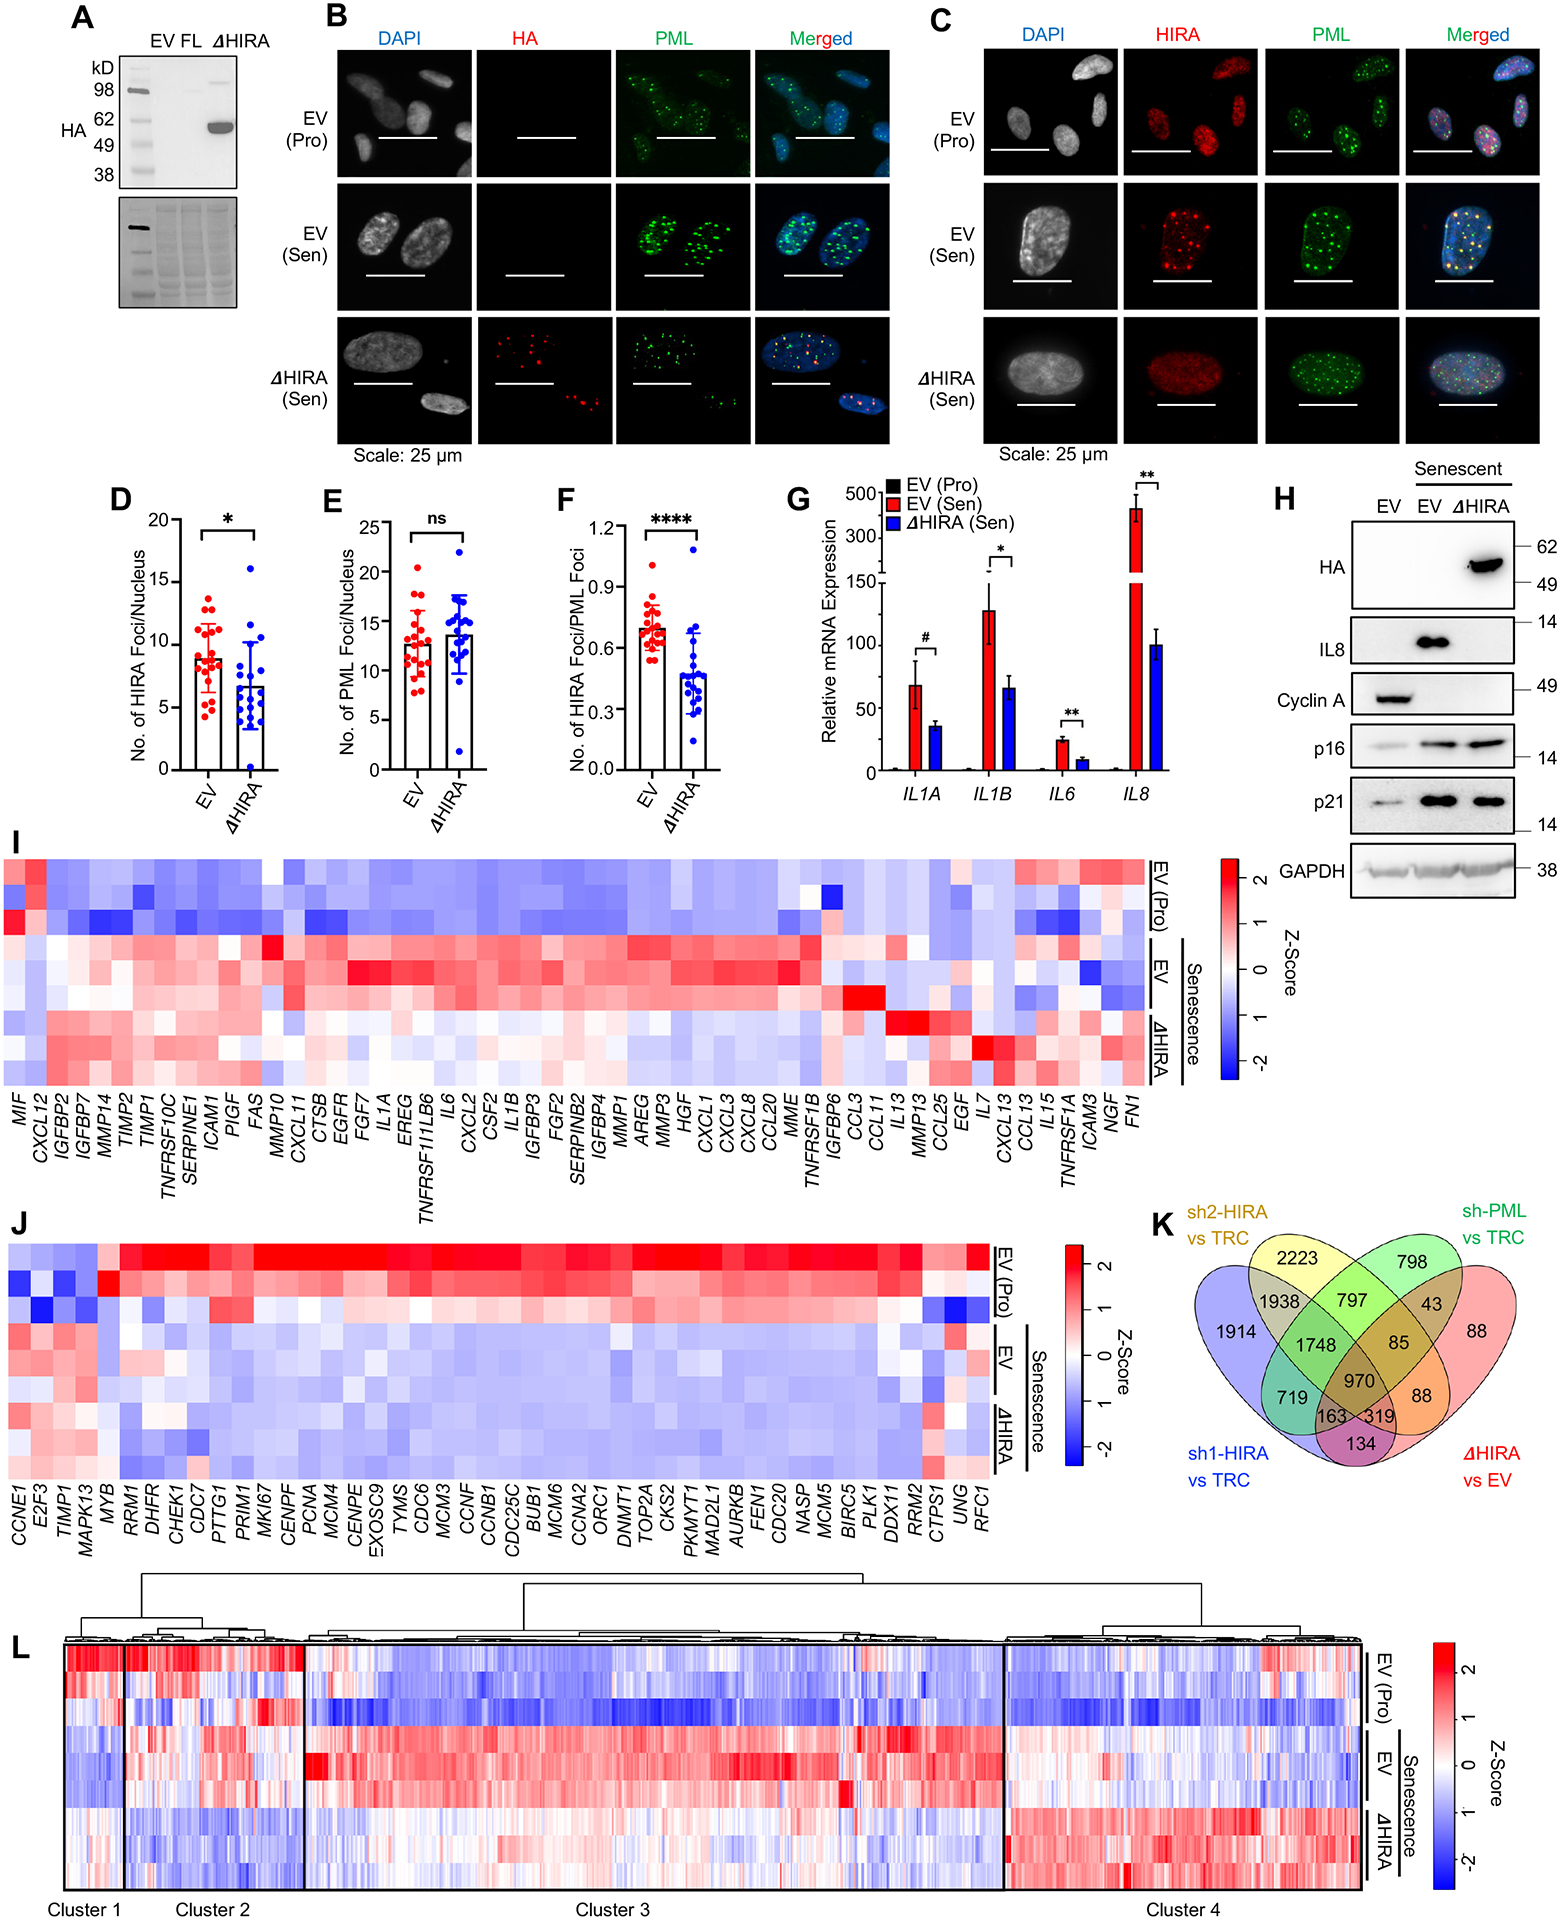
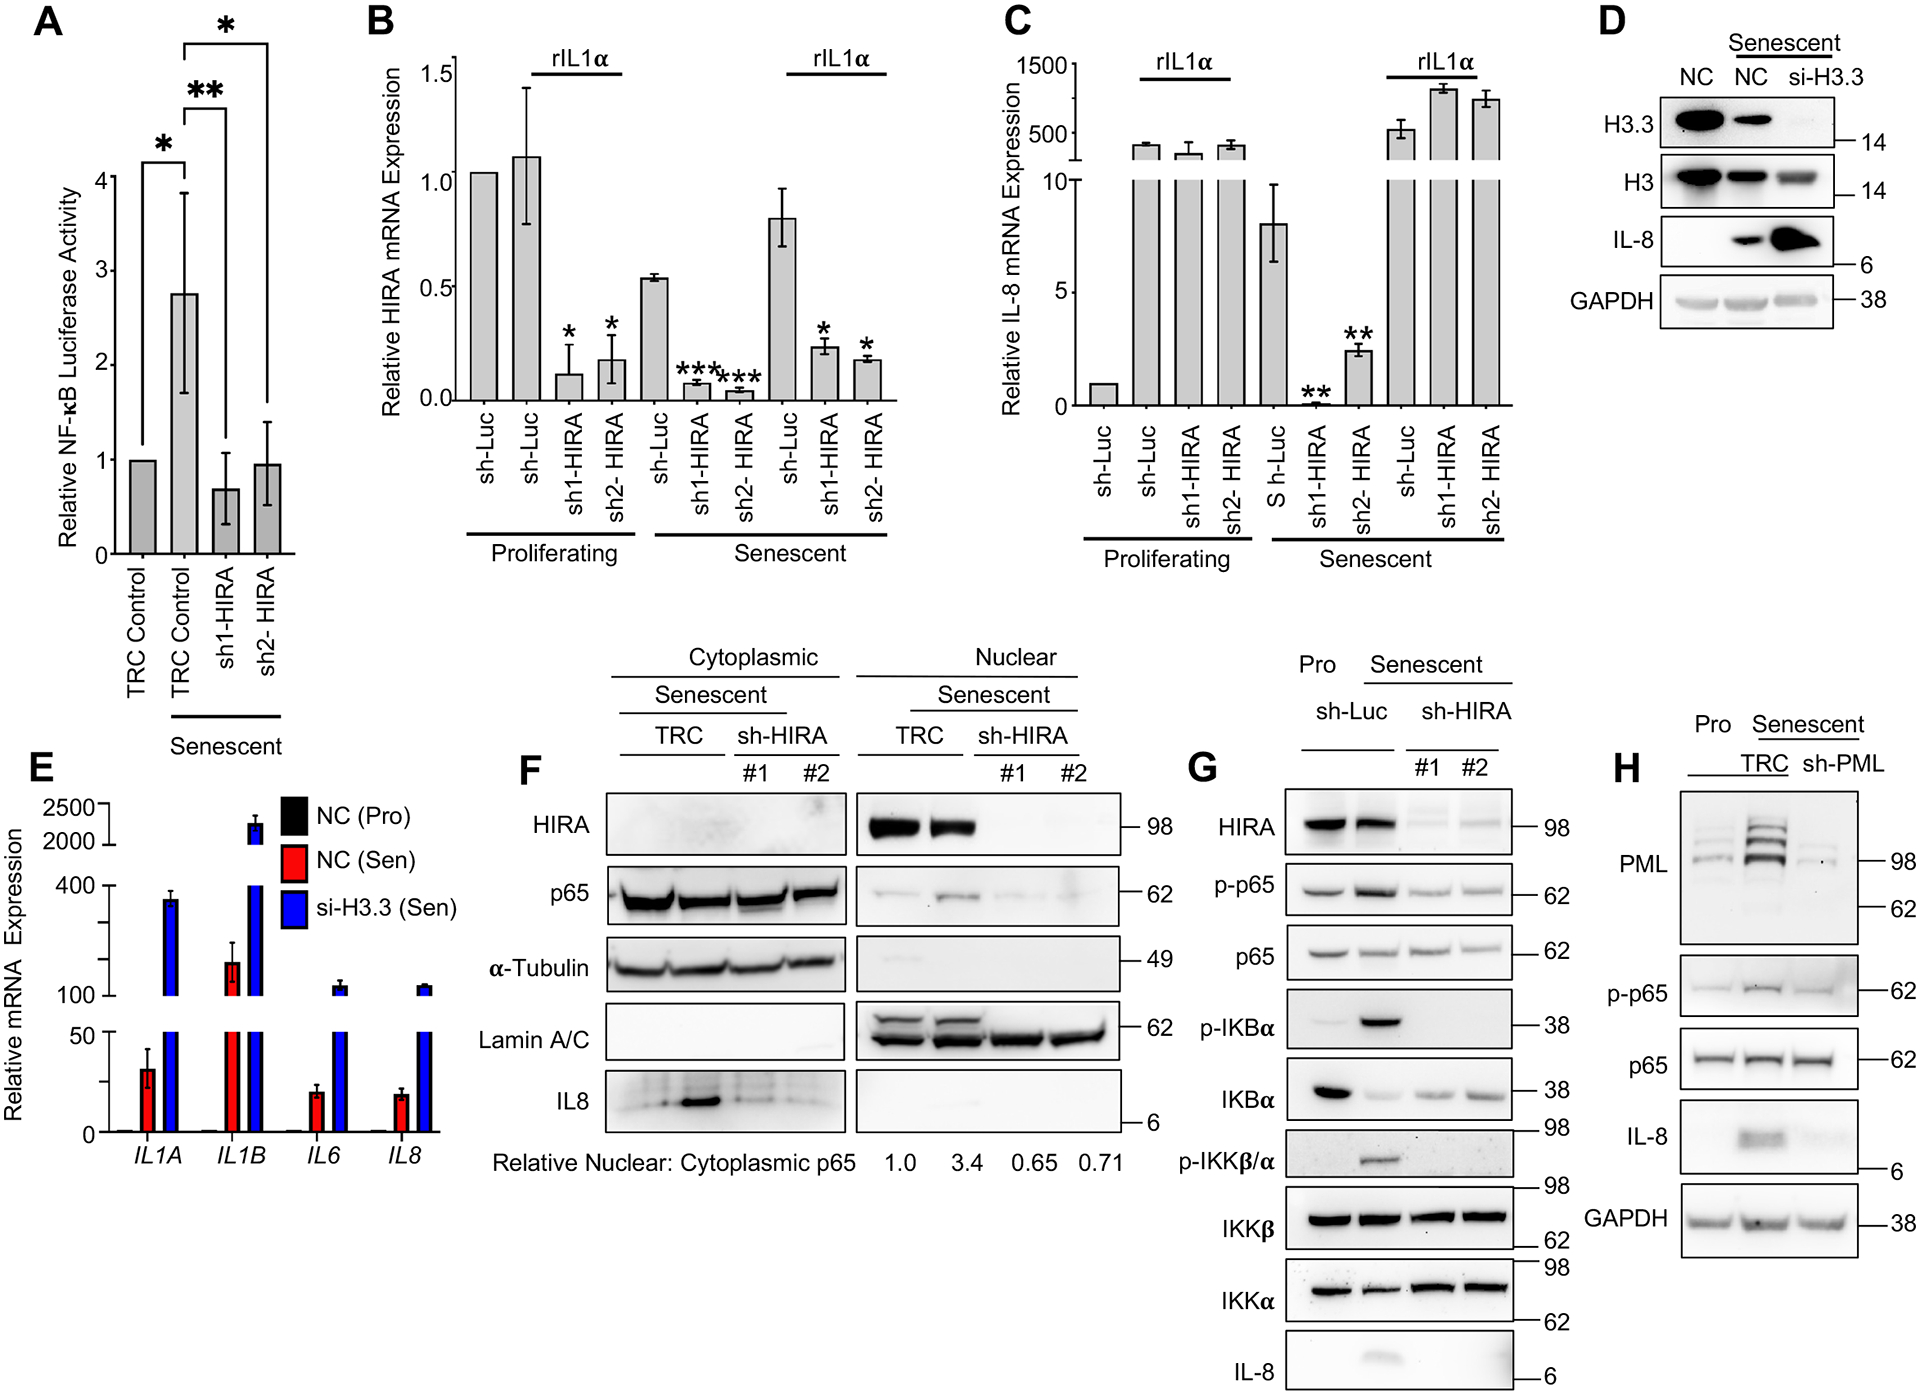
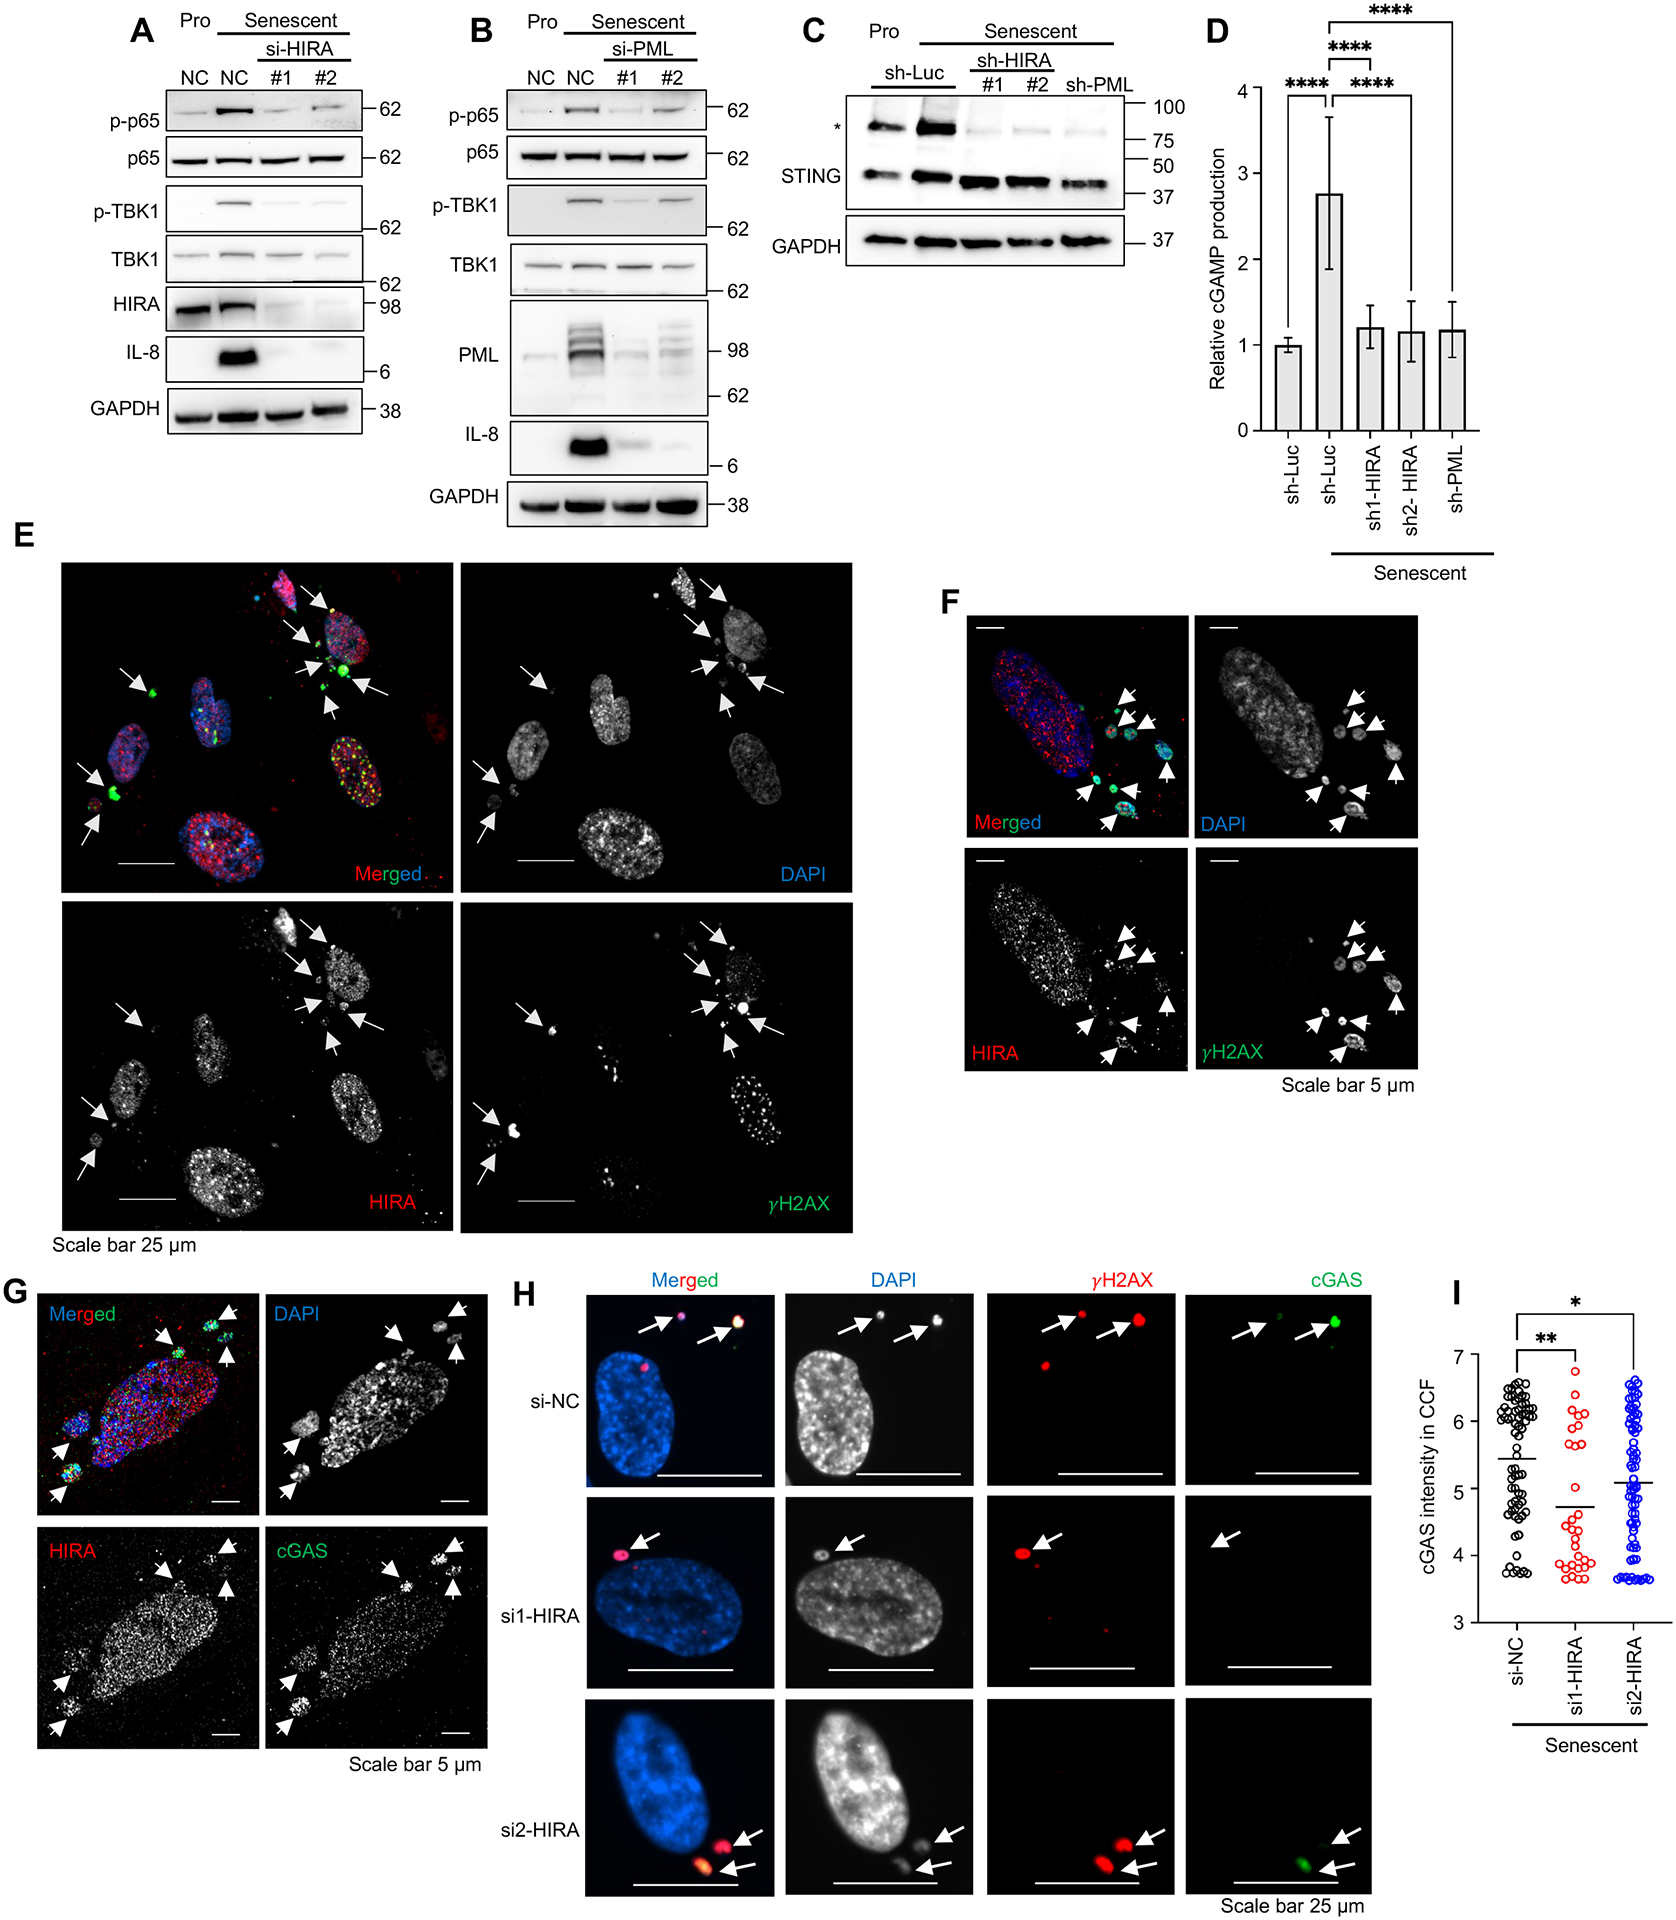
Cellular senescence, a stress-induced stable proliferation arrest associated with an inflammatory senescence-associated secretory phenotype (SASP), is a cause of aging. In senescent cells, cytoplasmic chromatin fragments (CCFs) activate SASP via the anti-viral cGAS/STING pathway. Promyelocytic leukemia (PML) protein organizes PML nuclear bodies (NBs), which are also involved in senescence and anti-viral immunity. The HIRA histone H3.3 chaperone localizes to PML NBs in senescent cells. Here, we show that HIRA and PML are essential for SASP expression, tightly linked to HIRA's localization to PML NBs. Inactivation of HIRA does not directly block expression of nuclear factor κB (NF-κB) target genes. Instead, an H3.3-independent HIRA function activates SASP through a CCF-cGAS-STING-TBK1-NF-κB pathway. HIRA physically interacts with p62/SQSTM1, an autophagy regulator and negative SASP regulator. HIRA and p62 co-localize in PML NBs, linked to their antagonistic regulation of SASP, with PML NBs controlling their spatial configuration. These results outline a role for HIRA and PML in the regulation of SASP.

Keywords: CCF; HIRA; NF-κB pathway; PML; PML NBs; SASP; cGAS-STING signaling; p62/SQSTM; senescence.


Conflict of interest statement

Declaration of interests The authors declare no competing interests.

Figures

Figure 1:
Figure 1:. HIRA and PML are not essential for senescence-associated proliferation arrest.
Senescence was induced in IMR-90 cells using 50 μM Etoposide for 24 hours. Cells were harvested for RNA-seq analysis 7 days post-treatment. (A) Clustering analysis of RNA-seq data reveals distinct gene expression patterns in five different clusters. (B) Heatmap of RNA-seq analysis showing the expression of Cluster 4 genes. (C) Gene ontology analysis by IPA identifies top upstream regulators in Cluster 4. (D) Ingenuity Pathway Analysis (IPA) of Cluster 4 genes showed significant enrichment for Cell cycle pathways. (E) Heatmap representation of proliferation genes expression. (F) Representative image of SA-β-Gal assay of control (shLuc) and HIRA-deficient (sh1,2-HIRA) senescent cells. (G) EdU assay was performed by treating cells with 10 μM EdU for 4 hours. In (B, E), heatmap color intensity represents the z-score calculated for each gene using TPM values, with red indicating high expression and blue indicating low expression. TRC (pLKO.1-TRC control) and sh-Luc (pLKO.1-sh-Luc) are the control shRNAs. Data shown in (A-E) represents three biological replicates. (G) represents three technical replicates.
Figure 2:
Figure 2:. HIRA and PML are required for SASP expression.
(A) Heatmap of RNA-seq analysis showing the expression of Cluster 5 genes (Figure 1A). (B) Top upstream regulators of Cluster 5 identified by IPA analysis. (C) IPA canonical pathway analysis of Cluster 5 genes showed significant enrichment for inflammatory pathways. (D) Heatmap of NanoString analysis and (E) Real-time qPCR analysis showing the expression of SASP genes in control (TRC) and HIRA (sh1,sh2), and PML (sh-PML) deficient cells. (F) Western blot analysis of IL-8 as a SASP marker, and Cyclin A as proliferation marker and p16 as senescence markers, was performed in HIRA-deficient senescent cells under the similar conditions as the RNA-seq experiment. sh-Luc is the control shRNA targeting luciferase. (G,H) Further validation of RNA-seq results through Western blot analysis following the knockdown of HIRA and PML using siRNAs. IL-8 was used as a marker for the SASP, while p21 and p16 were used as markers for senescence. Senescence was induced with 25 μM Etoposide for 24 hours, and siRNAs were transfected the following day. Cells were harvested for RNA-seq analysis 7 days post-Etoposide treatment. “NC” denotes the negative control siRNA. (I) Representative immunofluorescence image showing the localization of HIRA and PML in senescent cells in the presence of the drug ML-792. (J,K) Quantification of the number of PML and HIRA foci in senescent cells in the presence of drug ML-792, respectively. (L) Real-time qPCR analysis of SASP genes in the presence of ML-792 (0,1,10 nM). For (I-L) senescence was induced using 50 μM Etoposide for 24 hours. ML-792 was added the next day, and the media, replenished with the drug, was changed every 2 days. Cells were harvested and fixed for qPCR and immunofluorescence analysis, respectively, 7 days post-Etoposide treatment. In (A), heatmap color intensity represents the z-score calculated for each gene using TPM values, with red indicating high expression and blue indicating low expression. Data shown in (A-D), and (L) represents three biological replicates. Figures (E,J,K,L) represent the mean ± SD. The p-values were calculated using an unpaired two-tailed Student’s t-test (E,L), and using one-way ANOVA with Dunnett’s multiple comparisons test (J,K). The images were captured automatically using Nikon motorized platform. The values were calculated using Nikon NIS-Element software from 3 different wells with multiple fields. (***) p < 0.001; (**) p< 0.01; (*)p< 0.05.
Figure 3:
Figure 3:. Localization of HIRA to PML NBs is tightly linked to SASP expression.
(A) Expression of empty vector (EV), wild-type HIRA (FL), and ΔHIRA(520–1017) in senescent IMR-90 cells by western blot. The predicted molecular weight of HIRA (FL) is 112 kDa, while ΔHIRA is expected to be 55 kDa. (B) Representative immuno-fluorescence images showing ΔHIRA expression in senescent cell nuclei, stained with HA antibody. (C) Representative immuno-fluorescence images illustrating the localization of endogenous HIRA in control (EV) and ΔHIRA cell lines. The WC119 antibody used to detect endogenous HIRA does not recognize ΔHIRA (520–1017). (D-F) the number of HIRA foci, PML foci, and their ratio, respectively. Data represents the mean ± SD. The values were automatically calculated using Nikon-NIS software from three different wells with multiple fields in an unbiased manner. (G) Real-time qPCR analysis showing the expression of SASP genes in control (EV) and ΔHIRA senescent cells. Data shown represents the mean ± SD of n = 3 biological replicates. (H) Immunoblot analysis of IL8 as a SASP gene, Cyclin A as a proliferation marker, and p21, p16 as senescent markers in control (EV) and ΔHIRA senescent cells. (I,J) Heatmap of RNA-seq analysis displaying the expression of SASP gene (I); and proliferation genes (J) in proliferating control (EV (Pro)), senescent control (EV), and senescent ΔHIRA cells, 8 days after Etoposide treatment. Senescence was induced in IMR-90 cells using 50 μM Etoposide for 24 hours. (K) Venn diagram depicting differentially expressed genes (DEGs) in ΔHIRA, two HIRA-knockdown, and one PML-knockdown senescent cells, generated using VENNY2.1. (L) Heatmap of the 864 genes in proliferating control (EV (Pro)), senescent control (EV), and senescent ΔHIRA cells, which are altered in the same direction by both HIRA shRNAs and PML shRNA. In I, J, L, color intensity represents the z-score calculated for each gene using TPM values, with red indicating high expression and blue indicating low expression. Data shown represents n = 3 biological replicates. For data (D-G), the p-values were calculated using an unpaired two-tailed Student’s t-test. (***) p < 0.001; (**) p < 0.01; (*) p < 0.05, (#) p<0.1.
Figure 4:
Figure 4:. HIRA localization to PML NBs and SASP expression are SP100 and GSK3β dependent.
(A) Representative immunofluorescence image showing the dispersion of HIRA foci in senescent cells in the absence of SP100. (B) Representative immunofluorescence image showing the localization of HIRA and PML in senescent cells in the absence of SP100. (C) Relative SP100 mRNA expression and (D) the number of SP100 foci based to calculate the efficiency of SP100 siRNA (#1,#2). (E,F) Quantification of the number of HIRA and PML foci in senescent cells in the absence of SP100, respectively. (G) Real-time qPCR analysis of SASP genes in the absence of SP100 using si-RNA (#1,#2). (H,I) Relative SP100 and SASP expression in the absence of SP100 using si-RNA (#3,#4). Senescence was induced using 25 μM Etoposide for 24 hours. The next day, 20 nM siRNAs were transfected. Cells were harvested and fixed for qPCR and immunofluorescence analysis 7 days post-Etoposide treatment. (J,K) Representative immunofluorescence image showing the localization of HIRA, PML and SP100 in senescent cells in the presence of the drug LY2090314, a GSK-3β inhibitor. (L,M,N) Quantification of the number of PML, SP100, and HIRA foci in senescent cells in the presence of the drug LY2090314, respectively. (O) Real-time qPCR analysis of SASP genes in the presence of the drug LY2090314 (0,1,5,10 nM). Senescence was induced using 50 μM Etoposide for 24 hours. LY2090314 was added the next day, and the media, replenished with the drug, was changed every 2 days. Cells were harvested and fixed for qPCR and immunofluorescence analysis, respectively, 7 days post-Etoposide treatment. For (D-F,L-N), the images were captured automatically using Nikon motorized platform. The values were calculated using Nikon NIS-Element software from 3 different wells with multiple fields. The p-values were calculated using an unpaired two-tailed Student’s t-test (C,G-I,O), and using one-way ANOVA with Dunnett’s multiple comparisons test (D-F,L-N). (***) p < 0.001; (**) p< 0.01; (*)p< 0.05.
Figure 5:
Figure 5:. HIRA regulates SASP through activation of the NF-kB pathway independent of its H3.3 deposition function.
(A) The relative luminescence was measured from the lysate obtained from lenti-NF-kB-luc/GFP reporter IMR-90 cells. The luciferase activity was normalized to the mean fluorescence of GFP. (B,C) Real-time qPCR analysis was conducted to measure the expression of HIRA as an indicator of knockdown efficiency and IL-8 as SASP gene in proliferating and senescent control cells (sh-Luc control) and HIRA-deficient cells (sh1, sh2-HIRA) after treatment with recombinant IL1α (r IL1α 20 ng) for 24 hours. Senescence was induced using 50 μM Etoposide for 24 hours. On day 7 post-Etoposide treatment, rIL1α was added without changing the medium, and cells were harvested 24 hours after the addition of rIL1α. (D) Immunoblot analysis was performed on proliferating control cells (NC), senescent control cells (NC), and H3.3 knock-down cells. (E) Real-time qPCR analysis was conducted to assess the expression of SASP genes in control (NC) and H3.3-deficient senescent cells (si-H3.3). For (D, E), senescence was induced using 25 μM Etoposide for 24 hours. The next day, 20 nM siRNAs were transfected, and the cells were harvested on day 7 post-Etoposide treatment. (F) The nuclear translocation of p65 was analyzed by cellular fractionation followed by western blotting. α-Tubulin was used as a cytoplasmic marker, and Lamin A/C was used as a nuclear marker. The ratio of nuclear p65 to cytoplasmic p65 is given, normalized to the proliferating control. (G) The canonical NF-kB pathway was analyzed by immunoblotting in HIRA-depleted cells. (H) Immunoblot analysis was performed to examine p65 phosphorylation in PML-depleted cells. For (F-H), senescence was induced using 50 μM Etoposide for 24 hours and the cells were harvested on day 7 post-Etoposide treatment. Both TRC and sh-Luc were used as control samples. Data shown in (A-C), and (E) represents the mean ± SD of n = 3 biological replicates. The p-values were calculated using an unpaired two-tailed Student’s t-test. (***) p < 0.001; (**) p< 0.01; (*) p< 0.05.
Figure 6:
Figure 6:. HIRA and PML are required for cGAS-STING-TBK1 signaling.
(A-C) Cell lysates were subjected to immunoblotting. STING blot in (C) was performed under non-reducing condition. * indicates STING dimer. (D) cGAMP synthesis was assessed using the ELISA method after 8 days of etoposide treatment. Data represent the mean ± SD of n = 6 (3 biological replicates from two independent experiments). The p-values were calculated using one-way ANOVA with Dunnett’s multiple comparisons test. (E) Epifluorescence image of localization of HIRA in CCF. (F,G) Representative images of Airyscan Super-Resolution microscopy of HIRA in CCF. (H,I) Cells were stained for DAPI, γH2AX, and cGAS in control (NC) and HIRA-deficient cells (si1,2-HIRA). The cGAS intensity in individual CCF (DAPI and γH2AX positive foci in cytoplasm) was calculated. Each data point represents an individual CCF. The values were calculated using Nikon NIS-Elements software from 3 different wells with multiple fields and were log-transformed. For (A, B, H, I), senescence was induced using 25 μM Etoposide, and for (C-G), 50 μM for 24 hours. The cells were harvested on day 7 post-treatment. The p-values were calculated using an unpaired two-tailed Student’s t-test. (****) p < 0.001;(***) p < 0.001; (**) p< 0.01; (*) p< 0.05.
Figure 7:
Figure 7:. HIRA physically interacts with autophagy regulator p62 to regulate SASP expression.
(A-C) Validation of HIRA interactor proteins by western blotting, obtained from IP-MS. P, proliferating; S, senescent; I, IgG1; H, antibody against HIRA (D) Immunoprecipitation of p62 interactor proteins followed by immunoblotting for HIRA. Short exposure (SE) and long exposure (LE) were performed. (E) Representative image showing the localization of p62 with HIRA in PML NBs of senescent cells. (F) Real-time qPCR analysis showing the expression of SASP genes in control (NC) and p62-deficient cells (si1, si2, and si3). (G-I) Real-time qPCR analysis showing the expression of SASP genes (G) and immunoblot analysis of cytoplasmic fraction of senescent empty vector (EV) and HA-p62 expressing cells (H, I). (J) STING immunoblot was performed under non-reducing conditions. * indicates STING dimer. (K) Real-time qPCR analysis showing the expression of SASP genes. IMR-90 cells were first infected with lentivirus expressing shRNA against p62 (sh1 and sh2) and control (sh-Luc), and puromycin (1μg/mL, 2 days) selected, as indicated. The day following etoposide (25 μM) treatment, the cells were transfected with negative control siRNA (NC) or si-HIRA, as indicated. (L) Representative image showing the localization of p62 with HIRA in the presence and absence of PML NBs in senescent cells. (M-O) The random images were captured automatically using Nikon motorized platform. The values were calculated using Nikon NIS-Element software from 3 different wells with multiple fields. Data in (F) and (K) represent the mean ± SD of n = 3 biological replicates. (G) represents three biological replicates from two independent experiments (n=3×2). For (A-E,H-J), senescence was induced using 50 μM Etoposide, and for (F,K-O) 25 μM for 24 hours. The cells were harvested on day 7 post-treatment. For data in (F), (G), and (K), the p-values were calculated using an unpaired two-tailed Student’s t-test. (****) p < 0.0001; (***) p < 0.001; (**) p < 0.01; (*) p < 0.05.

Update of

References

    1. Huang W, Hickson LJ, Eirin A, Kirkland JL, and Lerman LO (2022). Cellular senescence: the good, the bad and the unknown. Nat Rev Nephrol 18, 611–627. 10.1038/s41581-022-00601-z. - DOI - PMC - PubMed
    1. Coppe JP, Desprez PY, Krtolica A, and Campisi J (2010). The senescence-associated secretory phenotype: the dark side of tumor suppression. Annu Rev Pathol 5, 99–118. 10.1146/annurev-pathol-121808-102144. - DOI - PMC - PubMed
    1. McHugh D, and Gil J (2018). Senescence and aging: Causes, consequences, and therapeutic avenues. J Cell Biol 217, 65–77. 10.1083/jcb.201708092. - DOI - PMC - PubMed
    1. Lopez-Otin C, Blasco MA, Partridge L, Serrano M, and Kroemer G (2023). Hallmarks of aging: An expanding universe. Cell 186, 243–278. 10.1016/j.cell.2022.11.001. - DOI - PubMed
    1. Wiley CD, and Campisi J (2021). The metabolic roots of senescence: mechanisms and opportunities for intervention. Nat Metab 3, 1290–1301. 10.1038/s42255-021-00483-8. - DOI - PMC - PubMed

MeSH terms

Substances