. 2024;18(5):101391.
doi: 10.1016/j.jcmgh.2024.101391. Epub 2024 Aug 22.

Mrgprb2-dependent Mast Cell Activation Plays a Crucial Role in Acute Colitis

Affiliations

Mrgprb2-dependent Mast Cell Activation Plays a Crucial Role in Acute Colitis

Samuel Van Remoortel et al. Cell Mol Gastroenterol Hepatol. 2024.

Abstract

Background & aims: Mast cells (MCs) are typically found at mucosal surfaces, where their immunoglobulin E (IgE)-dependent activation plays a central role in allergic diseases. Over the past years, signaling through Mas-related G protein-coupled receptor b2 (Mrgprb2) in mice and MRGPRX2 in humans has gained a lot of interest as an alternative MC activation pathway with high therapeutic potential. The aim of this study was to explore the relevance of such IgE-independent, Mrgprb2-mediated signaling in colonic MCs in the healthy and acutely inflamed mouse colon.

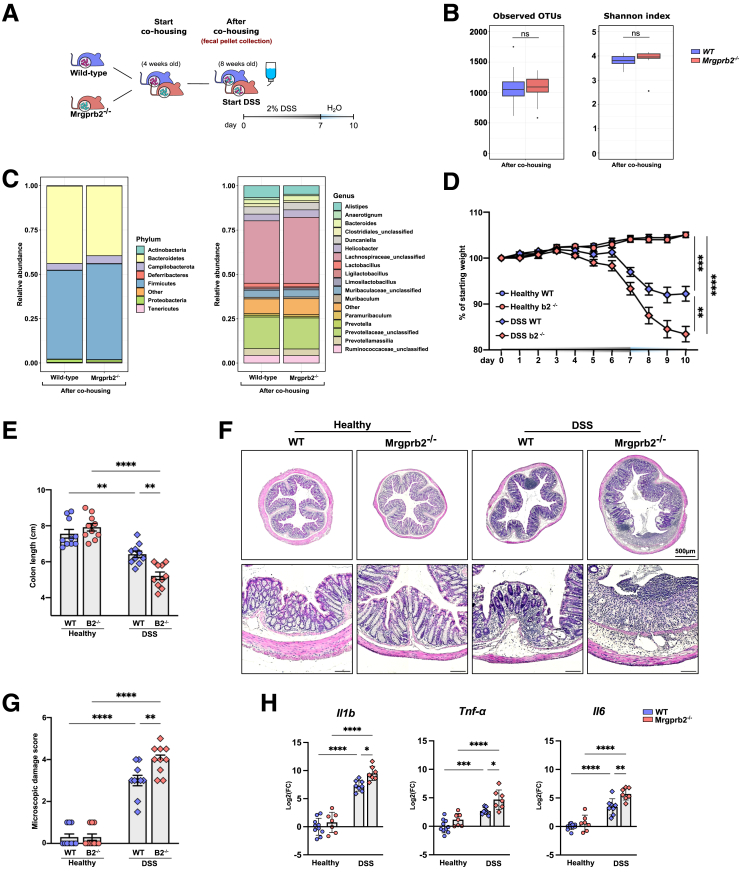
Methods: Mrgprb2 expression and functionality was studied using a genetic labeling strategy combined with advanced microscopic imaging. Furthermore, Mrgprb2 knockout (Mrgprb2-/-) mice were used to determine the role of this pathway in a preclinical dextran sodium sulphate (DSS) colitis model.

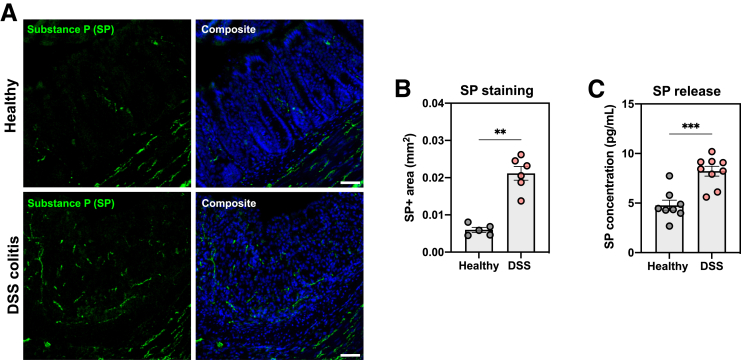
Results: We found that Mrgprb2 acts as a novel MC degranulation pathway in a large subset of connective tissue MCs in the mouse distal colon. Acute DSS colitis induced a pronounced increase of Mrgprb2-expressing MCs, which were found in close association with Substance P-positive nerve fibers. Loss of Mrgprb2-mediated signaling impaired DSS-induced neutrophil influx and significantly impacted on acute colitis progression.

Conclusions: Our findings uncover a novel, IgE-independent MC degranulation pathway in the mouse colon that plays a central role in acute colitis pathophysiology, mainly by safeguarding acute colitis progression and severity in mice. This pseudo allergic, Mrgprb2-induced signaling is part of a hitherto unconsidered colonic neuro-immune pathway and might have significant potential for the further development of effective therapeutic treatment strategies for gastrointestinal disorders, such as ulcerative colitis.

Keywords: Colitis; IgE-independent; Mas-related G Protein Coupled Receptor; Mast Cell.


Figures

None
Graphical abstract
Figure 1
Figure 1
Mrgprb2 expression in the mouse colon.A, Bar chart showing Mrgprb2 mRNA expression as quantified by qPCR in the skin (left gray bar), in dorsal root ganglia (right gray bar), and colon (red bar). Gene expression is normalized to the reference genes hprt1 and rps29 and relative to the control group (skin). n.d = not detected. B, Representative images of RNAscope in situ hybridization for Mrgprb2 mRNA expression on the skin (left) and colon (right) of healthy mice. Avidin-FITC (green) counterstaining was used as a marker for CTMCs. C, Schematic representation of the transgenic Mrgprb2-cretdTomato mouse design. D, Representative image showing Mrgprb2 co-expression in CD117+ colonic MCs (white arrowheads). E, Mrgprb2+ MCs (white arrowheads) do not co-express Mcpt1, a common mucosal MC marker (open arrowheads). Mrgprb2+ MCs co-express Mcpt6, a connective tissue MC marker (white arrowheads). F, Schematic Venn diagram indicating that Mrgprb2 is selectively expressed in the subset of colonic CTMCs. Cell numbers are pooled of 3 animals. Scale bars represent 50 μm.
Figure 2
Figure 2
Characterization of SP-Mrgprb2 signaling axis in the colon.A, 3D-rendered image of a (sub)mucosal preparation of Mrgprb2-cretdTomato colon showing that Mrgprb2-expressing MCs (red) are closely associated with SP-containing nerve fibers (green). B, Schematic representation of the ex vivo degranulation imaging principle. Assessment of MC degranulation is frequently used in skin research and is based on the high affinity of fluorescently conjugated Avidin for proteoglycans present in the granules of CTMCs. Upon their degranulation, these proteoglycans are released in the extracellular space and are bound by Avidin-FITC, resulting in the local concentration of Avidin-FITC fluorescence near the cell membrane of MCs C, Representative images showing Avidin-FITC labeling of Mrgprb2-expressing MCs in response to vehicle exposure (upper panel) or SP (50 μM) exposure (lower panel). Scale bars represent 50 μm. D, Bar chart showing the percentage of non-degranulating, Avidin-FITC-negative MCs (gray) vs degranulating, Avidin-FITC-positive MCs (red) upon vehicle or SP (50 μM) exposure. n = 3 animals per treatment. E, Representative images showing Avidin-FITC labeling in the colon of Mrgprb2-/- mice. Colonic MCs (CD117+, red) in response to SP (50 μM) exposure in the colon of WT mice (left panel) and Mrgprb2-/- mice (right panel). Colonic MCs of WT mice showed Avidin-FITC labeling, which was abolished in Mrgprb2-/- mice. F, Bar chart depicting the amount of tryptase (Mcpt6) release in the medium of WT or Mrgprb2-/- colonic explant cultures during a 1-hour exposure to vehicle or SP (50 μM). Tryptase was markedly increased after SP exposure of WT colon, which was abolished in Mrgprb2-/- colon. Statistical analysis was performed using 1-way ANOVA with Tukey’s post-hoc test (ns: not significant; ∗∗P < .01). Scale bars represent 25 μm.
Figure 3
Figure 3
Acute DSS-induced colitis impacts on Mrgprb2 expression in the colon.A, Schematic representation of the DSS treatment regimen in Mrgprb2-cretdTomato mice. B, Bar chart showing Mrgprb2 mRNA expression in the colon of healthy (n = 6) mice and DSS-treated (n = 8) mice. C, Bar chart showing the number of Mrgprb2-expressing MCs quantified in submucosal whole mounts of healthy (n = 6) mice and DSS-treated (n = 8) mice. D, Representative images of Mrgprb2-expressing MCs in whole mounts of healthy, water-treated mice (upper panel) and DSS-treated mice (lower panels). Scale bars represent 50 μm. Statistical analysis was performed using a Student’s t-test (∗P < .05;∗∗∗P < .001).
Figure 4
Figure 4
Acute DSS-induced colitis upregulates SP expression and release in the colon.A, Representative images showing SP-immunoreactivity in the colon of healthy (upper panels) and DSS colitis mice (lower panels). B, Bar chart showing SP-immunoreactive area quantified in the colon of healthy WT (n = 5) and DSS-treated WT (n = 6) mice. C, Bar chart depicting the amount of SP that was spontaneously released in colonic explant cultures of healthy WT (n = 8) and DSS-treated WT (n = 9) mice. Statistical analysis was performed using a Student’s t-test (∗∗P < .01;∗∗∗P < .001). Scale bars represent 100 μm.
Figure 5
Figure 5
Acute DSS colitis progression in Mrgprb2-/-mice.A, Schematic overview of the experimental setup for co-housing and fecal sampling of WT and Mrgprb2-/- mice before the start of DSS treatment at 8 weeks of age. B, Total number of the observed OTUs and Shannon diversity indices for each group (n = 10 mice per group). Data are represented as boxplots. Statistical analysis was performed using pairwise Wilcox testing with Bonferroni P-value adjustment (∗∗∗P < .001; ns: non-significant). C, Group profiles of the relative abundances of microbial species at phylum level (left) and genus level (right) between WT and Mrgprb2-/- mice before and after co-housing. D, Line graph showing body weight changes upon acute DSS colitis development for healthy WT mice (n = 10), healthy Mrgprb2-/- mice (n = 10), DSS-treated WT mice (n = 10), and DSS-treated Mrgprb2-/- mice (n = 10). E, Bar chart showing colon length for healthy WT mice (n = 10), healthy Mrgprb2-/- mice (n = 10), DSS-treated WT mice (n = 10), and DSS-treated Mrgprb2-/- mice (n = 10). Statistical analysis was performed using one-way ANOVA with Tukey’s post-hoc test (∗∗P < .01; ∗∗∗∗P < .0001). F, Representative images showing H&E staining on cross sections of the colon of healthy WT mice, healthy Mrgprb2-/- mice, DSS-treated WT mice, and DSS-treated Mrgprb2-/- mice. Scale bars represent 100 μm unless mentioned otherwise. G, Bar chart depicting the damage score as quantified by blinded histological assessment in the colon of healthy WT mice (n = 10), healthy Mrgprb2-/- mice (n = 10), DSS-treated WT mice (n = 10), and DSS-treated Mrgprb2-/- mice (n = 10). H, Bar charts representing mRNA expression for the pro-inflammatory cytokines il1β, Tnf-α, and Il6 as quantified by qPCR on the colon of healthy WT mice (n = 10), healthy Mrgprb2-/- mice (n = 7), DSS-treated WT mice (n = 8), and DSS-treated Mrgprb2-/- mice (n = 7). Gene expression is normalized to the reference genes hprt1 and rps29. Data are plotted as log 2-fold expression relative to the average of the healthy WT group. Statistical analysis was performed using a Student’s t-test (∗∗P < .01) and 1-way ANOVA with Tukey’s post-hoc test (∗P < .05; ∗∗P < .01; ∗∗∗P < .001; ∗∗∗∗P < .0001).
Figure 6
Figure 6
Loss of Mrgprb2 expression attenuates neutrophil recruitment during DSS colitis progression.A, Bar chart showing MPO activity per gram of tissue in the colon of healthy WT mice (n = 9), healthy Mrgprb2-/- mice (n = 9), DSS-treated WT mice (n = 10), and DSS-treated Mrgprb2-/- mice (n = 10). B, Bar chart showing the total number of C45+ cells gated from living, single cells in the colon of healthy WT mice (n = 6), healthy Mrgprb2-/- mice (n = 6), DSS-treated WT mice (n = 7), and DSS-treated Mrgprb2-/- mice (n = 6). C, Bar chart showing the total number of C45+CD11b+Ly6G+ neutrophils in the colon of healthy WT mice (n = 6), healthy Mrgprb2-/- mice (n = 6), DSS-treated WT mice (n = 7), and DSS-treated Mrgprb2-/- mice (n = 6). D, Bar chart showing the proportion of C45+Cd11b+Ly6G+ neutrophils over total CD45+Cd11b+ cells in the colon of healthy WT mice (n = 6), healthy Mrgprb2-/- mice (n = 6), DSS-treated WT mice (n = 7), and DSS-treated Mrgprb2-/- mice (n = 6). E, Bar chart showing the percentage of neutrophils in peritoneal lavages 6 hours after intraperitoneal (i.p.) injection of vehicle or PAMP9-20 (synthetic Mrgprb2 ligand, 100 μM). Neutrophils were identified by their typical polymorphonuclear morphology (black arrows) after a Diff-Quick stain. PAMP9-20 induced a robust increase in the percentage of neutrophils in the peritoneal lavage in WT mice (blue circles), which was abolished in Mrgprb2 knockout mice (red circles). F, Heat map showing the upregulation of neutrophil-attracting cyto- and chemokine genes in in vitro connective-tissue MC cultures to SP (50 μM) as compared with vehicle-treated cultures (n = 4 independent cultures). Gene expression is normalized to the reference genes hprt1 and rps29 and relative to the vehicle-treated group. G, Time schedule DSS treatment and timepoints of qPCR analysis performed on tissues isolated on d0, d5, d7 (n = 7–10 mice per timepoint) H, The log2-fold change (FC) mRNA gene expression was calculated by normalizing each sample to the average expression level detected in control samples (d0) for Cxcl1, Cxcl2, Ccl3, Ccl4, and Ccl5. Statistical analysis was performed using 2-way ANOVA with Sidak’s post-hoc test. (∗P < .05; ∗∗P < .01; ∗∗∗P < .001; ∗∗∗∗P < .0001).
Figure 7
Figure 7
Characterization of the underlying drivers of worsened colitis progression in Mrgprb2-/-mice.A, Volcano plot showing differentially expressed genes (DEGs) with a log2 fold change >1 in the colon of DSS-treated Mrgprb2-/- mice compared with WT mice. Highlighted genes (red dots) pertain to macrophages and their activation. B, Bar chart showing the top 10 gene ontology terms enriched in the transcriptomic signature of DSS-treated Mrgprb2-/- mice as compared with DSS-treated WT mice. Terms highlighted in light blue are related to tissue remodeling, terms highlighted in orange are related to inflammation. C, Clustered heatmap of DEGs related to macrophage functioning from RNA-seq analysis. D, Representative images showing Iba1 and CD68 immunoreactivity in the colon of DSS-treated WT mice (left panel) and DSS-treated Mrgprb2-/- mice (right panel). Bar chart shows the Iba1-immunoreactive area in the colon of DSS-treated WT (n = 10) mice and DSS-treated Mrgprb2-/- (n = 10) mice. E, Representative images showing CD31 immunoreactivity in the colon of DSS-treated WT mice (left panel) and DSS-treated Mrgprb2-/- mice (right panel). Bar chart shows the CD31-immunoreactive area in the colon of DSS-treated WT (n = 10) mice and DSS-treated Mrgprb2-/- (n = 10) mice. F, Representative images of Trichrome Masson-stained sections of the colon of DSS-treated WT mice (left panel) and DSS-treated Mrgprb2-/- mice (right panel). Bar chart shows collagen deposition scoring in the colon of DSS-treated WT (n = 10) mice and DSS-treated Mrgprb2-/- (n = 10) mice. Statistical analysis was performed using a Student’s t-test (∗∗P < .01) and 1-way ANOVA with Tukey’s post-hoc test (∗P < .05; ∗∗P < .01; ∗∗∗P < .001; ∗∗∗∗P < .0001). Scale bars represent 100 μm.
Figure 8
Figure 8
Neutrophil depletion during DSS colitis causes abnormal macrophage influx.A, Time schedule DSS treatment and timepoints of anti-Ly6G injections (every other day until analysis on day 10). Each mouse received a total of 5 injections. B–C, The total number of C45+Cd11b+Ly6G+ neutrophils and CD45+CD11b+Ly6g-CD64+Ly6c-MHCII+ macrophages in the colons of anti-Ly6G treated WT mice (n = 6) and anti-IgG2a treated control WT mice (n = 6) analyzed by flow cytometry. Statistical analysis was performed using a Student’s t-test (∗∗P < .01).

References

    1. Krystel-Whittemore M., Dileepan K.N., Wood J.G. Mast cell: a multi-functional master cell. Front Immunol. 2015;6:620. - PMC - PubMed
    1. Galli S.J., Gaudenzio N., Tsai M. Mast cells in inflammation and disease: recent progress and ongoing concerns. Annu Rev Immunol. 2020;38:49–77. - PubMed
    1. Elieh Ali Komi D., Wöhrl S., Bielory L. Mast cell biology at molecular level: a comprehensive review. Clin Rev Allergy Immunol. 2020;58:342–365. - PubMed
    1. Lyons D.O., Pullen N.A. Beyond IgE: alternative mast cell activation across different disease states. Int J Mol Sci. 2020;21:1498. - PMC - PubMed
    1. McNeil B.D., Pundir P., Meeker S., et al. Identification of a mast-cell-specific receptor crucial for pseudo-allergic drug reactions. Nature. 2015;519:237–241. - PMC - PubMed

MeSH terms

LinkOut - more resources