. 2024 Aug 23;7(11):e202302249.
doi: 10.26508/lsa.202302249. Print 2024 Nov.

Helminth protein enhances wound healing by inhibiting fibrosis and promoting tissue regeneration

Affiliations

Helminth protein enhances wound healing by inhibiting fibrosis and promoting tissue regeneration

Katherine E Lothstein et al. Life Sci Alliance. .

Abstract

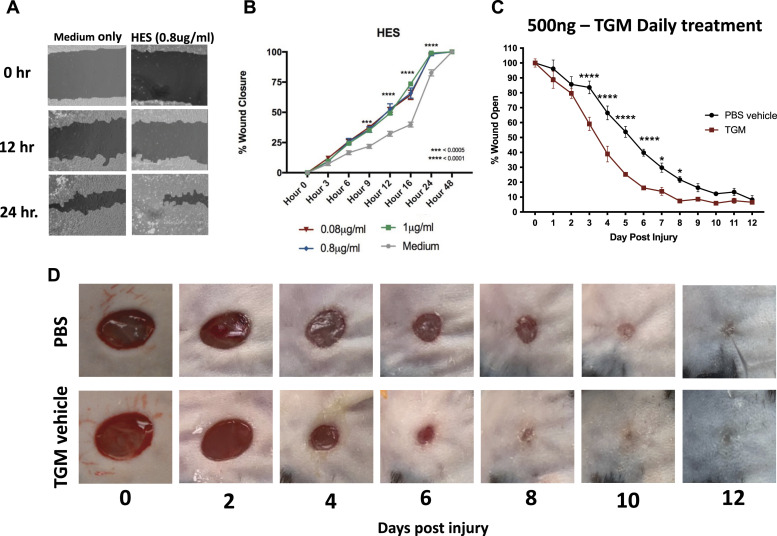
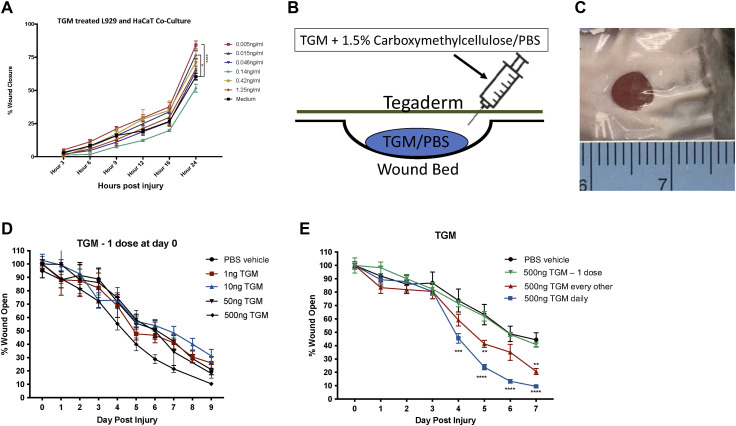
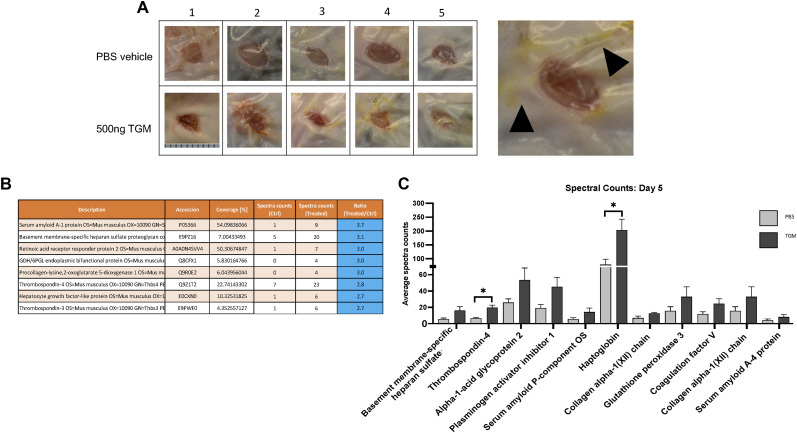
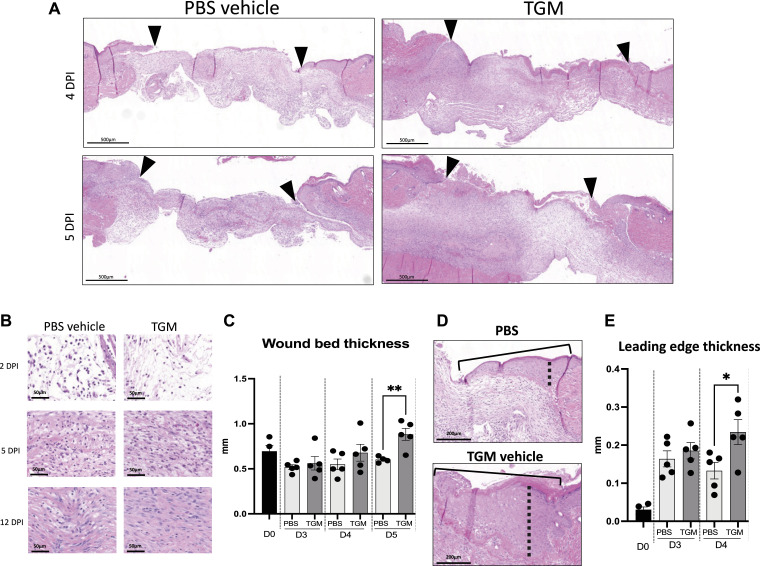
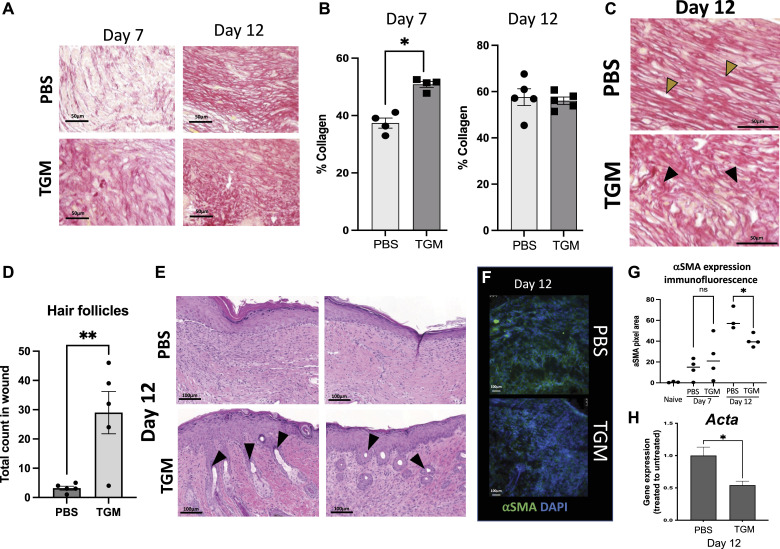
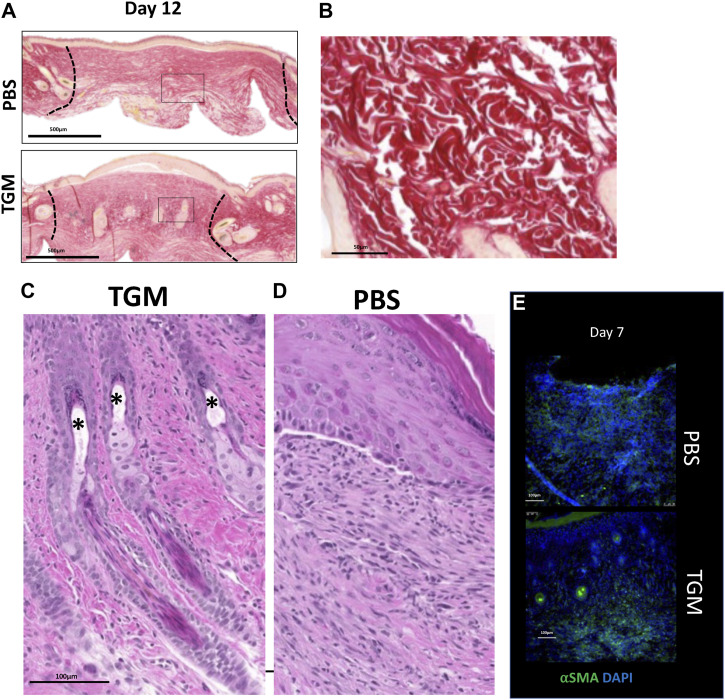
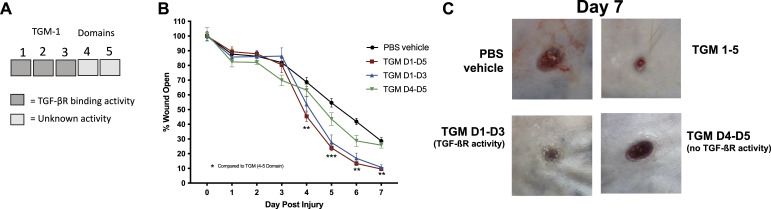
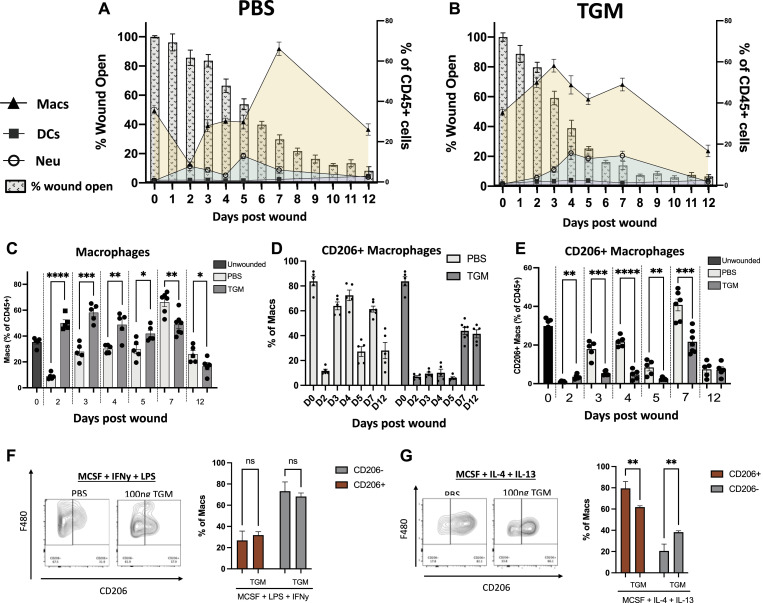
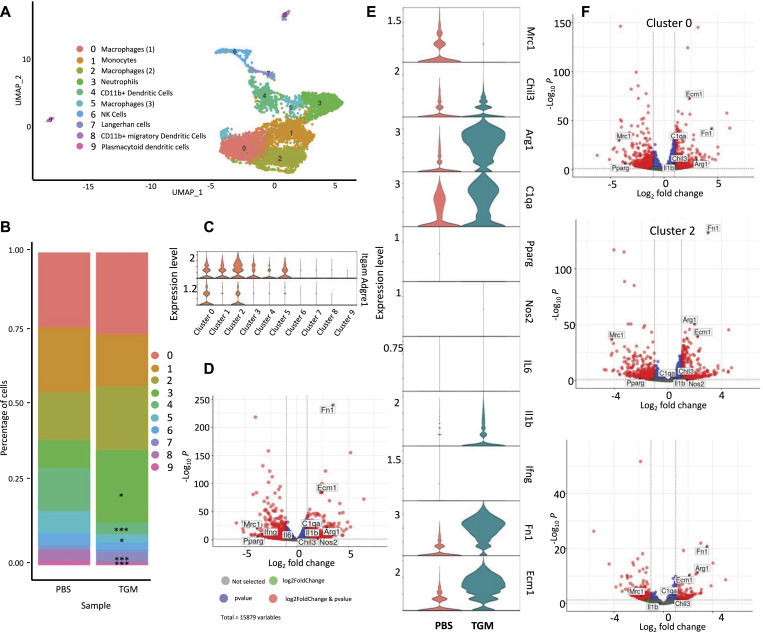
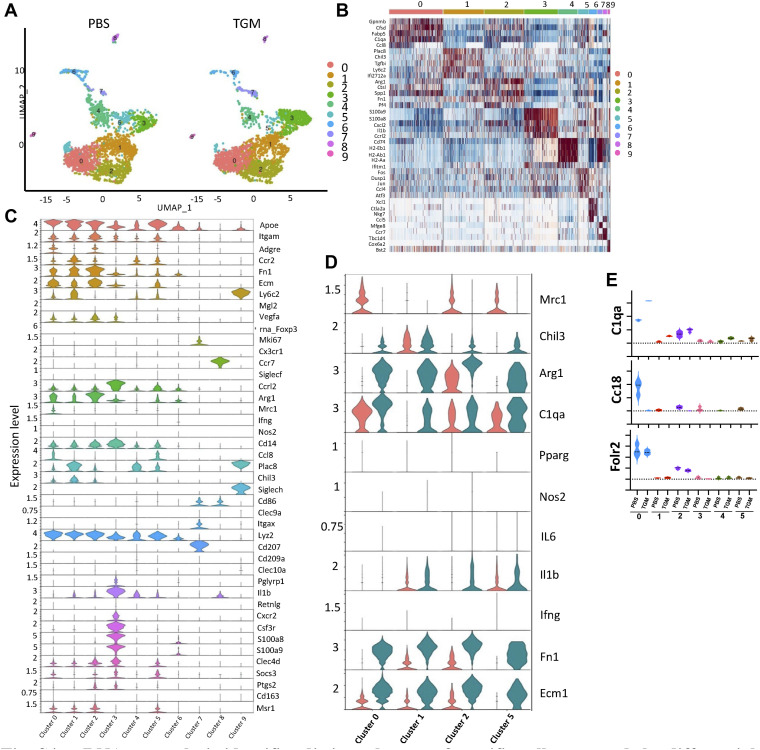
Skin wound healing due to full thickness wounds typically results in fibrosis and scarring, where parenchyma tissue is replaced with connective tissue. A major advance in wound healing research would be to instead promote tissue regeneration. Helminth parasites express excretory/secretory (ES) molecules, which can modulate mammalian host responses. One recently discovered ES protein, TGF-β mimic (TGM), binds the TGF-β receptor, though likely has other activities. Here, we demonstrate that topical administration of TGM under a Tegaderm bandage enhanced wound healing and tissue regeneration in an in vivo wound biopsy model. Increased restoration of normal tissue structure in the wound beds of TGM-treated mice was observed during mid- to late-stage wound healing. Both accelerated re-epithelialization and hair follicle regeneration were observed. Further analysis showed differential expansion of myeloid populations at different wound healing stages, suggesting recruitment and reprogramming of specific macrophage subsets. This study indicates a role for TGM as a potential therapeutic option for enhanced wound healing.


Conflict of interest statement

Rutgers, the State University of New Jersey has submitted a patent application on behalf of WC Gause, F Chen, Zhugong Liu, and P Mishra, which has been issue as Patent No. US 9,931,361 B2.

Figures

Figure 1.
Figure 1.. HES and the purified TGF-β mimic (TGM), accelerates wound closure in both a 2-D scratch test and murine dorsal wounds.
(A, B) A 2-D in vitro scratch test wound model was generated with a 50:50 co-culture of L929 fibroblast and HaCaT keratinocytes to examine the wound closure and migration with the application of HES. (A) Representative images, produced from the analysis through the online program, Tscratch, identify the area of open wounds for quantitation (filled-in areas). (B) The area of wound remaining open, calculated by Tscratch, was used to quantify the rate of wound closure for different concentrations of HES (0.08–1 μg/ml) compared with media alone from 0 to 24 h. The percentage of wound closure at each time point is compared with the percentage open at hour 0 (**P < 0.01, ***P < 0.001, ****P < 0.0001; n = 5 independent wells per condition). (C) 5 mm full-thickness excisional wounds were generated on the dorsal skin of C57BL/6 mice. Wounds were treated with PBS vehicle control or TGM (500 ng) and covered with Tegaderm for the duration of the study. Wound size analysis (ImageJ) was performed on the gross images obtained at each time point during the course of treatment. Treatments were given daily, whereas the dressing was changed every other day. Wound closure rates with either a daily dose of topical 500 ng TGM or PBS vehicle control over 12 d were quantified as the percentage of wound closure at each time point compared with the percentage open at day 0. Results from two or more independent determinations demonstrated similar results (**P < 0.01, ***P < 0.001, ****P < 0.0001; five independent wounds from each treatment were measured through blinded analysis on ImageJ). (D) Representative wound images of mice treated topically with PBS vehicle control or TGM (500 ng) on days 0, 2, 4, 6, 8, 10, and 12 demonstrate the rate of wound closure over the course of treatment. (B, C) Statistical analysis was performed using a two-way ANOVA test (B, C) with Tukey’s multiple comparisons for comparison between all treatment groups at each timepoint. Error bars represent mean ± SEM.
Figure S1.
Figure S1.. TGF-β mimic (TGM) given at one dose accelerates cell migration in an in vitro scratch test, however did not lead to enhanced wound closure in an in vivo biopsy model.
(A) A 2-D in vitro scratch test wound model was generated with a 50:50 co-culture of L929 fibroblast and HaCaT keratinocytes to examine the wound closure and migration with the application of TGM. The area of wound remaining open, calculated by Tscratch, was used to quantify the rate of wound closure for different concentrations of TGM (0.005 ng–1.25 ng/ml) compared with media alone from 0 to 24 h. The percentage of wound closure at each time point is compared with the percentage open at hour 0 (**P < 0.01, ***P < 0.001, ****P < 0.0001; n = 5 independent wells per condition). Statistical analysis was performed using a two-way ANOVA test with Tukey’s multiple comparisons for comparison between all treatment groups at each timepoint. Error bars represent mean ± SEM. Results are representative of two or more independent experiments. (B) 5 mm full-thickness excisional wounds were generated on the dorsal skin of C57BL/6 mice. Wounds were treated with PBS vehicle control or TGM (500 ng) and covered with Tegaderm for the duration of the study. The diagram depicts the application of TGM within a 1.5% carboxymethylcellulose vehicle administered underneath a layer of Tegaderm to replicate a topical application of the molecule to the wound. (C) A representative image of a wound covered by Tegaderm on day 1. The ruler was used for each image as a control for measuring the area of the open wound. (D) 5 mm full-thickness excisional wounds were generated on the dorsal skin of C57BL/6 mice. Wounds were treated with PBS vehicle control or various concentrations of TGM (1 ng–500 ng) and covered with Tegaderm for the duration of the study. Wound size analysis was performed on the gross images obtained at each time point during the course of treatment. Treatments were given once on day 0 whereas the dressing was changed every other day. (E) The results from a wound biopsy study comparing PBS vehicle control and various TGM (500 ng) dosing regimens: one day (at day 0 only), every other day (at days 0, 2, 4, and 6), and daily (given every day) and covered with Tegaderm for the duration of the study. (D, E) Wound closure rates with the various concentrations (1–500 ng) or different dosing regimens (500 ng) of topical TGM or PBS vehicle control over 7 or 9 d were quantified as the percentage of wound closure at each time point compared with the percentage open at Day 0. (**P < 0.01, ***P < 0.001, ****P < 0.0001; 5 independent wounds from each treatment were measured through blinded analysis on ImageJ). Statistical analysis was performed using a two–way ANOVA test with Tukey’s multiple comparisons for comparison between all treatment groups at each timepoint. Error bars represent mean ± SEM. Results are representative of two or more independent experiments.
Figure S2.
Figure S2.. Enhanced serous secretion containing wound healing associated protein is observed at a higher frequency in the TGF-β mimic (TGM)-treated wounds.
(A) Representative wound images from day 5 of mice treated every other day topically with PBS vehicle control or TGM (500 ng) demonstrate an increased quantity of discharge underneath the Tegaderm of each wound treated with TGM. Numbers (1, 2, 3, 4, 5) represent each mouse used in the study (n = 5). The black arrows identify the discharge in a magnified image of a wound treated with 500 ngs TGM on day 5. (B) Graphs represent raw LC-MS/MS analysis output of the protein composition from one of three repeat protein analysis studies performed on the serous discharge collected from wounds collected on day 5 after receiving PBS vehicle control and TGM every other day starting at day 0. (C) The bar graph represents the spectral counts of the protein content between the two groups. (B, C) Statistical analysis was performed using a t test to compare the two treatments for each represented protein. (*P < 0.05) Error bars represent mean ± SEM. Results from two or more independent determinations demonstrated similar results.
Figure 2.
Figure 2.. TGF-β mimic (TGM) enhances the granulation development and thickness of the epidermis/dermis within the newly formed wound.
(A) Representative hematoxylin and eosin (H&E) stained images on days 4 and 5 post-injury. Eosin staining was used to identify granulation tissue formation within the wound beds (marked by arrows) of the TGM and PBS vehicle control wounds at each timepoint. (B) Representative H&E images at higher magnification (20x) were used to visually assess the cellular and extracellular matrix deposition within the wound beds of PBS vehicle control and TGM-treated wounds on days 2, 5, and 12 post-injury. (C) H&E stained wounds were used to measure the wound thickness of the treatment groups on days 3, 4, and 5 post-injury. (A) Blinded analysis in ImageJ was used to measure the thickness of the granulation tissue within the wound bed (area between the black arrows in (A)). Multiple lengths obtained from one wound bed were averaged. Results from two or more independent determinations demonstrated similar results (**P < 0.01; five biologically independent samples were used per treatment for the blinded analysis on ImageJ). (D) Representative H&E images of the wound edge, marked by the solid black line, were used to measure wound edge thickness. Blinded analysis in ImageJ was used to measure the thickness of the wound edge. The dotted black line indicates the length measured. (E) H&E stained images were used to measure the thickness of the leading edge within the wound bed. Measurements for PBS vehicle control and TGM were analyzed on days 0, 3, and 4. The thickest part of the wound edge over the granulation tissue was used for the analysis. Results of two or more independent determinations demonstrated similar results (**P < 0.05; five biologically independent samples were used per treatment for the blinded analysis on ImageJ). (C, E) Statistical analysis was performed using a t test (C, E) to compare the two treatments at each time point. Error bars represent mean ± SEM.
Figure 3.
Figure 3.. TGF-β mimic-treated wounds are associated with pro-regenerative collagen deposition and orientation, enhanced hair follicle frequency and regulated myofibroblast expression.
(A) Picrosirius red stain was used to identify the orientation and quantify the percentage of collagen within the newly formed wound bed. Representative images of picrosirius red stain for collagen quantification (20x) identify the amount of collagen in the two treatments on days 7 and 12. (B) The collagen area within the 20x picrosirius red-stained slides was quantified using the MRI Fibrosis Tool plugin on ImageJ. Multiple images were taken for each sample spanning the length of the wound bed and then averaged for that sample. Results from two or more independent determinations demonstrated similar results (**P < 0.01; five biologically independent samples were used per treatment for the blinded analysis on ImageJ). Statistical analysis was performed using a t test to compare the two treatments at each time point. Error bars represent mean ± SEM. (C) Representative images of picrosirius red-stained slides on day 12 that were used to identify the collagen orientation in PBS vehicle control and TGF-β mimic treated wounds. Yellow arrows highlight examples of collagen in a parallel orientation. Black arrows highlight examples of basket weave collagen deposition. Images represent similar images among the other five samples in each treatment. (D) H&E stains were used to quantify the frequency of hair follicles within the wound beds on day 12. Hair follicles were included in the count if they were located within the wound bed and beneath the thickened epidermis which represented the area of the wound. (**P < 0.01; five biologically independent samples were used per treatment for the blinded analysis on ImageJ). A t test was performed to compare the two treatments at each time point. Error bars represent mean ± SEM. Results from two or more independent determinations demonstrated similar results. (E) Representative images of H&E stained slides from wounds on day 12 were used to identify skin maturation through the appearance of hair follicle formation within the wound bed. Black arrows = hair follicles. (F, G) Alpha smooth muscle actin (αSMA) representing myofibroblast formation, was quantified in all images on day 12 through immunostained slides. (F) Representative immunofluorescent stained images of wound beds stained with αSMA on day 12; αSMA (green fluorescent signal), DAPI (blue fluorescent signal). (G) Immunostained slides with αSMA were quantified on days 7 and 12 by the fluorescent intensity measured as pixel area using ImageJ. (*P < 0.05; five biologically independent samples were used per treatment for the blinded analysis on ImageJ). Results from two or more independent determinations demonstrated similar results. (H) Gene expression analysis of Acta2 expression was used to further analyze the αSMA expression within the wound bed on day 12 post-wound. (*P < 0.05; five biologically independent samples were used per treatment for the blinded analysis on ImageJ). Results from two or more independent determinations demonstrated similar results. (F, G) Statistical analysis was performed using a t test (F, G) to compare the two treatments at each time point. Error bars represent mean ± SEM.
Figure S3.
Figure S3.. TGF-β mimic (TGM)-treated wounds led to enhanced collagen deposition and hair follicle formation.
(A) Two representative picrosirius red-stained images represent the whole wound bed of PBS vehicle control and TGM-treated wounds on day 12. The black box denotes the magnified region represented in (Fig 3C). The black dotted lines indicate the wound edges on day 12. (B) A representative picrosirius red-stained wound image from the unwounded skin of a mouse shows collagen with a basket-weave orientation typical of normal skin. (C, D) A representative magnified H&E image of a 12-d TGM treated wound shows the mature hair follicles, including sebaceous glands (*) within the wound bed compared with a representative image of a PBS vehicle control treated wound (D) that is lacking hair (n = 5 for each condition and study). Images represent similar images among the other five samples in each treatment. (E) Alpha smooth muscle actin (αSMA) representing myofibroblast formation, was quantified in all images on days 7 through immunostained slides. Representative immunofluorescent stained images of wound beds stained with αSMA on day 7; αSMA (green fluorescent signal), DAPI (blue fluorescent signal).
Figure 4.
Figure 4.. In vivo wound biopsy with truncated variants suggest TGF-β mimic (TGM) enhances wound healing through TGF-ßR activity.
(A) The TGM molecule contains 5 domains. Domains 1 through 3 comprise the TGF-ßR domain activity. The activity of domains 4 and 5 is currently unknown. (B) 5 mm full-thickness excisional wounds were generated on the dorsal skin of C57/Bl6 mice. Wounds were treated with PBS vehicle control or whole TGM (TGM D1-D5; 500 ng) or TGM containing only domains 1 through 3 (TGM D1-D3; 500 ng) or domains 4 and 5 (TGM D4-D5; 500 ng) and covered with Tegaderm for the duration of the study. Wound size analysis was performed on the gross images obtained at each time point during the course of treatment. Treatments were given daily whereas the dressing was changed every other day. Wound closure rate with either a daily dose of topical TGM D1-D5, TGM D1-D3, TGM D4-D5, or PBS vehicle control over 7 d was quantified as the percentage of wound closure at each time point compared with the percentage open at day 0. (**P < 0.01, ***P < 0.001, ****P < 0.0001; black stars represent the significance of TGM D1-D5 compared with TGM D4-D5; five independent wounds from each treatment were measured through blinded analysis on ImageJ). Statistical analysis was performed using a two-way ANOVA with Tukey’s multiple comparisons for comparison between all treatment groups at each timepoint. Error bars represent mean ± SEM. (C) Representative wound images of mice treated topically with PBS vehicle control, TGM D1-D5, TGM D1-D3, or TGM D4-D5 (500 ng) on day 7 provide a visual comparison of the area of wound remaining open between the four different groups. Results from two or more independent determinations demonstrate similar results.
Figure 5.
Figure 5.. TGF-β mimic (TGM) treatment reprograms myeloid cell expansion and delays macrophage CD206 expression.
(A, B) Flow cytometric analysis of the cell population within the wound beds from day 0 to day 12 for PBS vehicle control (A) and TGM (B) treated wounds. The analyzed cells include macrophages (CD11b+ F480+ CD64+), dendritic cells (MHCII+ CD11c+ CD64) and neutrophils (CD11b+ Ly6G+ CD64) as a percentage of the total CD45+ cells. The cell populations at each time point are overlayed on a bar graph representing the wound closure of each treatment group. Left Y-axis denotes the percentage of myeloid cells of total CD45+ cells represented in the line graph. Right Y access denotes the percentage of wound open as represented in the background bar graph. The X-axis represents the days post wounding. (C) Flow cytometric analysis of the frequency of macrophages (CD11b+ F480+ CD64+), as a percentage of all CD45+ cells, in PBS vehicle control and TGM treated wounds from day 0 to day 12. (*P < 0.05, **P < 0.01, ***P < 0.001, ****P < 0.0001; five biologically independent samples were used per treatment at each time). Representative results from two or more independent experiments are shown. (D) Flow cytometric analysis for the frequency of the CD206+ macrophages as a percentage of total macrophages between PBS vehicle control and TGM treated wounds. Representative results from two or more independent experiments are shown. (E) Flow cytometric analysis of the frequency of CD206+ macrophages as a percentage of total CD45+ cells in PBS vehicle control and TGM treated wounds from day 0 to day 12. (*P < 0.05, **P < 0.01, ***P < 0.001, ****P < 0.0001; five biologically independent samples were used per treatment at each time point). Representative results from two or more independent experiments are shown. (F, G) Flow cytometric analysis of the frequency of CD206+ macrophages gated on CD11b+ F4/80+. (F, G) BMDMs were isolated and stimulated for 16 h in a (F) classically activated (LPS/IFNy) macrophage-inducing environment or (G) alternatively activated (IL-4/IL-13) macrophage environment with or without TGM. Bar graphs represent the frequency of CD206+ or CD206- macrophages as a percentage of all macrophages (*P < 0.05, **P < 0.01, ***P < 0.001, ****P < 0.0001; three wells were used per treatment). Statistical analysis of the CD206+ or CD206− populations was performed using a one-way ANOVA test with Tukey’s multiple comparisons for comparison between all treatment groups. Error bars represent mean ± SEM.
Figure 6.
Figure 6.. TGF-β mimic (TGM)-treated macrophages have reduced CD206+ expression yet are enriched for other tissue repair-associated markers.
scRNAseq analysis of CD45+ leukocytes obtained from wound bed at day 3 after skin injury. Skin wounding was performed as described in Fig 1. (A) A uniform manifold approximation projection plot of the single cells obtained from CD45+ cells purified from PBS vehicle control and TGM treated wounds on day 3 after skin injury. 10X genomics scRNAseq using was performed on the CD45+ purified cells treated with PBS vehicle control or TGM (three biologically independent samples were used per treatment labeled with three unique TotalSeq Hashtag Antibody markers). The analysis identified nine distinct cell clusters. (B) The percentage of single-cell distribution among the clusters between the PBS vehicle control and TGM treated samples. Asterisks represent the significant difference in the cluster population size between the two treatment groups (*P < 0.05, ***P < 0.001). (C) Violin plots represent the differential gene expression of macrophage markers (Itgam and Adgre1) within the clusters of TGM to PBS vehicle control combined. (D) Volcano plot representing the differential gene expression of the monocyte/macrophage populations between PBS vehicle control and TGM treated wounds (clusters 0, 1, 2, 5 combined). Horizontal dotted lines represent significant fold changes of expression for each treatment group. Vertical dotted lines represent a significant P-value (<0.05). Red dots represent genes significantly up-regulated within the two treatment groups. (E) Violin plot further define the macrophage populations by showing the differential gene expression of alternatively activated (M2) macrophage markers (Arg1, Chil3, Mrc1) and classically activated (M1) macrophage markers (Nos2, IL6, IL1b, and Ifng) within 0, 1, 2, 5 combined. (F) Volcano plots represent the differential gene expression of TGM to PBS vehicle control (clusters 0, 2, and 5). Horizontal dotted lines represent significant fold changes of expression for each treatment group. Vertical dotted lines represent a significant P-value (<0.05). Red dots represent genes significantly up-regulated with the two treatment groups.
Figure S4.
Figure S4.. scRNAseq analysis identifies distinct clusters of specific cell types and the differential expression of macrophages within the skin at day 3 post wounding.
scRNAseq analysis of CD45+ leukocytes obtained from wound bed at day 3 after skin injury. Skin wounding was performed as described in Fig 1. (A) A uniform manifold approximation projection plot of the single cells obtained from CD45+ cells purified from PBS vehicle control and TGF-β mimic treated wounds on day 3 after skin injury. 10X genomics scRNAseq using was performed on the CD45+ purified cells treated with PBS vehicle control or TGF-β mimic (three biologically independent samples were used per treatment labeled with three unique TotalSeq Hashtag Antibody markers). The analysis identified nine distinct cell clusters varying between treatment groups. (B) A heatmap identifies the top five differentially expressed markers. (C) Violin plots highlight additional differentially expressed conventional immune cell markers within each cluster. (D) Violin plots further define the macrophage populations by showing the differential gene expression of alternatively activated (M2) macrophage markers (Arg1, Chil3, Mrc1) and classically activated (M1) macrophage markers (Nos2, IL6, IL1b, and Ifng) within the individual macrophage clusters. (E) Violin plots represent the differential gene expression of additional M2 macrophage markers (C1qa, Ccl8, and Folr2). The dotted line represents the gene expression cutoff whereas the dotted lines within the graphed violin plot represent the mean.

References

    1. Eming SA, Martin P, Tomic-Canic M (2014) Wound repair and regeneration: Mechanisms, signaling, and translation. Sci Transl Med 6: 265sr6. 10.1126/scitranslmed.3009337 - DOI - PMC - PubMed
    1. Eming SA, Krieg T, Davidson JM (2007) Inflammation in wound repair: Molecular and cellular mechanisms. J Invest Dermatol 127: 514–525. 10.1038/sj.jid.5700701 - DOI - PubMed
    1. Takeo M, Lee W, Ito M (2015) Wound healing and skin regeneration. Cold Spring Harb Perspect Med 5: a023267. 10.1101/cshperspect.a023267 - DOI - PMC - PubMed
    1. Allen JE, Wynn TA (2011) Evolution of Th2 immunity: A rapid repair response to tissue destructive pathogens. PLoS Pathog 7: e1002003. 10.1371/journal.ppat.1002003 - DOI - PMC - PubMed
    1. Gurtner GC, Werner S, Barrandon Y, Longaker MT (2008) Wound repair and regeneration. Nature 453: 314–321. 10.1038/nature07039 - DOI - PubMed

Substances