. 2024 Aug 23;14(1):338.
doi: 10.1038/s41398-024-03019-2.

Switch to phagocytic microglia by CSFR1 inhibition drives amyloid-beta clearance from glutamatergic terminals rescuing LTP in acute hippocampal slices

Affiliations

Switch to phagocytic microglia by CSFR1 inhibition drives amyloid-beta clearance from glutamatergic terminals rescuing LTP in acute hippocampal slices

Gaia Piccioni et al. Transl Psychiatry. .

Abstract

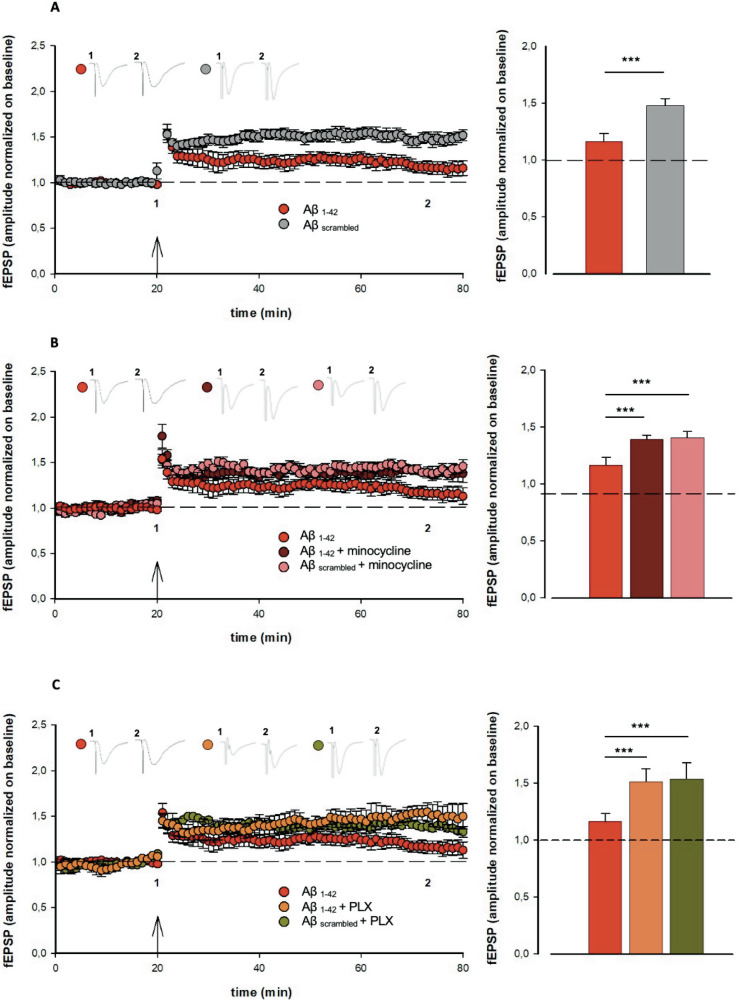
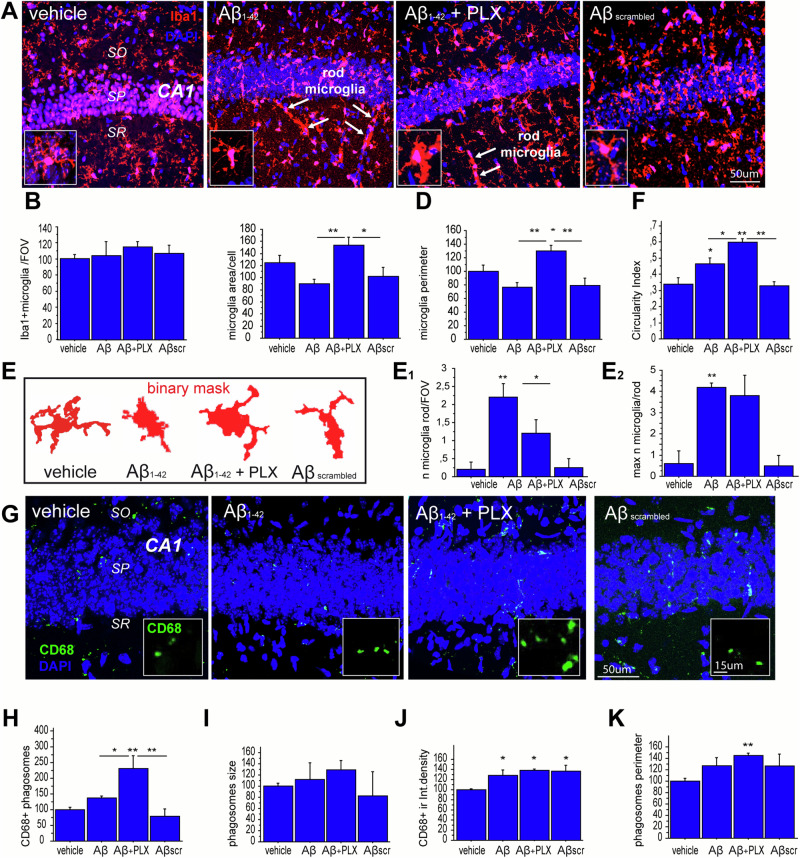
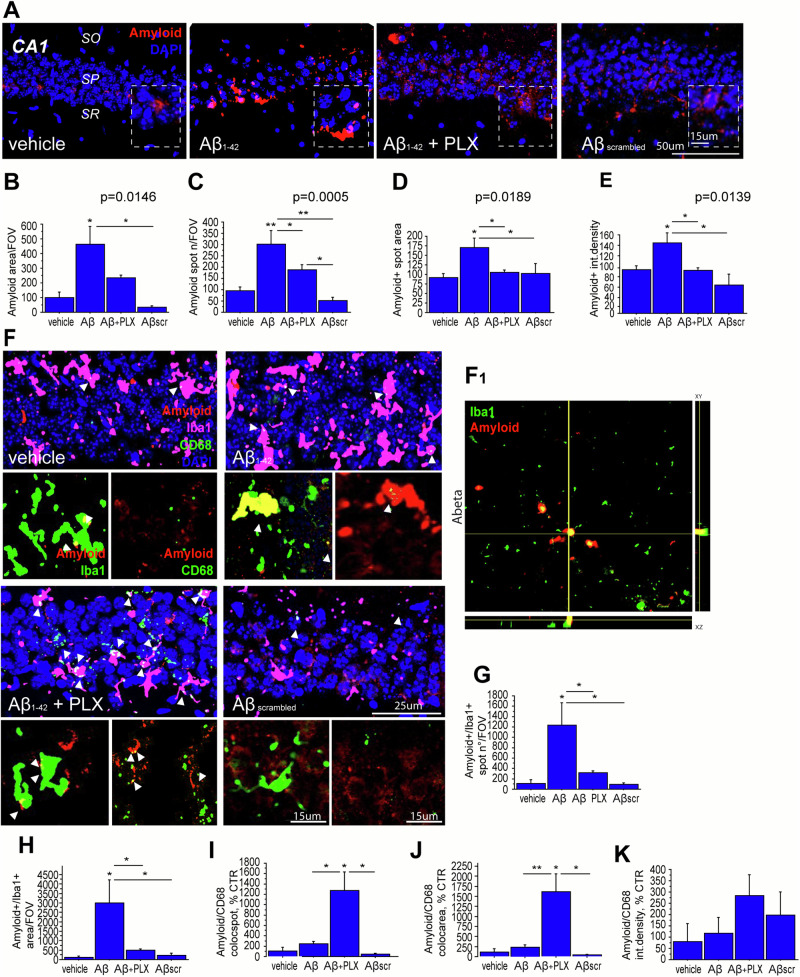
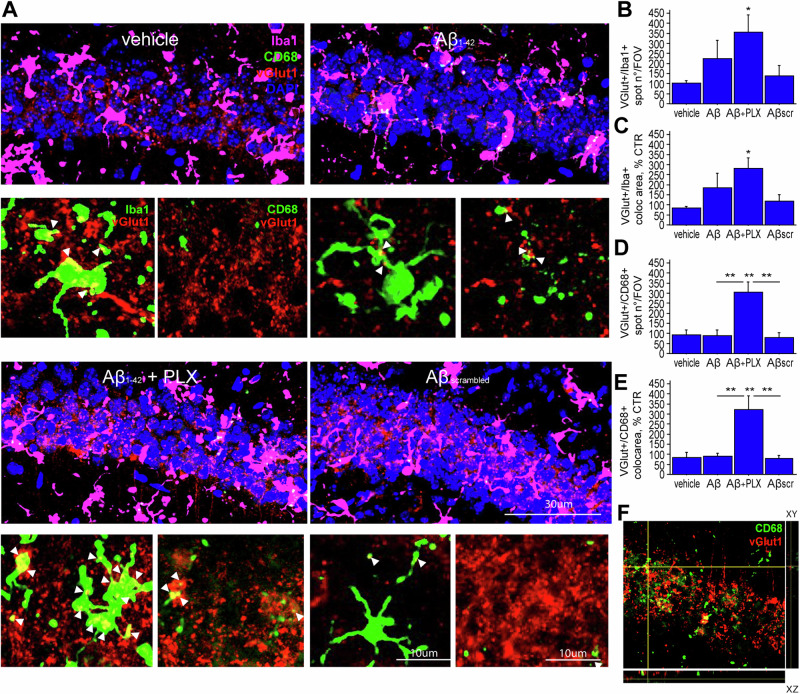
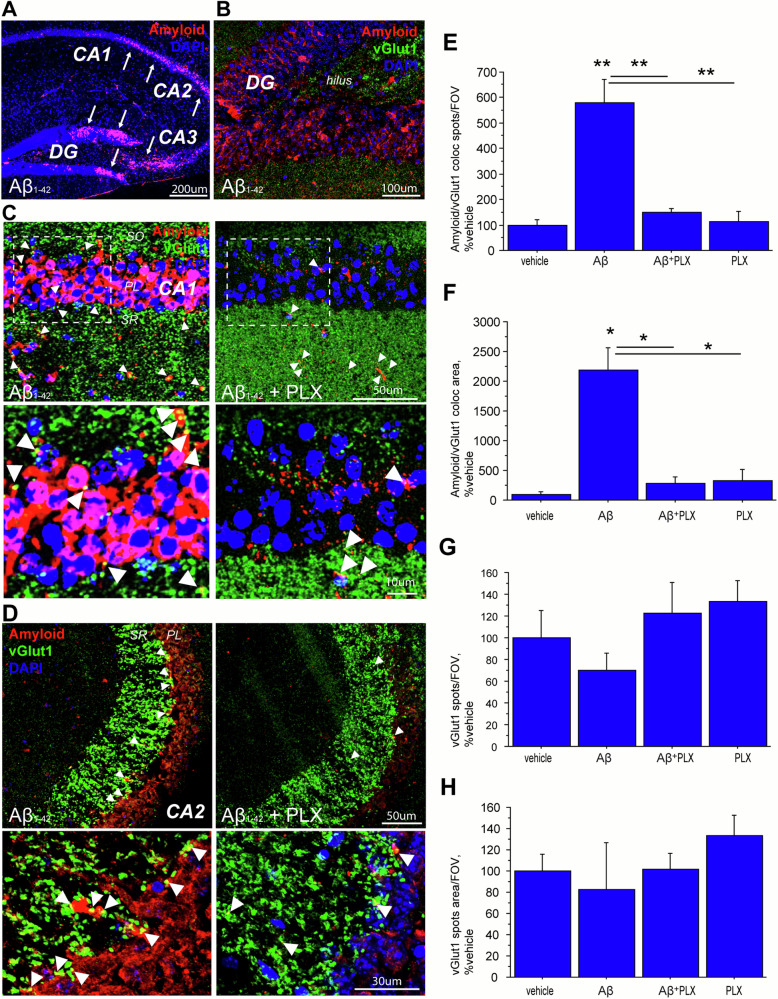
Microglia, traditionally regarded as innate immune cells in the brain, drive neuroinflammation and synaptic dysfunctions in the early phases of Alzheimer disease (AD), acting upstream to Aβ accumulation. Colony stimulating factor 1-receptor (CSF-1R) is predominantly expressed on microglia and its levels are significantly increased in neurodegenerative diseases, possibly contributing to the chronic inflammatory microglial response. On the other hand, CSF-1R inhibitors confer neuroprotection in preclinical models of neurodegenerative diseases. Here, we determined the effects of the CSF-1R inhibitor PLX3397 on the Aβ-mediated synaptic alterations in ex vivo hippocampal slices. Electrophysiological findings show that PLX3397 rescues LTP impairment and neurotransmission changes induced by Aβ. In addition, using confocal imaging experiments, we demonstrate that PLX3397 stimulates a microglial transition toward a phagocytic phenotype, which in turn promotes the clearance of Aβ from glutamatergic terminals. We believe that the selective pruning of Aβ-loaded synaptic terminals might contribute to the restoration of LTP and excitatory transmission alterations observed upon acute PLX3397 treatment. This result is in accordance with the mechanism proposed for CSF1R inhibitors, that is to eliminate responsive microglia and replace it with newly generated, homeostatic microglia, capable of promoting brain repair. Overall, our findings identify a connection between the rapid microglia adjustments and the early synaptic alterations observed in AD, possibly highlighting a novel disease-modifying target.


Conflict of interest statement

The authors declare no competing interests.

Figures

Fig. 1
Fig. 1. Minocycline and PLX3397 reverse Aβ-mediated LTP impairment.
A On the left, superimposed pooled data showing LTP in slices treated with Aβ1–42 (n = 8) or Aβscrambled (n = 8). On top, representative traces for both conditions are shown. On the right, histograms illustrating the magnitude of LTP (% of baseline) in the two experimental conditions. B On the left, superimposed pooled data showing LTP in slices treated with Aβ1–42 (n = 8), Aβ1–42 +minocycline (n = 8) or Aβscrambled+ minocycline (n = 6). On top, representative traces for both conditions are shown. On the right, histograms illustrating the magnitude of LTP (% of baseline) in the different experimental conditions. C On the left, superimposed pooled data showing LTP in slices treated with Aβ1–42 (n = 8), Aβ1–42 + PLX (n = 7) or Aβscrambled + PLX (n = 7). On top, representative traces for different experimental conditions are shown. On the right, histograms illustrating the magnitude of LTP (% of baseline) in the different experimental conditions. ***p < 0.001.
Fig. 2
Fig. 2. PLX3397 reverses excitatory neurotransmission alterations Aβ-mediated.
A On top, representative traces from different experimental conditions are shown; on the right, histograms show change in PPR in different experimental conditions, vehicle+Aβ1–42 (n = 8), PLX + Aβ1–42 (n = 7), PLX+ Aβscrambled (n = 7). **p < 0.001 Aβ1–42 vs. vehicle; ##p < 0.001 Aβ1–42 vs. PLX + Aβ1–42. B On top, representative traces in different experimental condition are shown. On the right, histograms show AMPA/NMDA ratio in different experimental conditions, vehicle+Aβ1–42 (n = 8), PLX + Aβ1–42 (n = 7), PLX + Aβscrambled (n = 7). **p < 0.001 Aβ1–42 vs. vehicle; ##p < 0.001 Aβ1–42 vs. PLX + Aβ1–42. C On top representative traces from different experimental conditions are shown. The histograms show the effect of Aβ1–42 on amplitude and frequency of sEPSC (as % of baseline) in different experimental conditions, vehicle + Aβ1–42 (n = 5), PLX + Aβ1–42 (n = 6), PLX + Aβscrambled (n = 5) *p < 0.05.
Fig. 3
Fig. 3. Morphological characterization of Aβ1–42incubated hippocampal microglia with or without PLX3397 treatment.
A Representative immunofluorescence image of Iba1 positive (red) staining for microglia in the hippocampal CA1 region of vehicle, Aβ1–42, Aβ1–42 + PLX and Aβscrambled groups (n = 7/group). B Numbers of Iba1+ microglia per field of view (FOV) were counted and no change was found in the different experimental conditions (p = 0.8079). C The Iba1-positive area per cell was evaluated as a measure of the average microglial size, and found to be significantly increased upon PLX treatment (Aβ1–42 + PLX) compared to Aβ1–42 (**p < 0.01) and Aβscrambled (*p < 0.05) groups (n = 10/group). D Perimeter of Iba1-positive microglial cell was found significantly augmented in Aβ1–42 + PLX compared with vehicle (*p < 0.05), Aβ1–42 (**p < 0.01), and Aβscrambled (**p < 0.01) groups. E The representative binary mask of microglial cells showing the morphological profile of microglia in the different experimental conditions. F The circularity index (CI) was calculated to verify the state of microglial activation based on its morphology. Treatment with PLX significantly increased the CI compared with vehicle (**p < 0.01), Aβ1–42 (*p < 0.05) and Aβscrambled (**p < 0.01) groups. Also, Aβ1–42 induced a statistically significant upward trend of CI compared with vehicle (*p < 0.05) group G Representative immunofluorescent images showing immunofluorescent labeling for CD68 positive phagosomes (green) in the hippocampal CA1 region. High magnification of CD68 positive phagosome Is shown in the insets. H The numbers of phagosomes are significantly increased upon PLX treatment (Aβ1–42 + PLX) compared to vehicle (**p < 0.01), Aβ1–42 (*p < 0.05) and Aβscrambled (**p < 0.01) groups (n = 4/group). I n = 4/group; J, K The perimeter of CD68+ phagosomes was also measured and it was found to increase in Aβ1–42 + PLX compared with vehicle (**p < 0.01) group. DAPI (blue) was used to counterstain nuclei. CA1 Cornu Ammonis 1, SO stratum oriens, SP stratum pyramidale, SR stratum radiatum. White arrows: rod-like microglia. Scale bars: A, 50 μm; G, 50 μm; islet in G, 15 μm. Graph bars indicate mean ± SEM.
Fig. 4
Fig. 4. Acute PLX3397 treatment alleviates Aβ1–42 pathology in hippocampal slices.
A Representative amyloid immunofluorescence staining (red) by the MOAB2 antibody in the hippocampal CA1. High magnifications of amyloid staining are shown in the insets. B The total amyloid area per FOV was measured and found to be significantly increased in Aβ1–42 group compared to vehicle (*p < 0.05) and Aβscrambled (*p < 0.05) groups (n > 3/ group). C The number of amyloid positive spots regardless of their size are statistically increased in Aβ1–42 (*p < 0.05), Aβ1–42 + PLX (*p < 0.05) and Aβscrambled (*p < 0.05) groups compared to vehicle (n = 5/group). D The area of the amyloid positive spots was found elevated in Aβ1–42 group compared with vehicle (*p < 0.05), PLX + Aβ1–42 (*p < 0.05) and Aβscrambled (n > 3; *p < 0.05) groups. E Amyloid staining intensity as measured by integrated density is significantly increased in the Aβ1–42 group compared with vehicle (*p < 0.05), PLX + Aβ1–42 (*p < 0.05) and Aβscrambled (*p < 0.05) groups (n > 4/group). F Analysis of amyloid distribution in microglial cells by triple immunofluorescence staining (upper image) for Iba1 (magenta), CD68 (green) and Aβ (red) in the four experimental groups (vehicle, Aβ1–42, Aβ1–42 + PLX and Aβscrambled). Composite images of amyloid (red) and Iba1 (green) immunofluorescence channels or of amyloid (red) and CD68 (green) immunofluorescence channels are shown in the high magnification images (images below) for each experimental group. Arrowheads point to area of markers colocalization. F1 Orthogonal side views along the XZ and XY planes from the confocal z-stack of the amyloid/Iba1 confocal staining (Fiji, ImageJ, NIH, USA). G The numbers of the amyloid/Iba1 colocalized spots is significantly increased by Aβ1–42 compared to vehicle (*p < 0.05), Aβ1–42 + PLX (*p < 0.05) and Aβscrambled (*p < 0.05) groups (n > 3/group). H The area of the amyloid/Iba1 colocalized spots is significantly augmented in Aβ1–42 group compared to vehicle (*p < 0.05), PLX + Aβ1–42 (*p < 0.05) and Aβ scrambled (*p < 0.05) groups (n > 3/group). I The numbers of the amyloid/CD68 colocalized spots significantly increased by PLX treatment compared to vehicle (*p < 0.05), Aβ1–42 (*p < 0.05) and Aβscrambled (*p < 0.05) groups (n > 3/group). J The area of the amyloid/CD68 colocalized spots is significantly increased by PLX treatment compared to vehicle (*p < 0.05), Aβ1–42 (**p < 0.01) and Aβscrambled (*p < 0.05) groups (n > 3/group). K Intensity of amyloid/CD68 colocalization is comparable to vehicle in all the experimental groups analyzed (n > 3. DAPI (blue) was used to counterstain nuclei. Graph bars indicate mean ± SEM. Scale bars: A, 50 μm; islet: 15 μm; F, 25 μm; islet: 15 μm.
Fig. 5
Fig. 5. Acute PLX3397 treatment facilitates the microglial pruning of glutamatergic synapses.
A Analysis of vGlut1 (red) engulfment in CD68 (green) phagocytic puncta of Iba1 positive (magenta) in the hippocampal CA1 region (upper image). DAPI (in blue) was used to counterstain nuclei. Composite images showing the vGlut1 (red) and Iba1 (green) or the vGlut1 (red) and CD68 (green) immunofluorescence channels are shown in the high magnification (images below). Arrowheads point to the colocalization of markers. B The number of vGlut1/Iba1 colocalization spots Is significantly elevated upon PLX treatment compared to vehicle (*p < 0.05) group. C Area of vGlut1/Iba1 colocalization spots is significantly increased in PLX + Aβ1–42 group compared to vehicle (*p < 0.05) group. D The number of vGlut1/CD68 colocalization spots is found increased in the Aβ+ group compared to vehicle (**p < 0.01), Aβ1–42 (**p < 0.01) and Aβscrambled (**p < 0.01) groups (n > 4/group). E Area of vGlut1/CD68 colocalization spots is significantly increased in Aβ1–42 + PLX group compared to vehicle (**p < 0.01), Aβ (**p < 0.01) and Aβscrambled (**p < 0.01) groups (n > 4/group). F The orthogonal side views (XZ, XY planes) from the confocal z-stack (Fiji, ImageJ, NIH, USA) of the vGlut1/CD68 double immunofluorescence staining confirm vGlut1 (red) staining within the CD68 positive phagosomal vesicles (green). Graph bars indicate mean ± SEM. Scale bars: upper image, 30 μm; images below, 10 μm.
Fig. 6
Fig. 6. Acute PLX3397 treatment promotes clearing of Aβ-loaded glutamatergic synapses in both the CA1 and CA2 hippocampal regions.
A Hippocampal areas where the amyloid staining (red) is more evident are indicated (white arrows) in slices incubated with Ab1–42. B The vGlut1 (green) and amyloid (red) double immunofluorescent staining shows no clearly detectable amyloid at the vGlut1 glutamatergic terminals of Aβ1–42 incubated hippocampal slices. C The vGlut1 (green) and amyloid (red) double immunofluorescent staining in the CA1 region of the hippocampus of the Aβ1–42 and in the Aβ1–42 + PLX groups is shown at low (upper image) and high (islet) magnifications. D The vGlut1 (green) and amyloid (red) double immunofluorescent staining in the CA2 region of the hippocampus of the Aβ1–42 and in the Aβ1–42 + PLX groups is shown at low and high (islet) magnifications. E The number of amyloid/vGlut1 colocalization spots is significantly augmented following amyloid incubation (Aβ1–42 group, **p < 0.01), as compared to both vehicle and PLX3397 alone (PLX) but normalizes to control level when amyloid is co-incubated with PLX3397 (Aβ1–42 + PLX). F The area of amyloid/vGlut1 colocalization spots follows the same trend, with a significant increase in the Aβ1–42 group, as compared to vehicle (*p < 0.05), Aβ1–42 + PLX (*p < 0.05), and PLX (*p < 0.05) groups. G The number and H the area of vGlut1-positive spots are comparable in all the experimental groups analyzed (p = 0.5834 and p = 0.3427, respectively; n=3/group). Arrowheads point to the vGlut1/amyloid colocalization puncta in both the cell body and dendritic layers of the CA1 and CA2. DAPI (blue) was used to counterstain nuclei. CA1-3 Cornu Ammonis 1-3, DG dentate gyrus. Scale bars: A 200 μm; B 100 μm; C 50 μm; islet, 10 μm; D 50 μm; islet, 30 μm. SO stratum oriens, PL stratum pyramidale, SR stratum radiatum, CA2 Cornu Ammonis 2.

References

    1. Piccioni G, Mango D, Saidi A, Corbo M, Nisticò R. Targeting microglia-synapse interactions in Alzheimer’s disease. Int J Mol Sci. 2021;22:2342. 10.3390/ijms22052342. - PMC - PubMed
    1. Yousefizadeh A, Piccioni G, Saidi A, Triaca V, Mango D, Nisticò R. Pharmacological targeting of microglia dynamics in Alzheimer’s disease: Preclinical and clinical evidence. Pharmacol Res. 2022;184:106404. - PubMed
    1. Prinz M, Jung S, Priller J. Microglia biology: one century of evolving concepts. Cell. 2019;179:292–311. 10.1016/j.cell.2019.08.053. - PubMed
    1. Paolicelli RC, Bolasco G, Pagani F, Maggi L, Scianni M, Panzanelli P, et al. Synaptic pruning by microglia is necessary for normal brain development. Science. 2011;333:1456–8. 10.1126/science.1202529. - PubMed
    1. Akiyoshi R, Wake H, Kato D, Horiuchi H, Ono R, Ikegami A, et al. Microglia enhance synapse activity to promote local network synchronization. eNeuro. 2018;5:ENEURO.0088-18.2018 10.1523/ENEURO.0088-18.2018. - PMC - PubMed

MeSH terms

LinkOut - more resources