. 2024 Aug 23;15(8):613.
doi: 10.1038/s41419-024-06921-1.

Hexokinase HK3-mediated O-GlcNAcylation of EP300: a key regulator of PD-L1 expression and immune evasion in ccRCC

Affiliations

Hexokinase HK3-mediated O-GlcNAcylation of EP300: a key regulator of PD-L1 expression and immune evasion in ccRCC

Wei Zhang et al. Cell Death Dis. .

Abstract

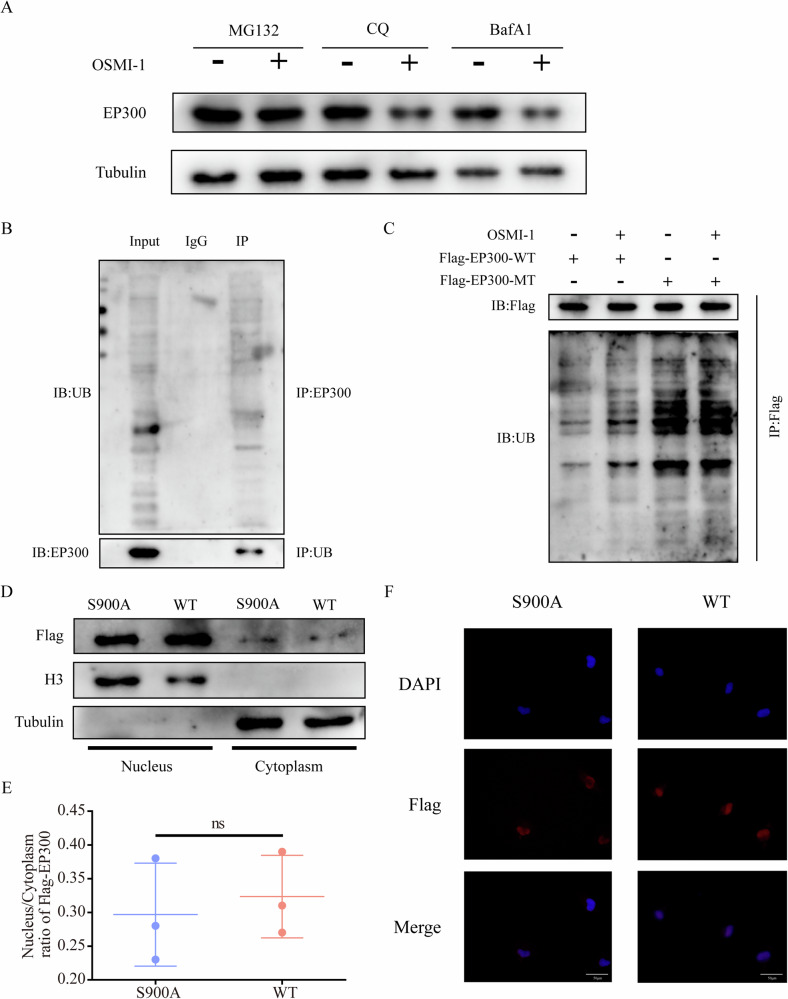
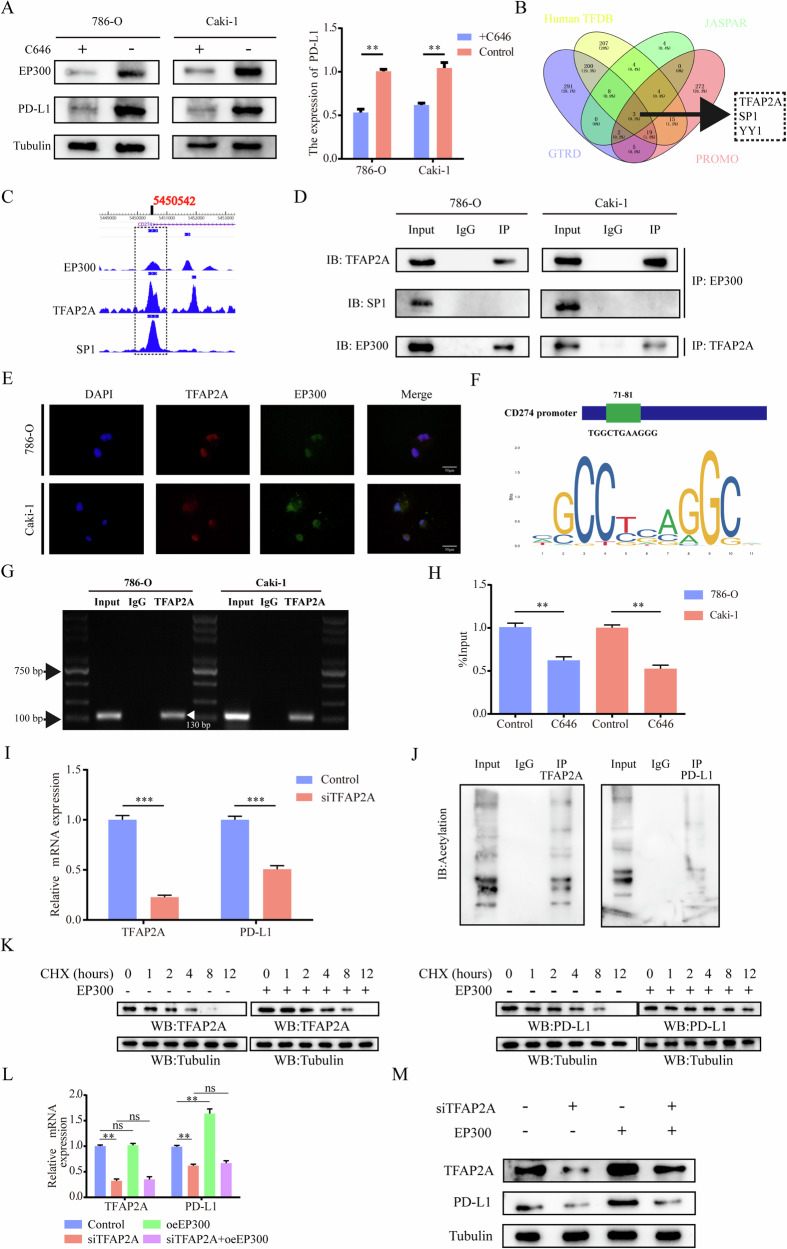
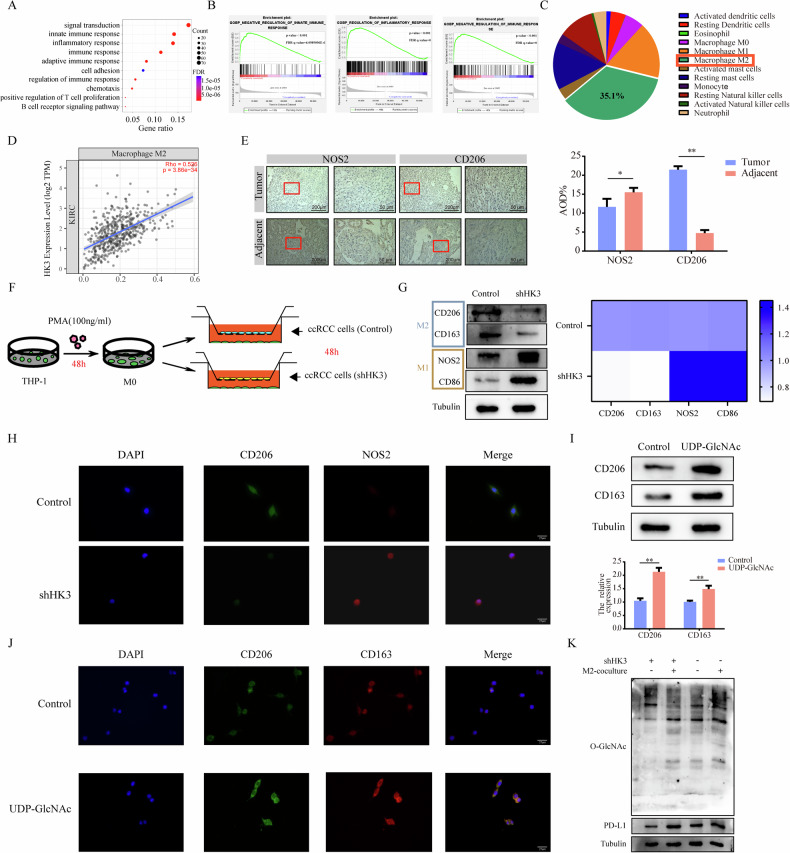
Clear cell renal cell carcinoma (ccRCC) demonstrates enhanced glycolysis, critically contributing to tumor development. Programmed death-ligand 1 (PD-L1) aids tumor cells in evading T-cell-mediated immune surveillance. Yet, the specific mechanism by which glycolysis influences PD-L1 expression in ccRCC is not fully understood. Our research identified that the glycolysis-related gene (GRG) HK3 has a unique correlation with PD-L1 expression. HK3 has been identified as a key regulator of O-GlcNAcylation in ccRCC. O-GlcNAcylation exists on the serine 900 (Ser900) site of EP300 and can enhance its stability and oncogenic activity by preventing ubiquitination. Stably expressed EP300 works together with TFAP2A as a co-transcription factor to promote PD-L1 transcription and as an acetyltransferase to stabilize PD-L1 protein. Furthermore, ccRCC exhibits interactive dynamics with tumor-associated macrophages (TAMs). The uridine 5'-diphospho-N-acetylglucosamine (UDP-GlcNAc), which serves as a critical substrate for the O-GlcNAcylation process, facilitates TAMs polarization. In ccRCC cells, HK3 expression is influenced by IL-10 secreted by M2 TAMs. Our study elucidates that HK3-mediated O-GlcNAcylation of EP300 is involved in tumor immune evasion. This finding suggests potential strategies to enhance the efficacy of immune checkpoint blockade therapy.


Conflict of interest statement

The authors declare no competing interests.

Figures

Fig. 1
Fig. 1. Identification of the glycolytic gene HK3 associated with PD-L1.
A The heatmap showed the expression distributions of differential GRGs between tumor samples and normal samples of the KIRC. B Process of candidate gene selection. C Venn diagram of the GRGs and the PD-L1 related genes in KIRC. D Quantitative analysis of HK3 expression showing significant increase in tumor tissues compared to the adjacent normal tissues by qRT-PCR (n = 12). E WB analysis of HK3 protein expression in 4 represented ccRCC tissues and adjacent normal tissues from patients. Quantitation of relative expression levels was shown. F IHC stainings with HK3 and PD-L1 were performed in 10 pairs of ccRCC tissues and adjacent normal tissues. Representative images are shown. Scale bar, 50 μm. Correlation analysis of HK3 and PD-L1 expressions, Pearson’s r test. G KM survival analysis revealed that an elevated HK3 expression was significantly correlated with a shorter OS in 539 ccRCC patients from the TCGA cohort. H KM survival analysis revealed that an elevated HK3 expression was significantly correlated with a shorter OS in 86 ccRCC patients our postoperative follow-up. *p < 0.05, **p < 0.01, ***p < 0.001.
Fig. 2
Fig. 2. HK3 promotes tumor immune evasion by upregulating PD-L1 expression.
A WB analysis of HK3 expression using one normal renal cell lines HK2 and three renal cancer cell lines 786-O, Caki-1 and ACHN cells. Quantitation of relative expression levels was shown. The qRT-PCR (B), WB (C) analysis of HK3 and PD-L1 expression in ccRCC cell lines infected with shControl or shHK3. Tubulin served as an internal reference. The diferences were compared between shControl group and shHK3 group. D The ECAR in 786-O cells infected with shControl or shHK3. Each data point was the average of at least three independent measurements. Error bars denote the means ± standard deviations (SD). E Flow cytometry analysis showed that membrane surface expression of PD-L1 was reduced in cells transfected with shHK3. F The 786-O and Caki-1 cells transfected with indicated shControl and shHK3, were incubated with activated T cells for 16 h and the cytotoxicity was measured by LDH release assay (n = 3 independent experiments). *p < 0.05, **p < 0.01, ns no significance.
Fig. 3
Fig. 3. HK3 regulates O-GlcNAcylation levels in ccRCC.
A The O-GlcNAcylation level of ccRCC tissues and adjacent normal tissues. B WB analysis of O-GlcNAcylation expression using one normal renal cell lines HK2 and two ccRCC cell lines 786-O and Caki-1. C WB analysis of O-GlcNAcylation in ccRCC cell lines infected with shControl or shHK3. D The HBP pathways in cells. E The intracellular level of UDP-GlcNAc was detected by ELISA. F The correlation between OGA and OGT with HK3. G The survival curve shows that there is a significant difference in the expression of OGT on the prognosis of ccRCC. The qRT-PCR (H), WB (I) analysis of OGA and OGT expression in ccRCC cell lines infected with shControl or shHK3. The ccRCC cells transfected with shControl or shHK3 and then treated with 0 or 20 ng/ml UDP-GlcNAc for another 48 h, OGT, PD-L1 (J) and O-GlcNAcylation (K) WB analyses were performed using the indicated antibodies. The ccRCC cells transfected with shControl or shHK3 and then treated with control or oeOGT for another 48 h, OGT, PD-L1 (L) and O-GlcNAcylation (M) WB analyses were performed using the indicated antibodies. *p < 0.05, **p < 0.01, ***p < 0.001, ns no significance.
Fig. 4
Fig. 4. HK3 affects the O-GlcNAcylation of EP300.
A Co-IP experiment analysis of the interaction between PD-L1 and O-GlcNAcylation in 786-O and Caki-1 cells. B The selected 29 genes were used for Gene Ontology-enrichment analysis, BP, CC and MF. C Venn diagram demonstrating the overlapping of three enriched gene sets, protein stabilization, nucleus, and protein binding. D WB analysis of HCFC1, NAA15, EP300 and PD-L1 expression in ccRCC cell lines infected with shControl and shHK3. E The expression of EP300 in ccRCC primary tumor tissues and adjacent normal tissues at the mRNA level (left) from the TCGA database and at the protein level (right) from the CPTAC database. F Quantitative analysis of HK3 expression showing significant increase in tumor tissues compared to the adjacent normal tissues by qRT-PCR (n = 12). G WB analysis of HK3 protein expression in 6 represented ccRCC tissues and adjacent normal tissues from ccRCC patients. Quantitation of relative expression levels was shown. H Quantitative analysis of EP300 expression showing significant increase in normal renal cell lines HK2 compared to the two ccRCC cell lines 786-O and Caki-1 by qRT-PCR. I WB analysis of EP300 expression using one normal renal cell lines HK2 and two ccRCC cell lines 786-O and Caki-1. Quantitation of relative expression levels was shown. *p < 0.05, **p < 0.01, ***p < 0.001.
Fig. 5
Fig. 5. O-GlcNAcylation modification at Ser900 stabilizes EP300.
A LC-MS analysis of EP300 identified residue Ser900 as the EP300 O-GlcNAcylation site. B Cross-species sequence alignment of EP300. C Co-IP experiment analysis of the interaction between EP300 and O-GlcNAcylation in 786-O and Caki-1 cells. D Analysis of the apparent half-life time of EP300 in 786-O cells transfected with or without shHK3. E Analysis of the apparent half-life time of wild type and mutant EP300 in CHX treated cells transfected with indicated vectors. F 786-O cells were transfected with shControl or shHK3 were infected with FLAG-EP300-WT and S900A plasmids.
Fig. 6
Fig. 6. O-GlcNAcylation stabilizes EP300 through suppression of its ubiquitination.
A 786-O cells were treated with 10 μM MG132, 50 μM chloroquine (CQ) or 100 nM bafilomycin A1 (BafA1) for 6 h before treatment with 20 μM OSMI-1. B Co-IP experiment analysis of the interaction between PD-L1 and UB in 786-O cells. C 786-O cells were treated with 0 or 20 μM OSMI-1 were infected with FLAG-EP300-WT and S900A plasmids. D WB analyses were performed on nuclear and cytoplasm fractions with anti-Flag. E The nucleus/cytoplasm ratio of EP300 was quantified. F Representative images of subcellular localization of EP300 in 786-O cells. Scale bar, 50 μm. ns no significance.
Fig. 7
Fig. 7. EP300 regulates PD-L1 at transcriptional and protein levels.
A The WB (left) and qRT-PCR (right) analyses of EP300 and PD-L1 expression in ccRCC cell lines treated with 0 or 20 μM C646. B Venn diagram demonstrating the overlapping of four datasets, Human TFDB (http://bioinfo.life.hust.edu.cn/HumanTFDB#!/), JASPAR (https://jaspar.genereg.net/), GTRD (http://gtrd20-06.biouml.org/) and PROMO (https://alggen.lsi.upc.es/cgi-bin/promo_v3/promo/promoinit.cgi?dirDB=TF_8.3) comprised three genes: TFAP2A, SP1, YY1. C Depiction of EP300, TFAP2A and SP1 binding peaks at CD274 promoter from Cistrome Data Browser (http://cistrome.org/db/#/). D Co-IP experiment analysis of the interaction of EP300 with TFAP2A and SP1 in 786-O and Caki-1 cells. E Representative IF images of TFAP2A and EP300 in vitro ccRCC cells. Scale bar, 50 μm. F TFAP2A-responsive elements motif sequence identified with JASPAR. G ChIP assay confirmed that TFAP2A could directly bind with CD274 (−71 nt to −81 nt). H ChIP-qPCR was performed using TFAP2A antibodies after 786-O and Caki-1 were treated with or without C646 (20 μM) (n = 3). I The qRT-PCR analysis of TFAP2A and PD-L1 expression in ccRCC cell lines infected with siControl or siTFAP2A. J Co-IP experiment analysis of the interaction between PD-L1 and KAC in 786-O and Caki-1. K Analysis of the apparent half-life time of TFAP2A and PD-L1 in 786-O cells infected with or without oeEP300. The ccRCC cells transfected with siControl or siTFAP2A and then treated with control or oeEP300 for another 48 h, TFAP2A, PD-L1 qRT-PCR (L) and WB (M) analyses were performed using the indicated antibodies. *p < 0.05, **p < 0.01, ***p < 0.001, ns no significance.
Fig. 8
Fig. 8. UDP-GlcNAc promotes TAMs to polarize into M2 TAMs.
A KEGG pathway analysis of HK3 revealed the enriched signaling pathways. B The GSEA plot shows a negative correlation between the enrichment of HK3 and immune regulation. C Proportion of different types of innate immune cells resided in KIRC tissue. D Correlation analysis of HK3 mRNA level and M2 macrophages. E Representative IHC staining images showing the expression of NOS2 and CD206 in tumor tissues and adjacent normal tissues (left, scale bar = 200 μm and right, scale bar = 50 μm). F The co-culture model of ccRCC cells and macrophages. G WB analyses of the M1 macrophage marker (CD86, NOS2) and M2 macrophage marker (CD163, CD206) expression. Quantitation of relative expression levels was shown. H Representative IF images of macrophage surface markers CD206 and NOS2 in vitro. Scale bar, 25 μm. I WB analyses of the M2 macrophage marker (CD163, CD206) expression. Quantitation of relative expression levels was shown. J Representative IF images of macrophage surface markers CD206 and CD163 after co-cultivation with ccRCC cells in vitro. Scale bar, 25 μm. K WB analyses of O-GlcNAcylation and PD-L1 in shControl and shHK3 ccRCC cells with or without M2 macrophages-coculture medium. *p < 0.05, **p < 0.01, ***p < 0.001.
Fig. 9
Fig. 9. Upregulation of PD-L1 by HK3 is required for immune evasion.
A Schematic overview of the virtual screening approach based on TCMSP database. B Chemical structure of Coroslic acid. C Predicted model of Coroslic acid binding to the HK3 as shown by computational docking. D Protein expressions of HK3, O-GlcNAcylation and PD-L1 in both Coroslic acid treated 786-O and Caki-1 cell lines under different concentrations. E Representative IF images of in vitro ccRCC cells with or without Coroslic acid. Scale bar, 50 μm. F The 786-O and Caki-1 cells treated with Coroslic acid, were incubated with activated T cells for 16 h and the cytotoxicity was measured by LDH release assay (n = 3 independent experiments). G Representative figures of tumor size from mice with various treatments (n = 4). The volume (H) and weight (I) of tumors (n = 4). J The distribution of M2 macrophages in mice tumor tissues was detected by IF analysis. Scale bar, 100 μm. K Representative figures of tumor size from mice with various treatments (n = 4). The volume (L) and weight (M) of tumors (n = 4). *p < 0.05, **p < 0.01, ***p < 0.001, ns no significance.
Scheme 1
Scheme 1
Hexokinase HK3 regulates HBP-related metabolic reprogramming to promote tumor immune evasion and polarize M2 macrophage in ccRCC.

References

    1. Ljungberg B, Albiges L, Abu-Ghanem Y, Bensalah K, Dabestani S, Fernandez-Pello S, et al. European Association of Urology Guidelines on Renal Cell Carcinoma: The 2019 Update. Eur Urol. 2019;75:799–810. 10.1016/j.eururo.2019.02.011 - DOI - PubMed
    1. Weiss RH. Metabolomics and Metabolic Reprogramming in Kidney Cancer. Semin Nephrol. 2018;38:175–82. 10.1016/j.semnephrol.2018.01.006 - DOI - PMC - PubMed
    1. Cohen HT, McGovern FJ. Renal-cell carcinoma. N Engl J Med. 2005;353:2477–90. 10.1056/NEJMra043172 - DOI - PubMed
    1. Wettersten HI, Aboud OA, Lara PN Jr, Weiss RH. Metabolic reprogramming in clear cell renal cell carcinoma. Nat Rev Nephrol. 2017;13:410–9. 10.1038/nrneph.2017.59 - DOI - PubMed
    1. Sanchez DJ, Simon MC. Genetic and metabolic hallmarks of clear cell renal cell carcinoma. Biochim Biophys Acta Rev Cancer. 2018;1870:23–31. 10.1016/j.bbcan.2018.06.003 - DOI - PMC - PubMed