. 2024 Aug 23;15(1):7282.
doi: 10.1038/s41467-024-51666-2.

Identifying the multiple drivers of cactus diversification

Affiliations

Identifying the multiple drivers of cactus diversification

Jamie B Thompson et al. Nat Commun. .

Abstract

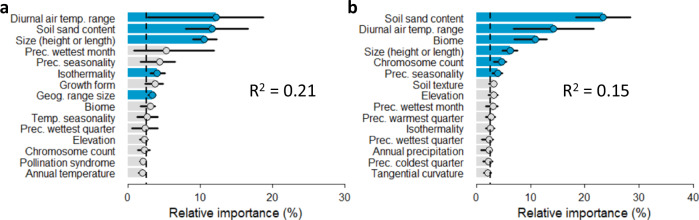
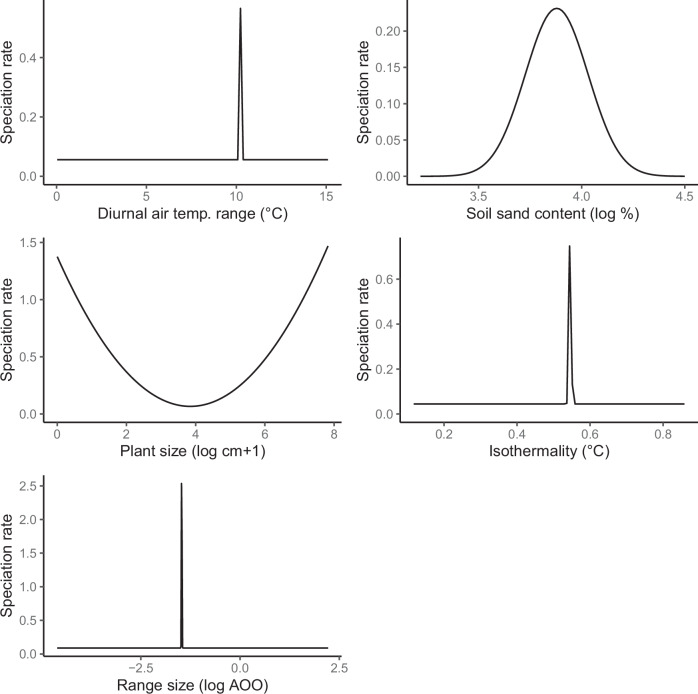
Our understanding of the complexity of forces at play in the rise of major angiosperm lineages remains incomplete. The diversity and heterogeneous distribution of most angiosperm lineages is so extraordinary that it confounds our ability to identify simple drivers of diversification. Using machine learning in combination with phylogenetic modelling, we show that five separate abiotic and biotic variables significantly contribute to the diversification of Cactaceae. We reconstruct a comprehensive phylogeny, build a dataset of 39 abiotic and biotic variables, and predict the variables of central importance, while accounting for potential interactions between those variables. We use state-dependent diversification models to confirm that five abiotic and biotic variables shape diversification in the cactus family. Of highest importance are diurnal air temperature range, soil sand content and plant size, with lesser importance identified in isothermality and geographic range size. Interestingly, each of the estimated optimal conditions for abiotic variables were intermediate, indicating that cactus diversification is promoted by moderate, not extreme, climates. Our results reveal the potential primary drivers of cactus diversification, and the need to account for the complexity underlying the evolution of angiosperm lineages.


Conflict of interest statement

The authors declare no competing interests.

Figures

Fig. 1
Fig. 1. Remarkable diversification rate heterogeneity across Cactaceae.
Branches are coloured by speciation rates estimated with BAMM28 and vary 32-fold. Arc segments of median speciation rate for thirteen morphologically varied cactus genera are indicated. Cactus images are used under Creative Commons with modifications allowed. From left to right: images 1, 3, 8, 11, 12, and 13 used photos taken by Amante Darmanin, Forest & Kim Starr, John Tann, Renee Grayson, and Wendy Cutler, which are licensed under a Creative Commons Attribution 2.0 License (https://creativecommons.org/licenses/by/2.0/). Image 2 used a photo marked as being in the Public Domain (https://creativecommons.org/publicdomain/mark/1.0/). Images 4 and 10 used photos taken by Leonora Enking and Lyubo Gadzhev, which are licensed under a Creative Commons Attribution-ShareAlike 2.0 License (https://creativecommons.org/licenses/by-sa/2.0/). Images 5, 7 and 9 used photos marked as being in the Public Domain using the CC0 1.0 Universal Public Domain Dedication (https://creativecommons.org/publicdomain/zero/1.0/). Image 6 used a photo taken by Christer Johansson, which is licensed under a Creative Commons Attribution 3.0 Unported License (https://creativecommons.org/licenses/by/3.0/deed.en).
Fig. 2
Fig. 2. Importance of explanatory variables identified through machine learning models.
The relative importance of the top 15 (of 39) explanatory variables in predicting speciation rate in 1000 XGBoost bootstrap replicates is plotted for complex models with maximum tree-depth of three a, versus simple models with maximum tree-depth of one b, with model precision indicated by R2. The vertical dashed line indicates the threshold of predicting speciation rate by chance expectation alone. Upper and lower importance quantiles (25% and 75%) estimated from 1000 model bootstraps are indicated with black horizontal bars. When interactions are accounted for, the relative importance of several variables shifts, and the R2 is improved.
Fig. 3
Fig. 3. Best-fitting relationships between continuous variables inferred as significant by XGBoost and speciation rate, as estimated by QuaSSE.
Variables are in order of ranked importance according to the full XGBoost model. It is important to consider that QuaSSE does not provide the exact relationship between variables and speciation rates, only the general trend. The reported model fits are those best-supported by the data. The cases with narrow modes are likely shaped by the inability of QuaSSE to account for hidden states and confounding correlations between variables. We present these as hypotheses to inform future research.

References

    1. Arakaki, M. et al. Contemporaneous and recent radiations of the world’s major succulent plant lineages. Proc. Natl Acad. Sci. USA108, 8379–8384 (2011). 10.1073/pnas.1100628108 - DOI - PMC - PubMed
    1. Hernández‐Hernández, T., Brown, J. W., Schlumpberger, B. O., Eguiarte, L. E. & Magallón, S. Beyond aridification: Multiple explanations for the elevated diversification of cacti in the new world succulent biome. N. Phytologist202, 1382–1397 (2014). 10.1111/nph.12752 - DOI - PubMed
    1. Guerrero, P. C., Majure, L. C., Cornejo-Romero, A. & Hernández-Hernández, T. Phylogenetic relationships and evolutionary trends in the cactus family. J. Heredity110, 4–21 (2019). 10.1093/jhered/esy064 - DOI - PubMed
    1. Gibson, A. C. & Nobel, P. S. The cactus primer. Harvard University Press (1986).
    1. Nobel, P. S. Cacti biology and uses. University of California Press (2002).

LinkOut - more resources