. 2024 Aug 21;15(1):7195.
doi: 10.1038/s41467-024-51644-8.

MEF2B C-terminal mutations enhance transcriptional activity and stability to drive B cell lymphomagenesis

Affiliations

MEF2B C-terminal mutations enhance transcriptional activity and stability to drive B cell lymphomagenesis

Chuanjiang Yu et al. Nat Commun. .

Abstract

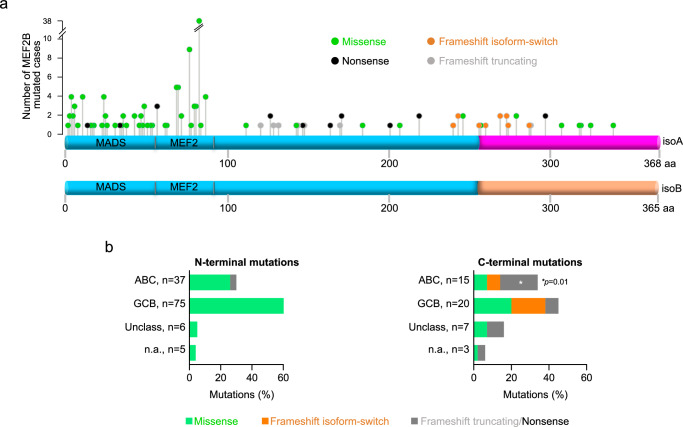
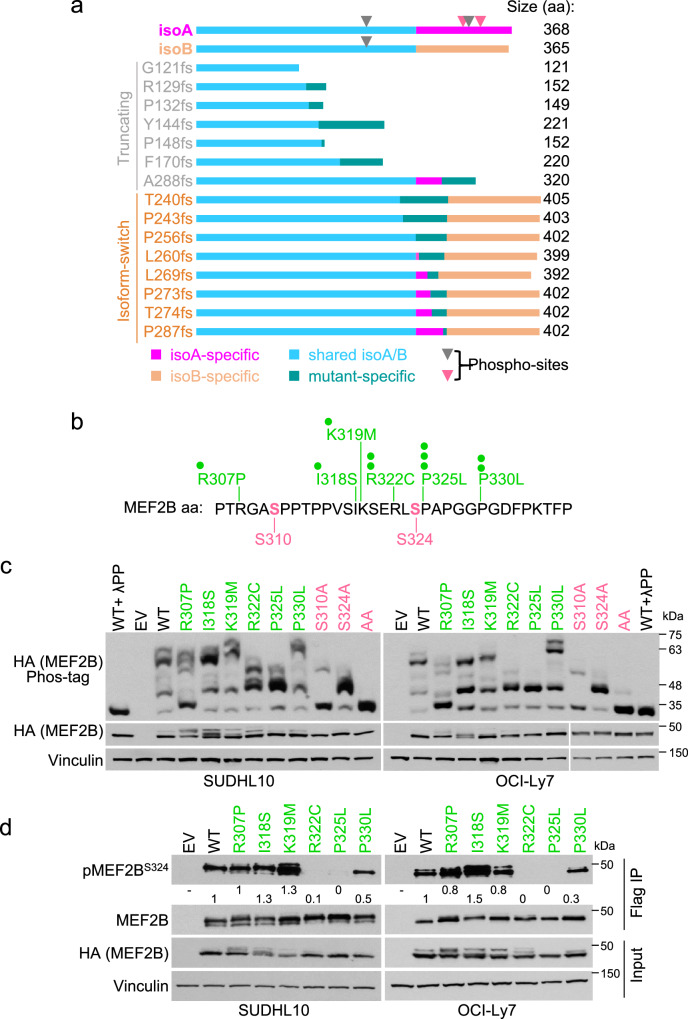
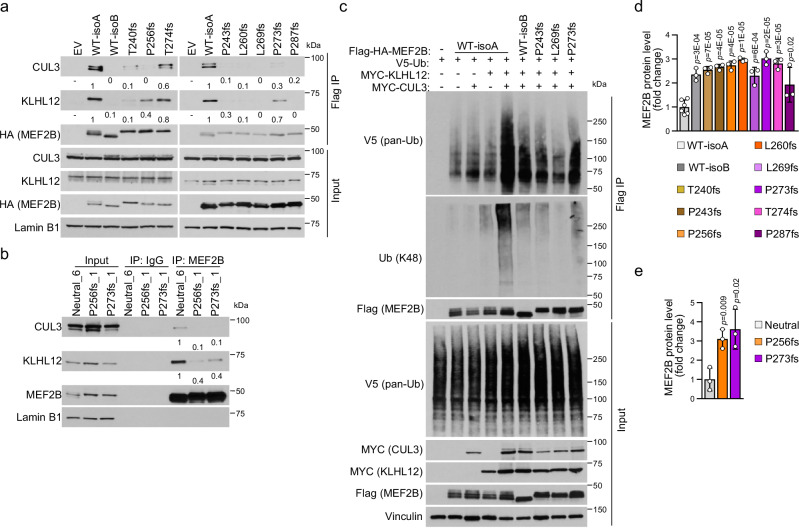
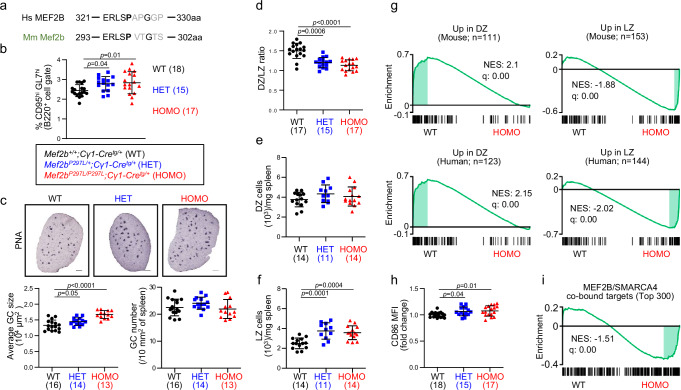
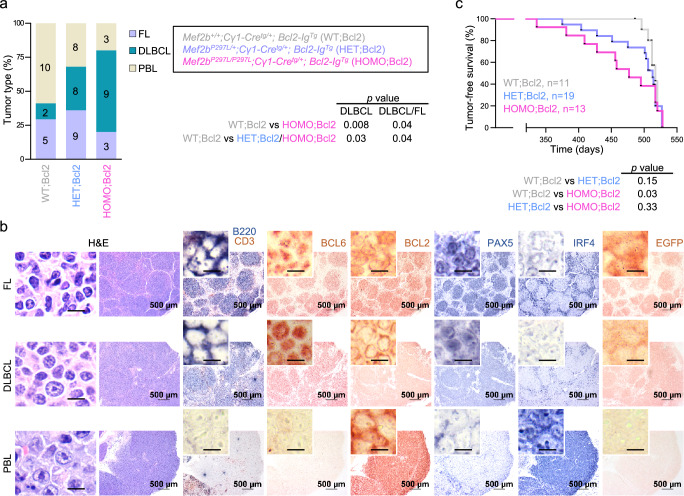
The myocyte enhancer factor 2B (MEF2B) transcription factor is frequently mutated in germinal center (GC)-derived B-cell lymphomas. Its ammino (N)-terminal mutations drive lymphomagenesis by escaping interaction with transcriptional repressors, while the function of carboxy (C)-terminal mutations remains to be elucidated. Here, we show that MEF2B C-tail is physiologically phosphorylated at specific residues and phosphorylation at serine (S)324 is impaired by lymphoma-associated mutations. Lack of phosphorylation at S324 enhances the interaction of MEF2B with the SWI/SNF chromatin remodeling complex, leading to higher transcriptional activity. In addition, these mutants show an increased protein stability due to impaired interaction with the CUL3/KLHL12 ubiquitin complex. Mice expressing a phosphorylation-deficient lymphoma-associated MEF2B mutant display GC enlargement and develop GC-derived lymphomas, when crossed with Bcl2 transgenic mice. These results unveil converging mechanisms of action for a diverse spectrum of MEF2B mutations, all leading to its dysregulation and GC B-cell lymphomagenesis.


Conflict of interest statement

The authors declare no competing interests.

Figures

Fig. 1
Fig. 1. Lymphoma-associated C-terminal mutations target the C-tail region of MEF2B isoform A.
a Distribution of MEF2B missense (green), nonsense (black), and frameshift mutations that are predicted to generate truncated proteins (truncating, gray) or proteins with an isoform B tail (isoform-switch, orange) in primary cases of DLBCL (147/1,412; 10.4%) and FL (16/142; 11.3%). The y-axis indicates the number of MEF2B mutated cases reported in–,. The bottom schemes represent MEF2B isoform-A (isoA) and -B (isoB) proteins, respectively. The mutations are aligned with the targeted amino acid in isoA. The distinct C-tails of isoA and isoB are displayed in purple and orange respectively. b Percentage of N-terminal and C-terminal MEF2B mutations in primary cases, grouped according to the Cell-Of-Origin classification (ABC, Activated B Cell-like; GCB, Germinal Center B cell-like; Unclass, unclassified). The *p value was measured by Fisher’s Exact test (two-tailed). Source data are provided as a Source Data file.
Fig. 2
Fig. 2. MEF2B isoform A is mainly phosphorylated at S310 and S324 in normal and malignant GC B cells.
a Phos-tag gel analysis of MEF2B phosphorylation in DLBCL cell lines and normal GC B cells isolated from human tonsil. Controls (MEF2B and Actin) were resolved on a Tris-Glycine gel. Actin was used as loading control; lambda phosphatase (λPP)-treated lysate was used as negative control for phosphorylation detection. b Schematic representation of MEF2B phosphorylation sites as identified by mass spectrometry (MS) analysis upon Flag and HA sequential immunoprecipitation (IP) in SUDHL10 cells expressing Flag-HA MEF2B WT-isoA and upon MEF2B IP in normal GC B cells isolated from human tonsil. Percentages associated to each phosphorylation site represent the fraction of phosphorylated peptides detected in normal GC B cells. c Phos-tag analysis of SUDHL10 DLBCL cell line that was engineered to express Flag-HA MEF2B WT-isoA or phosphorylation-deficient mutants T196A, S310A, T313A, S324A and S310A + S324A (AA). Controls (MEF2B and Vinculin) were resolved on a Tris-Glycine gel. Vinculin was used as loading control; λPP treated lysate was used as negative control for phosphorylation detection. d Flag (MEF2B) IP followed by immunoblotting (IB) to detect S324- or S310-phosphorylated MEF2B in SUDHL10 and OCI-Ly7 cells expressing Flag-HA MEF2B WT-isoA or phosphorylation-deficient mutants. Vinculin was used as loading control; λPP-treated lysate was used as negative control for phosphorylation detection. e MEF2B IP followed by IB to detect S324- or S310-phosphorylated MEF2B in nuclear extracts of SUDHL10 and OCI-Ly7 DLBCL cells, and normal GC B cells isolated from human tonsil. Lamin B1 was used as a nuclear fraction control; IgG IP was used as negative control. Asterisk, non-specific band. The experiments were repeated twice in (a) and (d); three times in (e); six times in (c) with similar results. Source data are provided as a Source Data file.
Fig. 3
Fig. 3. MEF2B C-terminal missense and frameshift mutations impair S324 phosphorylation.
a The scheme shows the amino acid alignment of MEF2B WT-isoA with MEF2B WT-isoB and the predicted truncated and isoform-switch mutants. The identified phosphorylation sites are marked by triangles (rose red, sites with phosphorylation >95%; gray, phosphorylation <1%). b Schematic representation of the phosphorylation region in MEF2B isoA aa sequence. Phosphorylated aa are labeled in rose red. Amino acid changes found in lymphoma cases are reported on the top using green dots, each representing one patient–,,. c Phos-tag analysis of MEF2B phosphorylation in SUDHL10 and OCI-Ly7 DLBCL cell lines that were engineered to express Flag-HA MEF2B WT-isoA, lymphoma-associated missense mutants (R307P, I318S, K319M, R322C, P325L and P330L) or phosphorylation-deficient mutants (S310A, S324A and S310A + S324A, labeled as AA). Controls (HA and Vinculin) were resolved on a Tris-Glycine gel. Vinculin was used as loading control; λPP-treated lysate was used as a negative control for phosphorylation detection. d Flag (MEF2B) IP followed by IB with phospho-specific pMEF2BS324 antibody in SUDHL10 and OCI-Ly7 cells that were engineered to express Flag-HA MEF2B WT-isoA or lymphoma-associated missense mutants (R307P, I318S, K319M, R322C, P325L and P330L). Vinculin was used as loading control. Quantifications were normalized to the immunoprecipitated MEF2B (HA). Fold changes were calculated relative to the MEF2B WT sample. The experiments displayed in (c) and (d) were repeated 4 times with similar results. Source data are provided as a Source Data file.
Fig. 4
Fig. 4. MEF2B interacts with the SWI/SNF complex.
a Detection of MEF2B/SMARCA4 interaction by MEF2B immunoprecipitation (IP) followed by immunoblotting (IB) using nuclear extracts of SUDHL10 cells or normal GC B cells isolated from human tonsil. Lamin B1 was used as a nuclear fraction control. Normal GC B cell samples are identical to those used in Fig. 2e. The experiment was repeated twice. b Heat maps showing the read density and distance plots displaying the distribution of MEF2B or SMARCA4 bound regions in relationship to each other closest peak, as detected in normal GC B cells by Cut&Run-seq analysis. In the heat maps, data is normalized to number of reads per bin/sum of all reads per bin (in millions). c Genomic binding profile of MEF2B and SMARCA4 at BCL6, CCND3, CXCR4, CD83, CD86 and CD79A loci, as detected by Cut&Run-seq analysis in normal GC B cells. Significantly bound regions that were recurrently detected in both biological replicates (2 independent donors) are displayed as bars under the read profiles. MEF2B/SMARCA4 overlapping bound regions are displayed as black bars at the bottom (MEF2B/SMARCA4 overlap). Genomic coordinates based on hg38. BPM, bins per million map reads. Source data are provided as a Source Data file.
Fig. 5
Fig. 5. Phosphorylation-deficient MEF2B mutants display enhanced binding affinity to SWI/SNF complex and increased transcriptional activity.
a Detection of MEF2B/SMARCA4 interaction by Flag (MEF2B) immunoprecipitation (IP) followed by immunoblotting (IB) from SUDHL10 cells expressing Flag-HA-MEF2B-WT-isoA or missense mutants (EL, S324E + P325L). Lamin B1, loading control. Quantifications were normalized to the immunoprecipitated MEF2B (HA). Fold changes relative to MEF2B-WT. b MEF2B IP followed by IB from isogenic OCI-Ly7 control (Neutral) and MEF2B missense mutant clones. IgG, IP negative control. Quantifications were normalized to the immunoprecipitated MEF2B. Fold changes relative to the neutral clones. c Luciferase activity driven by synthetic wild-type (3xMEF2-WT) or mutated (3xMEF2-Mut) MEF2 binding sites, as measured in HEK293T cells transfected with empty vector (EV) or plasmids expressing MEF2B-WT-isoA (n = 15, 5 experiments) or the missense mutants S324A (n = 15, 5 experiments), S324E (n = 6, 2 experiments), P325L (n = 15, 5 experiments), EL (n = 6, 2 experiments), R322C (n = 9, 3 experiments) and P330L (n = 9, 3 experiments). Data are shown as average fold change ± SD relative to MEF2B-WT-isoA of indicated independent experiments, each performed in triplicates. Significance assessed by two-tailed Mann-Whitney test. d Flag (MEF2B) IP followed by IB from SUDHL10 cells expressing Flag-HA-MEF2B-WT-isoA, MEF2B-WT-isoB or isoform-switch mutants. Lamin B1, loading control. Quantifications were normalized to the immunoprecipitated MEF2B (HA). Fold changes relative to MEF2B-WT-isoA. e MEF2B IP followed by IB from isogenic OCI-Ly7 control (Neutral) and MEF2B isoform-switch mutant clones. IgG, IP negative control. Quantifications were normalized to the immunoprecipitated MEF2B. Fold changes relative to the neutral clones. f Luciferase activity of synthetic WT or mutated 3xMEF2-luc reporter in HEK293T cells transfected with EV or plasmids expressing MEF2B-WT-isoA (n = 18, 6 experiments), -isoB (n = 18, 6 experiments) or isoform-switch mutants T240fs (n = 9, 3 experiments), P243fs (n = 9, 3 experiments), P256fs (n = 9, 3 experiments), L260fs (n = 9, 3 experiments), L269fs (n = 9, 3 experiments), P273fs (n = 6, 2 experiments), T274fs (n = 9, 3 experiments) and P287fs (n = 9, 3 experiments). Data shown as average ± SD relative to MEF2B-WT-isoA of indicated independent experiments, each performed in triplicates (two-tailed Mann-Whitney test). The experiments reported in (a) and (d) were repeated three times with similar results. Source data are provided as a Source Data file.
Fig. 6
Fig. 6. Stabilization of MEF2B C-terminal missense mutants by dissociation from the CUL3/KLHL12 complex.
a Detection of MEF2B/CUL3/KLHL12 interaction by MEF2B immunoprecipitation (IP) followed by immunoblotting (IB) from SUDHL10 and normal GC B cells. Lamin B1, nuclear fraction control. Asterisks, non-specific bands. GC B cell samples are same as in Fig. 2e. b Flag (MEF2B) IP followed by IB in SUDHL10 cells expressing Flag-HA-MEF2B-WT-isoA or missense mutants. Lamin B1, loading control. Quantifications were normalized to the immunoprecipitated MEF2B (HA). Fold changes relative to MEF2B-WT. Samples in the left panel are same as in Fig. 5a. c MEF2B IP followed by IB using nuclear extracts of isogenic OCI-Ly7 control (Neutral) and MEF2B missense mutant clones. IgG, IP negative control. Quantifications were normalized to the immunoprecipitated MEF2B. Fold changes were calculated relative to the neutral clones. Samples are same as in Fig. 5b. d Ubiquitination assay upon Flag (MEF2B) IP followed by IB of HEK293T cells co-transfected with expression vectors for Flag-HA-MEF2B-WT-isoA or missense mutants, and V5-Ub, Myc-KLHL12 and Myc-CUL3. Total ubiquitin and K48 ubiquitin chain type were detected. The samples derive from the same experiment but different gels for Ub(K48) in the IP samples and V5 (pan-Ub) in the input samples were processed in parallel. e MEF2B relative expression level, upon CHX treatment (12 h) in SUDHL10 cells expressing Flag-HA-MEF2B-WT-isoA (n = 13) or the missense mutants S324A (n = 6), S324E (n = 3), P325L (n = 8), EL (n = 3), R322C (n = 3) and P330L (n = 3). Numbers (n) refer to independent experiments. Complete CHX pulse-chase experiment in Supplementary Fig. 7b. Average fold change ± SD relative to MEF2B-WT-isoA (two-tailed unpaired T test). f MEF2B relative expression level, upon CHX treatment (12 h) in isogenic OCI-Ly7 control (Neutral; n = 6) and MEF2B-P325L mutant (n = 6) clones. Complete CHX pulse-chase experiment in Supplementary Fig. 7c. Average fold change ± SD relative to neutral clones of two independent experiments (3 neutral compared to 3 P325L clones in each experiment; two-tailed unpaired T test). The experiment in (a), (b), and (d) were repeated three times with similar results. Source data are provided as a Source Data file.
Fig. 7
Fig. 7. Stabilization of MEF2B C-terminal isoform-switch mutants by dissociation from the CUL3/KLHL12 complex.
a Detection of MEF2B/CUL3/KLHL12 interaction by Flag (MEF2B) immunoprecipitation (IP) using nuclear extracts of SUDHL10 cells expressing Flag-HA-MEF2B-WT-isoA, -isoB or isoform-switch mutants. Lamin B1 was used as loading control. Quantifications were normalized to the immunoprecipitated MEF2B (HA). Fold changes were calculated relative to the MEF2B WT-isoA sample. b MEF2B IP followed by immunoblotting (IB) using nuclear extracts of isogenic OCI-Ly7 clones including controls (Neutral) and cells expressing MEF2B isoform-switch (P256fs and P273fs) mutants. IgG IP was used as negative control. Quantifications were normalized to the immunoprecipitated MEF2B. Fold changes were calculated relative to the neutral clones. Samples are the same as in Fig. 5e. c Ubiquitination assay upon Flag (MEF2B) IP followed by IB using total extracts of HEK293T cells co-transfected with expression vectors for Flag-HA-MEF2B-WT-isoA, -isoB or isoform-switch mutants (P243fs, L269fs, and P273fs), and V5-Ub, Myc-KLHL12 and Myc-CUL3. Total ubiquitin and K48 ubiquitin chain type were detected. The samples derive from the same experiment but different gels for Ub(K48), in the IP samples, and V5 (pan-Ub), in the input samples, were processed in parallel. d Relative MEF2B protein levels, as measured upon CHX treatment for 12 h in SUDHL10 cells expressing Flag-HA-MEF2B-WT-isoA (n = 6) or isoform-switch mutants (n = 3 each). Numbers (n) refer to independent experiments. The complete CHX pulse-chase experiment is reported in Supplementary Fig. 8d. Data shown as average fold change ± SD compared to MEF2B-WT-isoA (two-tailed unpaired T test). e MEF2B relative expression level, as measured upon CHX treatment for 12 h in isogenic OCI-Ly7 control (Neutral; n = 3) and MEF2B isoform-switch mutant (n = 3 each) clones. Complete CHX pulse-chase experiment in Supplementary Fig. 8e. Data shown as average fold change ± SD relative to neutral clones (two-tailed unpaired T test). The experiments in (a) and (c) were repeated three times with similar results. Source data are provided as a Source Data file.
Fig. 8
Fig. 8. The Mef2bP297L lymphoma-associated mutant enhances GC formation in mice.
a Amino acid sequence alignment of human MEF2B S324 phosphorylation region with the orthologous mouse Mef2b sequence. Human P325 and the conserved murine P297 aa are displayed in bold. b Percentage of splenic GC B cells (B220+/GL7hi/CD95hi) in Mef2b+/+;Cγ1-Cretg/+ (WT), Mef2bP297L/+;Cγ1-Cretg/+ (HET) and Mef2bP297L/P297L;Cγ1-Cretg/+ (HOMO) mice, as measured by flow cytometry 10 days post-SRBC immunization. c Top, immunohistochemistry for the GC marker PNA on representative spleen sections. Scale bars, 500 μm. Bottom, average GC size and numbers, as measured by quantification of PNA staining on spleen tissue sections in a subset of the mice displayed in (b). d Ratios between dark zone (DZ: CXCR4hi/CD86lo) and light zone (LZ: CXCR4lo/CD86hi) GC B cells (B220+/GL7hi/CD95hi) from WT, HET and HOMO mice. e DZ and f LZ B cell numbers normalized by spleen weight in a subset of the mice displayed in (d). g Gene set enrichment analysis (GSEA) in WT versus HOMO GC B cell RNA-seq data using previously reported mouse and human DZ versus LZ gene signatures. NES, normalized enrichment score. h CD86 mean fluorescence intensity (MFI) in GC B cells (B220+/GL7hi/CD95hi) measured by flow cytometry analysis and displayed as fold change relative to WT mice. i GSEA in WT versus HOMO GC B cell RNA-seq data using the top 300 genes displaying co-binding of MEF2B and SMARCA4 in their regulatory regions as identified by Cut&Run-seq analysis in human GC B cells isolated from tonsil tissue. The enrichment is measured by ranking all the assessed transcripts in the RNA-seq profiles and evaluating any distribution bias along the ranked gene list. NES, normalized enrichment score. Dot plots display average ± SD for the number of animals reported in parentheses. The p values in dot plots were determined by one-way ANOVA with Dunnett’s Multiple Comparison Test. Source data are provided as a Source Data file.
Fig. 9
Fig. 9. Expression of Mef2bP297L mutant promotes GC B cell lymphomagenesis in mice.
a Distribution of B cell lymphomas across genotypes. Colored bars indicate different diagnoses, namely follicular lymphoma (FL), diffuse large B cell lymphoma (DLBCL), and plasmablastic lymphoma (PBL). The numbers in the bars refer to the number of tumors (note that some mice bear more than one tumor type). The p values were determined by Fisher’s Exact test (two-tailed). b H&E staining and immunohistochemical analysis of selected markers in representative tumors from mice diagnosed with FL, DLBCL, or PBL. EGFP is the tracking marker of Mef2bP297L. High magnification scale bar, 10 μm. These immunohistochemical analyses were performed for all tumors. c Tumor-free survival curve. The p values were determined by Gehan-Breslow-Wilcoxon Test (two-tailed) across genotypes. Source data are provided as a Source Data file.

References

    1. Swerdlow SH, et al. WHO Classification of Tumours of Haematopoietic and Lymphoid Tissues (IARC Publications 2017).
    1. Sehn, L. H. & Salles, G. Diffuse large B-cell lymphoma. N. Engl. J. Med.384, 842–858 (2021). 10.1056/NEJMra2027612 - DOI - PMC - PubMed
    1. Casulo, C. et al. Early relapse of follicular lymphoma after rituximab plus cyclophosphamide, doxorubicin, vincristine, and prednisone defines patients at high risk for death: an analysis from the National Lymphocare Study. J. Clin. Oncol.33, 2516–2522 (2015). 10.1200/JCO.2014.59.7534 - DOI - PMC - PubMed
    1. Basso, K. & Dalla-Favera, R. Germinal centers and B cell lymphomagenesis. Nat. Rev. Immunol.15, 172–184 (2015). 10.1038/nri3814 - DOI - PubMed
    1. Victora, G. D. & Nussenzweig, M. C. Germinal centers. Annu. Rev. Immunol.40, 413–442 (2022). - PubMed

Substances