. 2024 Dec;31(12):1679-1694.
doi: 10.1038/s41418-024-01367-6. Epub 2024 Aug 24.

Gelsolin alleviates rheumatoid arthritis by negatively regulating NLRP3 inflammasome activation

Affiliations

Gelsolin alleviates rheumatoid arthritis by negatively regulating NLRP3 inflammasome activation

Jiyeon Lee et al. Cell Death Differ. 2024 Dec.

Abstract

Despite numerous biomarkers being proposed for rheumatoid arthritis (RA), a gap remains in our understanding of their mechanisms of action. In this study, we discovered a novel role for gelsolin (GSN), an actin-binding protein whose levels are notably reduced in the plasma of RA patients. We elucidated that GSN is a key regulator of NLRP3 inflammasome activation in macrophages, providing a plausible explanation for the decreased secretion of GSN in RA patients. We found that GSN interacts with NLRP3 in LPS-primed macrophages, hence modulating the formation of the NLRP3 inflammasome complex. Reducing GSN expression significantly enhanced NLRP3 inflammasome activation. GSN impeded NLRP3 translocation to the mitochondria; it contributed to the maintenance of intracellular calcium equilibrium and mitochondrial stability. This maintenance is crucial for controlling the inflammatory response associated with RA. Furthermore, the exacerbation of arthritic symptoms in GSN-deficient mice indicates the potential of GSN as both a diagnostic biomarker and a therapeutic target. Moreover, not limited to RA models, GSN has demonstrated a protective function in diverse disease models associated with the NLRP3 inflammasome. Myeloid cell-specific GSN-knockout mice exhibited aggravated inflammatory responses in models of MSU-induced peritonitis, folic acid-induced acute tubular necrosis, and LPS-induced sepsis. These findings suggest novel therapeutic approaches that modulate GSN activity, offering promise for more effective management of RA and a broader spectrum of inflammatory conditions.


Conflict of interest statement

Competing interests: The authors declare no competing interests. Ethics approval: This study did not involve any human participants. Mouse studies were conducted in accordance with the protocols approved by the Department of Laboratory Animal Resources Ethical Committee of Yonsei University College of Medicine and the President of Nippon Medical School.

Figures
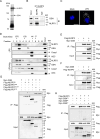
Fig. 1
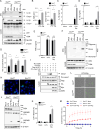
Fig. 1. Gelsolin (GSN) interacts with NLRP3 in lipopolysaccharide (LPS)-primed macrophages.
Representative images of an Oriole®-stained gel (A) and immunoblots of immunoprecipitates (B) after incubation of LPS (100 ng/mL, 3 h)-primed murine BMDMs with an anti-NLRP3 antibody. C In situ proximity ligation assay (PLA) of GSN–NLRP3 complexes in LPS (100 ng/mL, 3 h)-primed BMDMs. GSN–NLRP3 PLA signals, white; nuclei, blue. Scale bar: 10 μm. D Immunoblots of cell lysate in LPS (500 ng/mL, 3 h)-primed murine BMDMs stimulated with nigericin (5 μM, 45 min) and fractionated using gel-filtration chromatography. Immunoblots of co-immunoprecipitated proteins after incubation with an anti-Flag (E, G, H) or anti-Myc (F) antibody in HEK293T cells transiently transfected with Flag-NLRP3, Flag-NLRP3LRR, Flag-NLRP3NACHT, Flag-NLRP3PYD, Myc-GSN, Myc-GSNN’, and Myc-GSNC’. Data shown in (B, C, and EH) are representative of at least three independent experiments.
Fig. 2
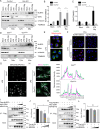
Fig. 2. GSN deficiency results in excessive NLRP3 inflammasome activation and pyroptotic cell death.
Immunoblots (A) and quantification (B) of supernatant (S/N) and cell lysates (Lysate) of Gsnfl/fl and GsnΔMye BMDMs left untreated, primed with LPS (500 ng/mL, 3 h), and primed and stimulated with nigericin (5 μM, 45 min). ELISA of IL-1β (C), IL-18 (D), and TNFα (E) in the supernatant of Gsnfl/fl and GsnΔMye BMDMs left untreated, primed with LPS (500 ng/mL, 3 h), and primed and stimulated with nigericin (5 μM, 45 min) (n = 3). NS, not significant. Immunoblots (F) and quantification (G) of ASC oligomerization of DSS cross-linked pellets and lysates of Gsnfl/fl and GsnΔMye BMDMs left untreated, primed with LPS (500 ng/mL, 3 h), and primed and stimulated with nigericin (5 μM, 45 min). H Immunofluorescence staining of ASC in LPS (100 ng/mL, 3 h)-primed murine BMDMs stimulated with nigericin (5 μM, 15 min). Nuclei were counterstained with Hoechst 34580. ASC, green; nuclei, blue. Scale bar: 10 μm. I Immunoblots S/N and lysate of HEK293T cells transiently transfected with Myc-GSN, HA-ASC, Flag-NLRP3, and Pro-casp1-His and stimulated with nigericin (20 μM, 45 min). J Immunoblots of full length and cleaved GSDMD in lysate of Gsnfl/fl and GsnΔMye BMDMs left untreated, primed with LPS (500 ng/mL, 3 h), and primed and stimulated with nigericin (5 μM, 45 min). K LDH release into the supernatants of Gsnfl/fl and GsnΔMye BMDMs left untreated, primed with LPS (500 ng/mL, 3 h), and primed and stimulated with nigericin (5 μM, 45 min) (n = 3). Representative IncuCyte images (L) and quantification (M) of CytotoxGreen+ dead cells in Gsnfl/fl and GsnΔMye BMDMs left untreated, primed with LPS (500 ng/mL, 3 h), and primed and stimulated with nigericin (5 μM, 45 min). Images were acquired at ×200 magnification. Scale bar: 50 μm (n = 6). Data are presented as mean ± SD (CE) or mean ± SEM (K, M). Student’s t test, *P < 0.05, ***P < 0.001 (B, C, I). Data shown in (A, F, H, I, J) are representative of at least three independent experiments.
Fig. 3
Fig. 3. GSN depletion promotes NLRP3 translocation to mitochondria.
AC Immunoblots of the cytosolic (Cyto) and mitochondrial (Mito) fractions in control and Gsn-KO J774.1 cell left untreated, primed with LPS (500 ng/mL, 3 h), and primed and stimulated with nigericin (5 μM, 45 min). The intensity of immunoblot bands was quantified using the ImageJ software (B, C) (n = 4). ND, not detected. D Immunoblots of Cyto and Mito fractions in Gsnfl/fl and GsnΔMye BMDMs left untreated, primed with LPS (500 ng/mL, 3 h), and primed and stimulated with nigericin (5 μM, 45 min). E Immunostaining of NLRP3 and labeling of mitochondria and nuclei in control and LPS (100 ng/mL, 3 h)-primed Gsn-KO J774.1 cells. F In situ PLA of NLRP3-MAVS and NLRP3-MFN2 complexes in control and LPS (100 ng/mL, 3 h)-primed Gsn-KO J774.1 cells. PLA signals, red; nuclei, blue. G In situ PLA of NLRP3-MAVS complexes in Gsnfl/fl and GsnΔMye peritoneal resident macrophages primed with LPS (100 ng/mL, 3 h). PLA signals, white. H Immunofluorescence of co-staining of MAVS and NLRP3 in Gsnfl/fl and GsnΔMye peritoneal resident macrophages primed with LPS (100 ng/mL, 3 h). The graphs on the right show the fluorescence intensity of MAVS (pink) and NLRP3 (green), as indicated by the white dotted line arrows in the photos on the left. IL Immunoblots of co-immunoprecipitated proteins following incubation with an anti-Flag antibody in HEK293T cells transiently transfected with Myc-GSN, Flag-NLRP3, and MAVS-His. The intensity of immunoblot bands was quantified using the ImageJ software (J, L) (n = 3). NS, not significant. Data are presented as mean ± SEM (B, C, J, L). Student’s t test, *P < 0.05, **P < 0.01 (B, C, J). Data shown in (A, EI, K) are representative of at least three independent experiments. Scale bar; 10 μm (EH).
Fig. 4
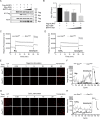
Fig. 4. Intracellular calcium concentration increased in the absence of GSN.
A, B Immunoblots of co-immunoprecipitated proteins after incubation with an anti-Flag antibody in HEK293T cells transiently transfected with Myc-GSN and Flag-NLRP3 in the presence or absence of BAPTA-AM (A). The intensity of immunoblot bands was quantified using the ImageJ software (B) (n = 3). Calcium influx in LPS-primed peritoneal resident macrophages in response to nigericin (20 μM) (C) or CaCl2 (1 mM) (D) stimulation was analyzed using a microplate reader. Ca2+ ionophore ionomycin (5 μM) was added after 25 min (n = 10). Representative confocal microscopy images (E, G) and quantification (F, H) of calcium influx in LPS-primed peritoneal resident macrophages in response to nigericin (20 μM) (E, F) or CaCl2 (1 mM) (G, H) stimulation. Ca2+ ionophore ionomycin (5 μM) was added after 30 min, and cells were further imaged for 10 min. Images were acquired at ×200 magnification. Scale bar: 50 μm. Data are presented as mean ± SEM (BD). Student’s t test, *P < 0.05 (B). Data shown in (A) are representative of at least three independent experiments.
Fig. 5
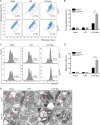
Fig. 5. GSN ablation promotes mitochondrial dysfunction.
Representative dot plots (A) and histograms (C) of flow cytometry and quantification (B, D) of damaged mitochondria (surrounded by black lines in A) (n = 4) and MitoSOX+ mitochondria (indicated by black bars in C) (n = 3) in Gsnfl/fl and GsnΔMye BMDMs left untreated, primed with LPS (500 ng/mL, 3 h), and primed and stimulated with nigericin (10 μM, 1 h) (A, B) or (20 μM, 45 min) (C, D). E Representative TEM images of mitochondria from Gsnfl/fl and GsnΔMye peritoneal resident macrophages left untreated, primed with LPS (500 ng/mL, 3 h), and primed and stimulated with nigericin (5 μM, 45 min). To avoid bias, at least 10 images were acquired per sample. Red arrows indicate mitochondria. The images were acquired at ×72.0 k magnification. Scale bar: 5 μm. Data are presented as mean ± SEM (B, D). Student’s t test, **P < 0.01, ***P < 0.001 (B, D). Data shown in (A, C) are representative of at least three independent experiments.
Fig. 6
Fig. 6. Extracellular GSN secretion decreases in rheumatoid arthritis, and GSN deficiency exacerbates the condition.
A Representative images of the paws of Gsnfl/fl and GsnΔMye mice that were intraperitoneally injected with complete Freund’s adjuvant. B Representative hematoxylin and eosin-stained images of the paws of Gsnfl/fl and GsnΔMye mice at day 8 after injection with complete Freund’s adjuvant or incomplete Freund’s adjuvant. Scale bar: 200 μm. CE Joint swelling was assessed by measuring ankle (C) and foot pad (D) thickness. E The severity of arthritis was graded on a scale of 0–4. F Immunoblots for pGSN in the plasma of Gsnfl/fl and GsnΔMye mice that were intraperitoneally injected with complete Freund’s adjuvant or incomplete Freund’s adjuvant. ELISA of pGSN (G) and IL-1β (H) in the plasma of Gsnfl/fl and GsnΔMye mice that were intraperitoneally injected with complete Freund’s adjuvant or incomplete Freund’s adjuvant. I Immunoblots of the supernatant (S/N) and cell lysates (Lysate) of Gsnfl/fl and GsnΔMye BMDMs left untreated, primed with LPS (500 ng/mL, 3 h), and primed and stimulated with nigericin (2 μM, 5 μM, and 20 μM for 45 min). J Immunoblots of supernatant (S/N) and cell lysates (Lysate) of control J774.1 cells left untreated, primed with LPS (500 ng/mL, 3 h), and primed and stimulated with nigericin (2 μM, 5 μM, and 20 μM for 45 min). K Immunoblots of co-immunoprecipitated proteins after subjecting HEK293T cells that were transiently transfected with Flag-NLRP3 and Myc-pGSN to incubation with an anti-Flag antibody. Data are presented as mean ± SEM (CE) or mean ± SD (G, H). n = 3–4 (AH). Two-way ANOVA followed by additional validation using Bonferroni method (CE). Student’s t test (G, H). *P < 0.05 **P < 0.01 ***P < 0.001. Data shown in (K) are representative of at least three independent experiments.
Fig. 7
Fig. 7. GSN deficiency aggravates immunopathologic responses in vivo.
A Quantification of infiltrated peritoneal exudate cells (PECs) in Gsnfl/fl and GsnΔMye mice that were intraperitoneally injected with MSU crystals or sterile PBS. Representative dot plots of flow cytometry (B); quantification of the percentage (C) and number (D) of infiltrated neutrophils (CD11b+Ly6G+Ly6Clo cells) in the peritoneal cavities of Gsnfl/fl and GsnΔMye mice that were intraperitoneally injected with MSU crystals or sterile PBS. E ELISA for IL-1β in the peritoneal lavage fluid of Gsnfl/fl and GsnΔMye mice that were intraperitoneally injected with MSU crystals or sterile PBS. Percentage of body weight loss (F) and blood urea nitrogen (BUN) concentration in the sera (G) of Gsnfl/fl and GsnΔMye mice that were intraperitoneally injected with folic acid (n = 6 mice per group). H Representative images of immunofluorescence from the kidneys of Gsnfl/fl and GsnΔMye mice at 40 h after folic acid treatment. Scale bar: 50 μm. I Representative hematoxylin and eosin-stained images of kidneys from Gsnfl/fl and GsnΔMye mice at 40 h after folic acid treatment. Scale bar: 20 μm. ELISA for plasma IL-1β (J), peritoneal lavage fluid (PF) IL-1β (K), plasma TNFα (L), peritoneal lavage fluid (PF) TNFα (M) of Gsnfl/fl and GsnΔMye mice that were intraperitoneally injected with 20 mg/kg LPS or sterile PBS (n = 3–4). NS, not significant. N Survival of Gsnfl/fl (n = 12) and GsnΔMye (n = 16) mice that were intraperitoneally injected with 10 mg/kg LPS or sterile PBS (n = 3 for each of Gsnfl/fl and GsnΔMye). Data are presented as mean ± SEM (A, C, D) or mean ± SD (EG, JM). n = 3–6 (AE). Student’s t test, *P < 0.05 **P < 0.01, ***P < 0.001 (A, CG, J, K). Log-rank test, *P < 0.05 (N).

References

    1. Scott DL, Wolfe F, Huizinga TW. Rheumatoid arthritis. Lancet. 2010;376:1094–108. - PubMed
    1. Smolen JS, Aletaha D, Barton A, Burmester GR, Emery P, Firestein GS, et al. Rheumatoid arthritis. Nat Rev Dis Primers. 2018;4:18001. - PubMed
    1. Nag S, Larsson M, Robinson RC, Burtnick LD. Gelsolin: the tail of a molecular gymnast. Cytoskeleton. 2013;70:360–84. - PubMed
    1. Sun HQ, Yamamoto M, Mejillano M, Yin HL. Gelsolin, a multifunctional actin regulatory protein. J Biol Chem. 1999;274:33179–82. - PubMed
    1. Osborn TM, Verdrengh M, Stossel TP, Tarkowski A, Bokarewa M. Decreased levels of the gelsolin plasma isoform in patients with rheumatoid arthritis. Arthritis Res Ther. 2008;10:R117. - PMC - PubMed