. 2024 Aug 24;15(1):7288.
doi: 10.1038/s41467-024-51859-9.

Unbiased discovery of cancer pathways and therapeutics using Pathway Ensemble Tool and Benchmark

Affiliations

Unbiased discovery of cancer pathways and therapeutics using Pathway Ensemble Tool and Benchmark

Luopin Wang et al. Nat Commun. .

Abstract

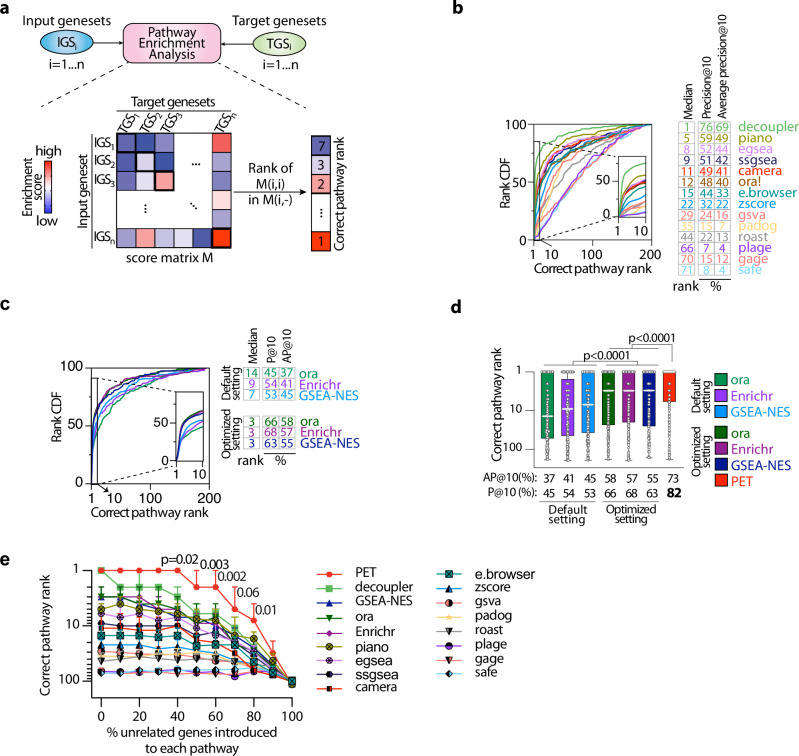
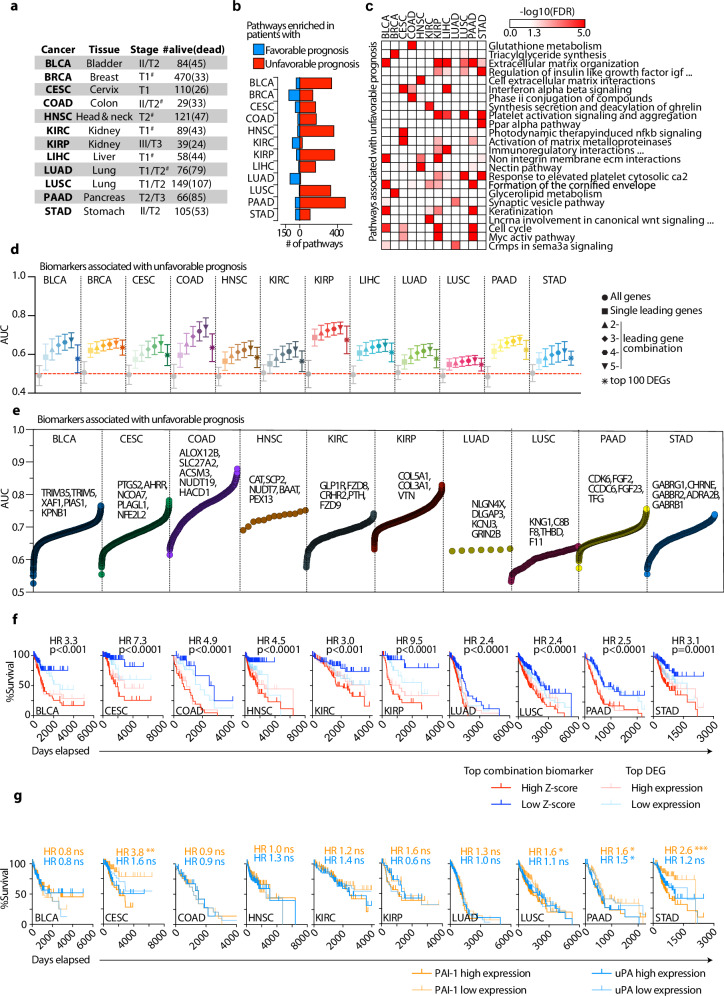
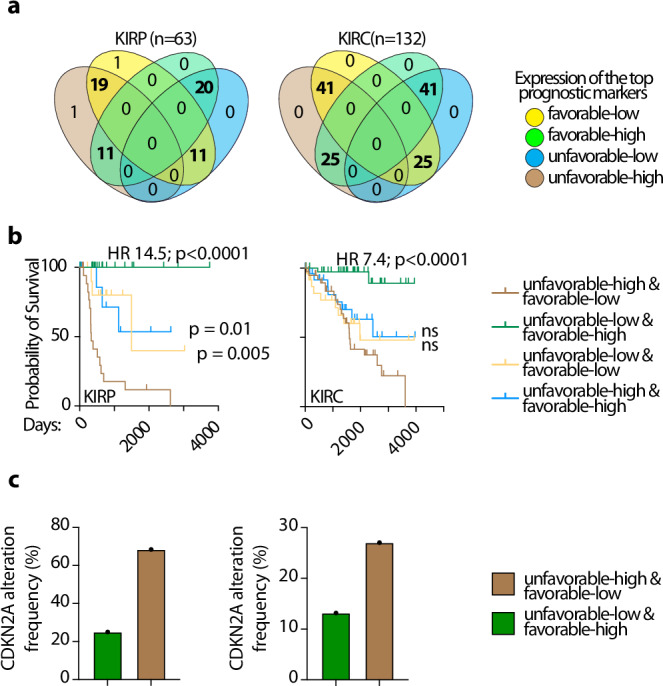
Correctly identifying perturbed biological pathways is a critical step in uncovering basic disease mechanisms and developing much-needed therapeutic strategies. However, whether current tools are optimal for unbiased discovery of relevant pathways remains unclear. Here, we create "Benchmark" to critically evaluate existing tools and find that most function sub-optimally. We thus develop the "Pathway Ensemble Tool" (PET), which outperforms existing methods. Deploying PET, we identify prognostic pathways across 12 cancer types. PET-identified prognostic pathways offer additional insights, with genes within these pathways serving as reliable biomarkers for clinical outcomes. Additionally, normalizing these pathways using drug repurposing strategies represents therapeutic opportunities. For example, the top predicted repurposed drug for bladder cancer, a CDK2/9 inhibitor, represses cell growth in vitro and in vivo. We anticipate that using Benchmark and PET for unbiased pathway discovery will offer additional insights into disease mechanisms across a spectrum of diseases, enabling biomarker discovery and therapeutic strategies.


Conflict of interest statement

The authors declare no competing interests.

Figures

Fig. 1
Fig. 1. Benchmark for evaluating and optimizing existing pathway analysis methods.
a Schematic representation of Benchmark for each pathway analysis method. For every input geneset (IGSi), the outputs, of pathway enrichment analysis against all target genesets (TGSi) are recorded in the score matrix M. Benchmark is created such that TGSi is the most related geneset to IGSi compared to all other TGSs. Thus, the rank of diagonal entries in M represent how well the correct genesets are scored for each IGS. The best score is 1. b, c Cumulative distribution function (CDF) plots of correct pathway ranks comparing indicated pathway analysis methods on shRNA-seq genesets. Median ranks for correct pathways, the fraction of correct pathways among top 10 reported pathways (precision@10/P@10, and average precision@10/AP@10) are shown. d Plots showing the correct pathway ranks of the indicated methods in shRNA-seq genesets. Boxes span from the first to the third quartile, with the median highlighted, and whiskers covering the minimum to maximum values. The precision statistics of each method at finding the correct pathway amongst reported pathways are reported below each bar. Target genesets in bd were defined as the top 200 upregulated genes by DESeq2 in K562 cells; input genesets in bd for default and optimized settings were extracted using signal2noise (default setting of GSEA) and DESeq2 in HepG2 cells, respectively. e Plots showing the performance of multiple methods as increasing percentage of unrelated random genes (“noise”) are introduced to target genesets. This evaluates the robustness of methods to inaccuracies (or noise) in target genesets. Lines and error bars show median +95% confidence interval at each noise level. *p < 0.05; **p < 0.01; ****p < 0.0001 by two-sided Wilcoxon rank sum test corrected for multiple hypothesis. ora! and ora are essentially identical, with the only difference being that they are implemented using different programming languages. Specifically, ora! is implemented in R by egsea, while ora is implemented in Python by PET. Source data are provided as a Source Data file.
Fig. 2
Fig. 2. PET identifies pathways and gene combinations associated with unfavorable prognosis.
a Cancers used in this study, along with tissue type, pathological stage (roman numerals) or pathological primary tumor TNM T score (e.g. T1, T2, T3) and number of samples. BLCA bladder carcinoma, BRCA Breast invasive carcinoma, CESC Cervical squamous cell carcinoma, COAD Colon adenocarcinoma, HNSC Head and Neck squamous cell carcinoma, KIRC Kidney renal clear-cell carcinoma, KIRP Kidney renal papillary cell carcinoma, LIHC Liver hepatocellular carcinoma, LAUD Lung adenocarcinoma, LUSC Lung squamous cell carcinoma, PAAD Pancreatic adenocarcinoma, STAD Stomach adenocarcinoma. To adjust for confounders, samples from later stages of diseases have also been included in cancers denoted by #. b Plot showing the number of significantly enriched pathways identified using PET among >1000 MSigDB canonical pathways in patients with favorable (blue) or unfavorable (red) prognosis in the indicated cancers. c Top pathways from each cancer associated with unfavorable survival. FDR values are from PET. d Area under the curve (AUC) distribution of indicated sets used to predict deceased status in each cancer type. Leading genes were selected from top 20 significant pathways associated with unfavorable prognosis. DEGs, differentially expressed genes; error bars show mean ± s.d. AUCs of leading gene combinations are higher than all genes and the AUCs of 5-gene combinations are higher than individual leading genes (Wilcoxon rank sum test p-value < 1e−9) (Supplementary Data 2d). e Elbow plots showing significant AUCs (low to high) from all 1–5 leading gene combinations. Statistics were based on FDR-adjusted logrank test of Kaplan–Meier (KM) survival curves. BRCA and LIHC did not yield any significant unfavorable predictors. KM plots showing of the top combination biomarker (darker lines in f), the top DEG (lighter lines in f) of unfavorable survival, PAI-1 expression (orange lines in g) and uPA expression (blue lines in g) to stratify overall survival. Samples in f and g were evenly split into two groups according to z-score/expression values of the indicated biomarker. Hazard ratio (HR) and logrank test p-values are reported. *p < 0.01; **p < 0.001; ***p < 0.0001. See Supplementary Fig. S4 for information on favorable biomarkers. Source data are provided as a Source Data file.
Fig. 3
Fig. 3. Juxtaposition of favorable and unfavorable prognostic biomarkers offers precise overall survival stratification.
a Venn diagrams showing the distribution of patients with kidney renal papillary cell carcinoma (KIRP) (left) and kidney renal clear cell carcinoma KIRC (right) based on expression of the top favorable (labeled in Supplementary Fig. S4e) and the top unfavorable (labeled in Fig. 2e) combination prognostic markers on RNA-seq from tumor samples. b Kaplan–Meier (KM) overall survival curves for 4 subgroups of KIRP or KIRC patients whose tumors express indicated combination of prognostic biomarkers. The four subgroups are highlighted with a bold font in a. Hazard ratio (HR) and logrank test p-values denote comparisons with the lines in red. ns not significant; *p < 0.05; **p < 0.01; ***p < 0.001; ****p < 0.0001. c Plots showing the fraction of KIRP (left) and KIRC (right) tumors which have alterations (methylation or copy number loss) in CDKN2A in each group. Source data are provided as a Source Data file.
Fig. 4
Fig. 4. PET-derived prognostic pathways guide drug repurposing.
a Schematic of drug screening aims; computational screen searches for drugs that upregulate expressions of genes from pathways with favorable prognosis and downregulate expressions of genes from pathways with unfavorable prognosis. b Elbow plots showing the significance of overlap between drug up (or down) regulated genes with leading genes from pathways with favorable (or unfavorable) prognostic potential. Drugs are sorted based on the significance (see Methods). Top two drugs for each cancer type are highlighted. c Sankey plot showing top pathways associated with unfavorable prognosis for each cancer type on the left and top two predicted drugs that demote expression of genes in indicated pathway on the right. The thicknesses of links are proportional to the significance of the pathway (E-value > 5; left; see Methods) or the number of genes affected by drug (right). Only drugs that have a significant impact on the top prognosis pathways for each cancer are displayed. As a result, cancers without drugs affecting their top predicted prognosis pathways are not displayed. Source data are provided as a Source Data file.
Fig. 5
Fig. 5. Predicted CDK2/9 inhibition restricts the growth of cervical and bladder cancers in vitro and in vivo.
a Plots showing the survival rate, measured by CCK-8 assay, of cervical (Hela) and bladder (T24 and UMUC3) cancer cell lines treated with different concentration of vehicle or indicated drugs for 72 h. The selective targets of CDK inhibitors are shown in parenthesis. Mean +/− sem from n > 3 biological replicates. b Plot showing expression of the CDK9 gene versus the unfavorability score for each bladder cancer cell line in the CCLE database. The color scale represents the IC50 values reported by the GDSC database for the CDK9-specific inhibitor CDK9_5038. Cell lines for which IC50 values are not available are highlighted in gray. The Spearman correlation value and corresponding p-value are shown in red. The center line and error bars indicate the trend line and 95% confidence interval. Selected cell lines are labeled. c Heatmap showing differentially expressed genes (DEGs; 3-fold at adjusted p-value < 0.05) between DMSO or CCT068127 (1uM) treated T24 cells for 48 h in n = 3 independent biological replicates. GSEA plots showing enrichment of genes repressed by the CDK4/6 inhibitor Palbociclib (top) or genes repressed by the CDK9 inhibitor VIP152 (bottom) in T24 cells treated 48 h with the CDK2/9 inhibitor CCT068127 (1 uM) or DMSO control. Palbociclib (SRP404373) or VIP152 inhibited genes are publicly sourced. d GSEA plot showing enrichment of transcriptomes of CCT068127 (1 uM) or DMSO treated T24 cells in favorable (top) or unfavorable (bottom) PET identified prognosis genes in bladder cancer. Shown are the FDR value and normalized enrichment score (NES). e Schematic of xenograft experiment and treatment plan with 30 mg/kg daily i.p. injections of CCT068127 or DMSO carrier. p-values compare DMSO-treated to CCT068127-treated groups at each time-point. f Plot showing daily tumor volumes during course of experiment. g Bar plots showing the mass of tumors at explant on day 23. Error bars show mean ± s.d. p-values in a and f are by two-way ANOVA with multiple comparisons adjustment and in g by two-sided Wilcoxon rank sum test. ns non-significant; *p < 0.01; **p < 0.001; ***p < 0.0001. Panel e Created with BioRender.com released under a Creative Commons Attribution-NonCommercial-NoDerivs 4.0 International license (https://creativecommons.org/licenses/by-nc-nd/4.0/deed.en). Source data are provided as a Source Data file.

References

    1. Howlader, N. et al. SEER Cancer Statistics Review, 1975–2018. National Cancer Institute. Bethesda, MD, https://seer.cancer.gov/csr/1975_2018/, based on November 2020 SEER data submission posted to the SEER web site (2021).
    1. Nguyen, T. M., Shafi, A., Nguyen, T. & Draghici, S. Identifying significantly impacted pathways: a comprehensive review and assessment. Genome Biol.20, 203 (2019). 10.1186/s13059-019-1790-4 - DOI - PMC - PubMed
    1. Khatri, P., Sirota, M. & Butte, A. J. Ten years of pathway analysis: current approaches and outstanding challenges. PLoS Comput. Biol.8, e1002375 (2012). 10.1371/journal.pcbi.1002375 - DOI - PMC - PubMed
    1. Subramanian, A. et al. Gene set enrichment analysis: a knowledge-based approach for interpreting genome-wide expression profiles. Proc. Natl Acad. Sci. USA102, 15545–15550 (2005). 10.1073/pnas.0506580102 - DOI - PMC - PubMed
    1. Chen, E. Y. et al. Enrichr: interactive and collaborative HTML5 gene list enrichment analysis tool. BMC Bioinforma.14, 128 (2013).10.1186/1471-2105-14-128 - DOI - PMC - PubMed

LinkOut - more resources