. 2024 Oct;38(10):2171-2182.
doi: 10.1038/s41375-024-02373-w. Epub 2024 Aug 23.

Chromosome 9p trisomy increases stem cells clonogenic potential and fosters T-cell exhaustion in JAK2-mutant myeloproliferative neoplasms

Affiliations

Chromosome 9p trisomy increases stem cells clonogenic potential and fosters T-cell exhaustion in JAK2-mutant myeloproliferative neoplasms

Chiara Carretta et al. Leukemia. 2024 Oct.

Abstract

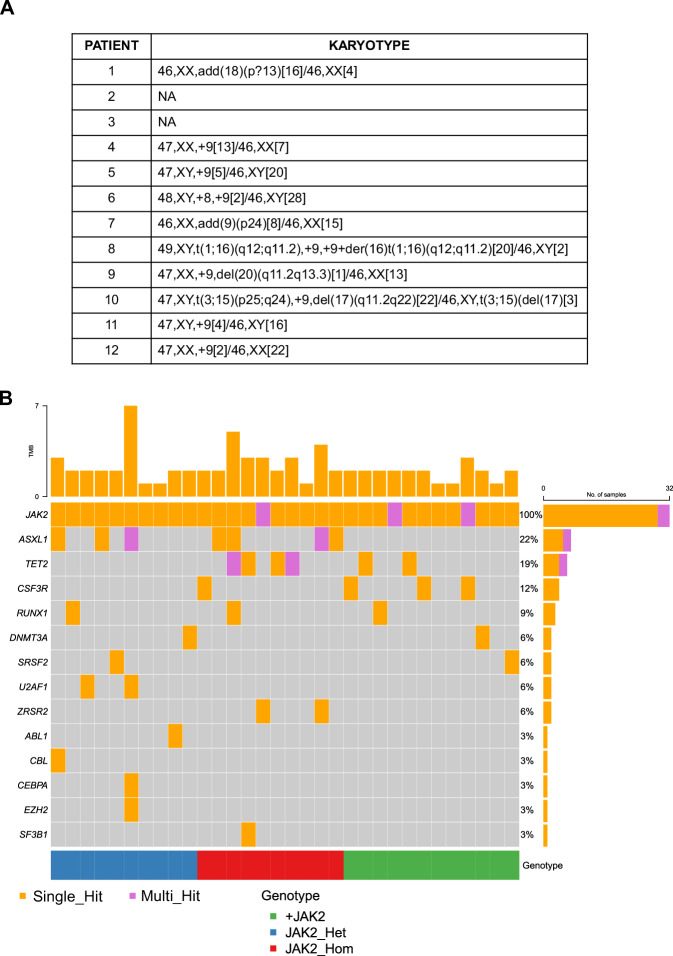
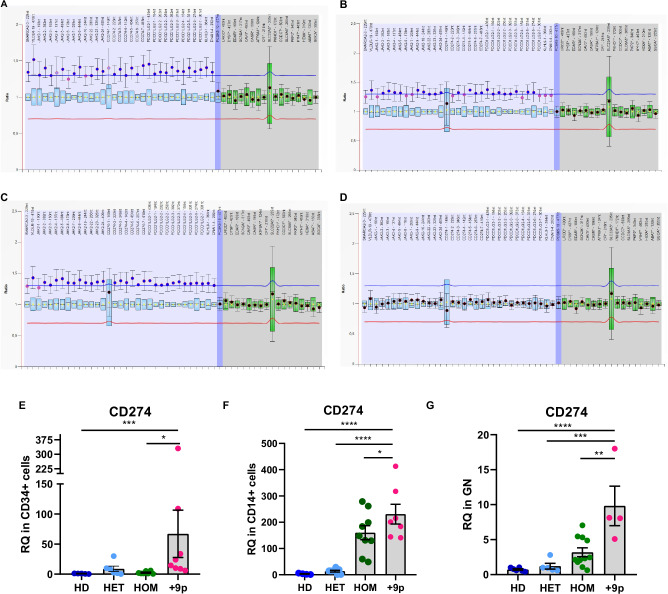
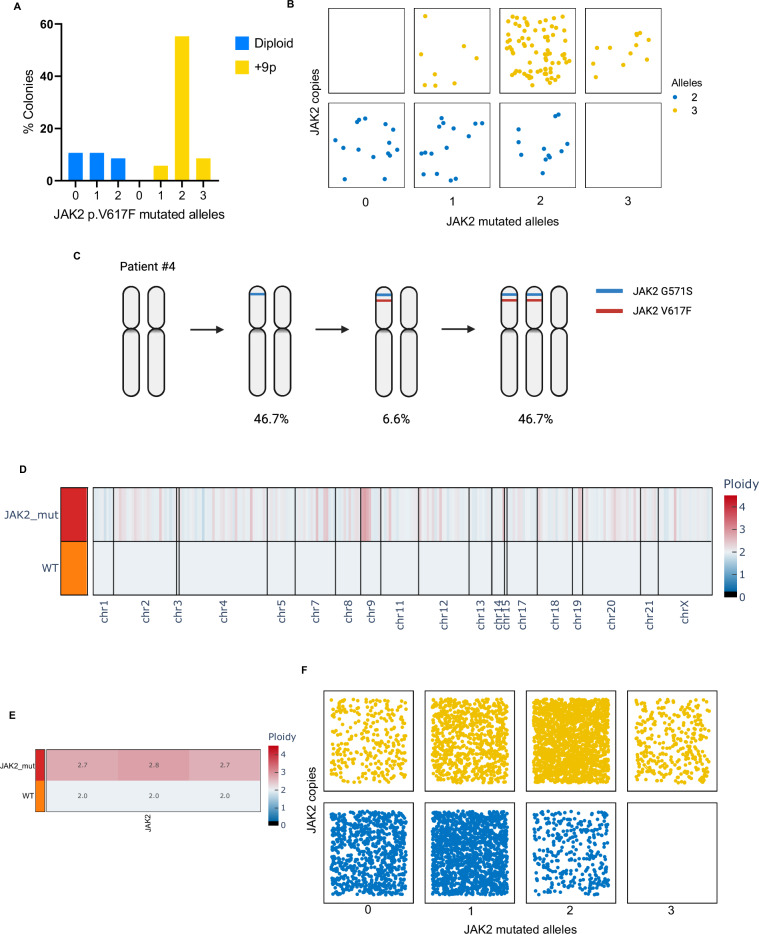
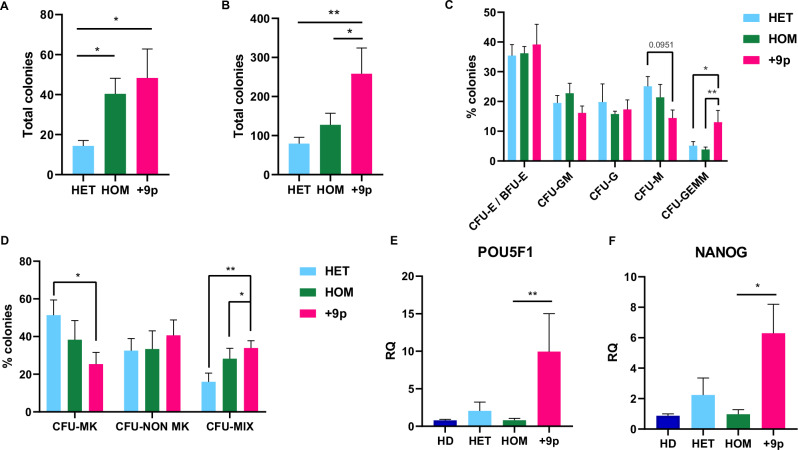
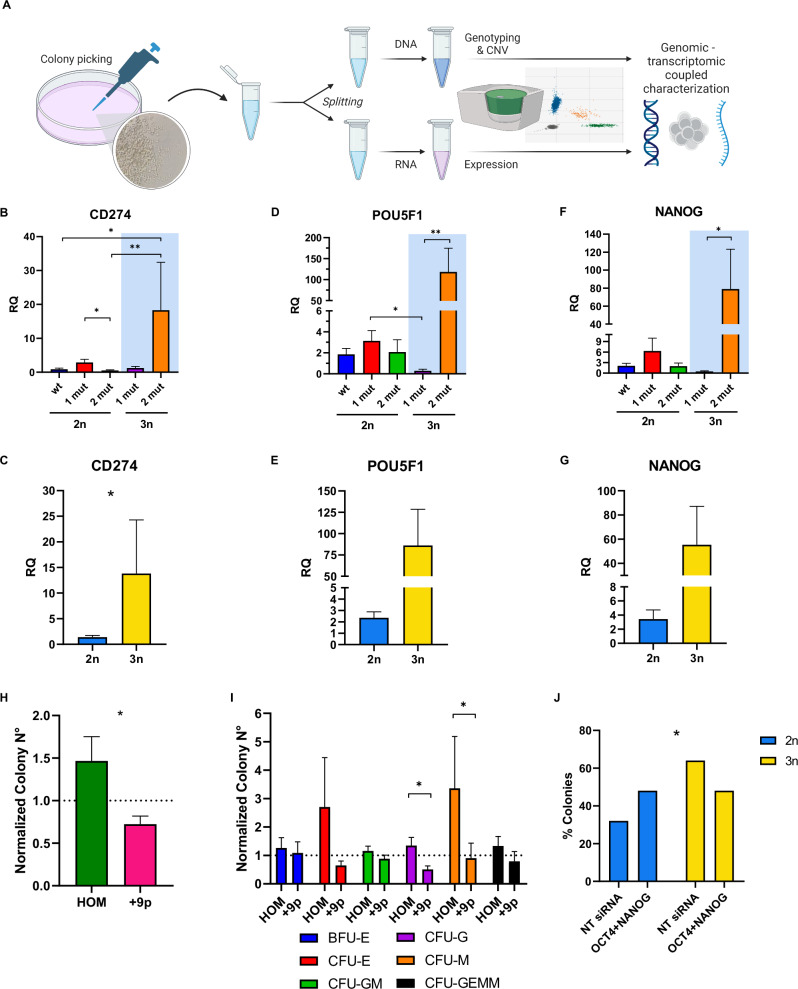
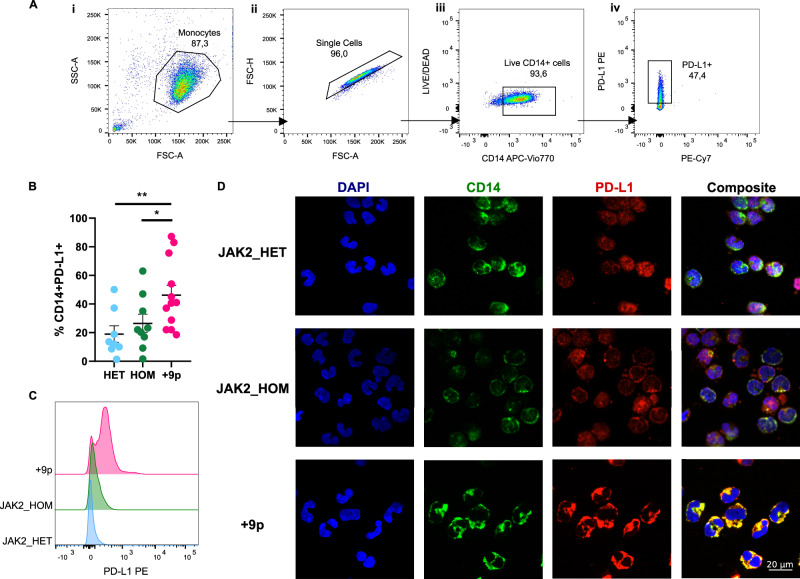
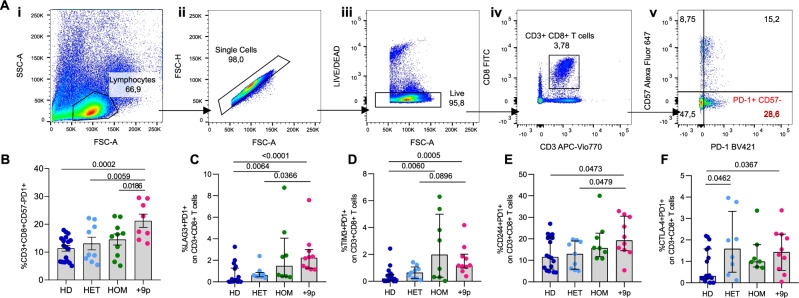
JAK2V617F is the most recurrent genetic mutation in Philadelphia-negative chronic Myeloproliferative Neoplasms (MPNs). Since the JAK2 locus is located on Chromosome 9, we hypothesized that Chromosome 9 copy number abnormalities may be a disease modifier in JAK2V617F-mutant MPN patients. In this study, we identified a subset of MPN patients with partial or complete Chromosome 9 trisomy (+9p patients), who differ from JAK2V617F-homozygous MPN patients as they carry three JAK2 alleles as well as three copies of all neighboring gene loci, including CD274, encoding immunosuppressive Programmed death-ligand 1 (PD-L1) protein. Investigation of the clonal hierarchy revealed that the JAK2V617F occurs first, followed by +9p. Functionally, CD34+ cells from +9p MPN patients demonstrated increased clonogenicity, generating a greater number of primitive colonies, due to high OCT4 and NANOG expression, with knock-down of these genes leading to a genotype-specific decrease in colony numbers. Moreover, our analysis revealed increased PD-L1 surface expression in malignant monocytes from +9p patients, while analysis of the T cell compartment unveiled elevated levels of exhausted cytotoxic T cells. Overall, here we identify a distinct novel subgroup of MPN patients, who feature a synergistic interplay between +9p and JAK2V617F that shapes immune escape characteristics and increased stemness in CD34+ cells.


Conflict of interest statement

The authors declare no competing interests.

Figures

Fig. 1
Fig. 1. Description of the genomic asset of the analyzed patients’ cohort.
A Karyotype of the +9p MPN patients (n = 12) at diagnosis. B Waterfall plot detailing the mutational profile of the entire cohort inferred from NGS data. Patients are split according to JAK2V617F allele frequency and/or JAK2 copy number (blue = normal copy number and heterozygous JAK2V617F, 20% < VAF < 50%, n = 10; red = normal copy number and homozygous JAK2V617F, VAF > 50%, n = 10; green = JAK2 mutation and trisomy, n = 12). For each patient, the mutational asset of a specific gene is reported as an orange box if the gene harbors a single variant or a purple box if multiple variants within the same gene are detected.
Fig. 2
Fig. 2. Assessment of chromosome 9 trisomy and CD274 expression in hematopoietic cell subpopulations.
MLPA profiling of chromosome 9 copy number status in CD34+ cells (A), CD14+ cells (B), Granulocytes (C), or CD3+ cells (D) from patient #2. Labels on the horizontal axis list the genomic regions detected by MLPA probes, while on the vertical axis, the ratio of each probe signal between the patient and the reference samples is shown. The light blue region highlights the signal ratio of probe mapping on chromosome 9p, whereas the blue region represents the signal ratio of the probe mapping on chromosome 9q. The gray region highlights the signal ratio of reference probes. The horizontal lines represent the copy number thresholds beyond which an amplification (blue line) or a deletion (red line) is identified by Coffalyser.net software. Evaluation of CD274 expression at the transcriptional level in (E) CD34+ cells (n = 5 HD, n = 6 HET, n = 7 HOM, n = 8 + 9p), (F) CD14+ cells (n = 4 HD, n = 8 HET, n = 9 HOM, n = 7 + 9p) or (G) Granulocytes (n = 6 HD, n = 5 HET, n = 10 HOM, n = 5 + 9p) from JAK2-mutated MPN patients and healthy donors. Each barplot represents the relative quantity of CD274 mRNA quantified by means of qRT-PCR, whereas dots represent individual values. Results are presented as mean + SEM. Abbreviations: RQ = relative quantity; HD = healthy donors; HET = JAK2-mutated heterozygous patients; HOM = JAK2-mutated homozygous patients; +9p = JAK2-mutated patients with 9p trisomy. *p < 0.05; **p < 0.01; ***p < 0.001; ****p < 0.0001.
Fig. 3
Fig. 3. Genetic profiling of + 9p patients by means of colony and single cell analysis.
AC ddPCR analysis of the JAK2 mutational burden and copy number on DNA from single CD34+ -derived colonies from +9p patients (n = 139 colonies, with an average of 17 colonies/patient across 8 patients). A Barplot depicting the frequency of colonies split by the number of JAK2 mutated alleles and 9p ploidy. B Jitter plot displaying the distribution of JAK2 mutated alleles and copy number at the single-colony level. C Graphical representation of molecular events’ acquisition order of patient #4, as inferred from ddPCR analysis (n = 15 colonies). Percentages indicate the frequency of colonies carrying the above-depicted 9p ploidy and JAK2 genotype. DF Single-cell genomic analysis of CD34+ cells and PBMCs from patient #1. The Copy Number Variation profiling of each clone, listed in the rows, at the amplicon level for the entire genome (D) or JAK2 locus (E), is reported in a heatmap. The shades of color depict the ratio between the median amplicon ploidy of a given clone and the one of the diploid reference, which was set to 2. The Wild-Type clone (WT) was set as diploid reference. F Jitter plot displaying the distribution of JAK2 mutated alleles and copy number at the single-cell level (n = 5617 cells). C Was created with Biorender.com.
Fig. 4
Fig. 4. Clonogenic capacity of CD34+ cells in JAK2-mutated MF patients.
A Total number of colonies obtained from methylcellulose-based clonogenic assays (n = 7 HET, n = 7 HOM, n = 6 + 9p). B Total number of colonies obtained from collagen-based clonogenic assays (n = 7 HET, n = 7 HOM, n = 6 + 9p). C Percentage of the different Colony-Forming Units (CFUs) obtained from methylcellulose-based clonogenic assays. D Percentage of different Colony-Forming Units obtained from collagen-based clonogenic assays. Results are represented as mean + SEM. Evaluation of POU5F1 (E) and NANOG (F) expression at the transcriptional level in CD34+ cells from JAK2-mutated MPN patients and healthy donors (n = 5 HD, n = 6 HET, n = 7 HOM, n = 8 + 9p). Each barplot represents the relative quantity of the target mRNA quantified by means of qRT-PCR. Abbreviations: RQ = relative quantity; CFU-E/BFU-E = Colony-Forming Unit—Erythroid/Burst-Forming Unit—Erythroid; CFU-GM = Colony-Forming Unit—Granulocyte/Macrophage; CFU-G = Colony-Forming Unit—Granulocyte; CFU-M = Colony-Forming Unit—Macrophage; CFU-GEMM = Colony-Forming Unit—Granulocyte/Erythrocyte/Macrophage/Megakaryocyte; CFU-MK = Colony Forming Unit Megakaryocyte; CFU-NON MK = Colony Forming Unit Non-Megakaryocyte; CFU-MIX = Mixed CFU-Mk/Non CFU-Mk colonies; HD = healthy donors; HET = JAK2-mutated heterozygous patients; HOM = JAK2-mutated homozygous patients; +9p = JAK2-mutated patients with 9p trisomy. *p < 0.05; **p < 0.01.
Fig. 5
Fig. 5. Effect of 9p ploidy and JAK2 mutational status on PD-L1, OCT4, and NANOG expression and their role in CD34+ cells clonogenic potential.
A Experimental workflow of genomic/transcriptomic-coupled characterization of single-cell derived colonies by means of ddPCR. Evaluation of CD274 (B, C), POU5F1 (D, E), and NANOG (F, G) expression at the transcriptional level in single-cell derived colonies by ddPCR. In (B, D, and F) colonies (n = 54) were split according to the number of JAK2 mutated alleles and 9p ploidy status. The light blue area highlights +9p colonies. On the other hand, colonies were split according to 9p ploidy status in (C, E, and G). Results are represented as mean + SEM. HJ POU5F1 and NANOG silencing in CD34+ cells from HOM (n = 4) and +9p (n = 6) patients. H Ratio between the total number of colonies grown in methylcellulose-based clonogenic assays in OCT4siRNA+NANOGsiRNA and NTsiRNA samples, split between HOM and +9p patients. Results are represented as mean + SEM. I Ratio between the number of colonies grown in methylcellulose-based clonogenic assays in OCT4siRNA + NANOGsiRNA and NTsiRNA samples, split according to the different Colony-Forming Units (CFUs) in HOM and +9p patients. Results are represented as mean + SEM. J Barplot depicting the frequency of diploid and +9p colonies in +9p patients (n = 6) after POU5F1 and NANOG silencing or NTsiRNA nucleofection. RQ: relative quantity; 1 mut: one JAK2V617F-mutated allele; 2 mut: two JAK2V617F-mutated alleles; 2n: diploid colonies; 3n: +9p colonies; CFU-E/BFU-E: Colony-Forming Unit—Erythroid/Burst-Forming Unit—Erythroid; CFU-GM: Colony-Forming Unit—Granulocyte/Macrophage; CFU-G = Colony-Forming Unit—Granulocyte; CFU-M = Colony-Forming Unit—Macrophage; CFU-GEMM = Colony-Forming Unit—Granulocyte/Erythrocyte/Macrophage/Megakaryocyte; HOM: JAK2-mutated homozygous patients; +9p: JAK2-mutated patients with 9p trisomy; OCT4 + NANOG: POU5F1 siRNA + NANOG siRNA; NT siRNA: Non Targeting siRNA. *p < 0.05; **p < 0.01. A Was created with Biorender.com.
Fig. 6
Fig. 6. PD-L1 expression on monocytes of JAK2-mutated MF patients.
A Representative gating strategy used to quantify CD14 + PD-L1+ cells. (i) Side scatter area (SSC-A) vs forward scatter area (FSC-A) plot, showing the monocyte gate. (ii) Forward scatter height (FSC-H) vs forward scatter area (FSC-A) plot defining the single cell gate. (iii) LIVE/DEAD vs CD14 APC-Vio770 plot gating for live cells. (iv) PD-L1 PE vs PE-Cy7 plot depicting PD-L1+ cell gate. B Percentage of circulating CD14 + PD-L1+ cells in patients. Results are represented as means ± SEM. C Representative histograms for flow cytometry detection of PD-L1 staining in CD14+cells from HET (n = 8), HOM (n = 9) and +9p (n = 12) patients. D PD-L1 cellular localization in monocytes of JAK2-mutated MPN patients. The figure displays representative confocal microscopy images of immunofluorescence staining performed on monocytes coming from a JAK2_HET patient, a JAK2_HOM patient, and a + 9p patient. In every panel, the image on the far right is a merge of the other 3 images. Cells were labeled with anti-CD14 antibody (green fluorescence) and with anti-PD-L1 antibody (red fluorescence); nuclear counterstaining was performed with DAPI (blue fluorescence). HD: healthy donors; HET: JAK2-mutated heterozygous patients; HOM: JAK2-mutated homozygous patients; +9p: JAK2-mutated patients with 9p trisomy. *p < 0.05; **p < 0.01.
Fig. 7
Fig. 7. T-cell exhaustion in MPN patients and healthy donors.
A Representative gating strategy used to quantify CD3 + CD8 + CD57-PD-1+ cells. (i) Side scatter area (SSC-A) vs forward scatter area (FSC-A) plot, showing the lymphocyte gate. (ii) Forward scatter height (FSC-H) vs forward scatter area (FSC-A) plot defining the single cell gate. (iii) LIVE/DEAD vs FSC-A plot gating for live cells. (iv) CD8-FITC vs CD3-APC Vio770 plot depicting CD3 + CD8+ cells. (v) CD57-Alexa Fluor 647 vs PD-1 BV421 plot, showing the percentage of PD-1 + CD57- cells. Flow-cytometric assessment of circulating exhausted CD3 + CD8 + CD57-PD1+ (B), CD3 + CD8 + PD1 + LAG3+ (C), CD3 + CD8 + PD1 + TIM3+ (D), CD3 + CD8 + PD1 + CD244+ (E), CD3 + CD8 + PD1 + CTLA4+ (F) T cells in MPN patients and healthy donors. Results are represented as means ± SEM. HD: healthy donors; HET: JAK2-mutated heterozygous patients; HOM: JAK2-mutated homozygous patients; +9p: JAK2-mutated patients with 9p trisomy.

References

    1. Grabek J, Straube J, Bywater M, Lane SW. MPN: the molecular drivers of disease initiation, progression and transformation and their effect on treatment. Cells. 2020;9:1901. - PMC - PubMed
    1. Alaggio R, Amador C, Anagnostopoulos I, Attygalle AD, de Araujo IBO, Berti E, et al. The 5th edition of the world health organization classification of haematolymphoid tumours: lymphoid neoplasms. Leukemia. 2022;36:1720–48. - PMC - PubMed
    1. Hinshelwood S, Bench AJ, Green AR. Pathogenesis of polycythaemia vera. Blood Rev. 1997;11:224–32. - PubMed
    1. Barbui T, Barosi G, Grossi A, Gugliotta L, Liberato LN, Marchetti M, et al. Practice guidelines for the therapy of essential thrombocythemia. A statement from the Italian Society of Hematology, the Italian Society of Experimental Hematology and the Italian Group for Bone Marrow Transplantation. Haematologica. 2004;89:215–32. - PubMed
    1. Rumi E, Pietra D, Pascutto C, Guglielmelli P, Martínez-Trillos A, Casetti I, et al. Clinical effect of driver mutations of JAK2, CALR, or MPL in primary myelofibrosis. Blood. 2014;124:1062–9. - PMC - PubMed