. 2024 Aug 23;7(1):1043.
doi: 10.1038/s42003-024-06743-z.

High-dimensional cortical signals reveal rich bimodal and working memory-like representations among S1 neuron populations

Affiliations

High-dimensional cortical signals reveal rich bimodal and working memory-like representations among S1 neuron populations

Sofie S Kristensen et al. Commun Biol. .

Abstract

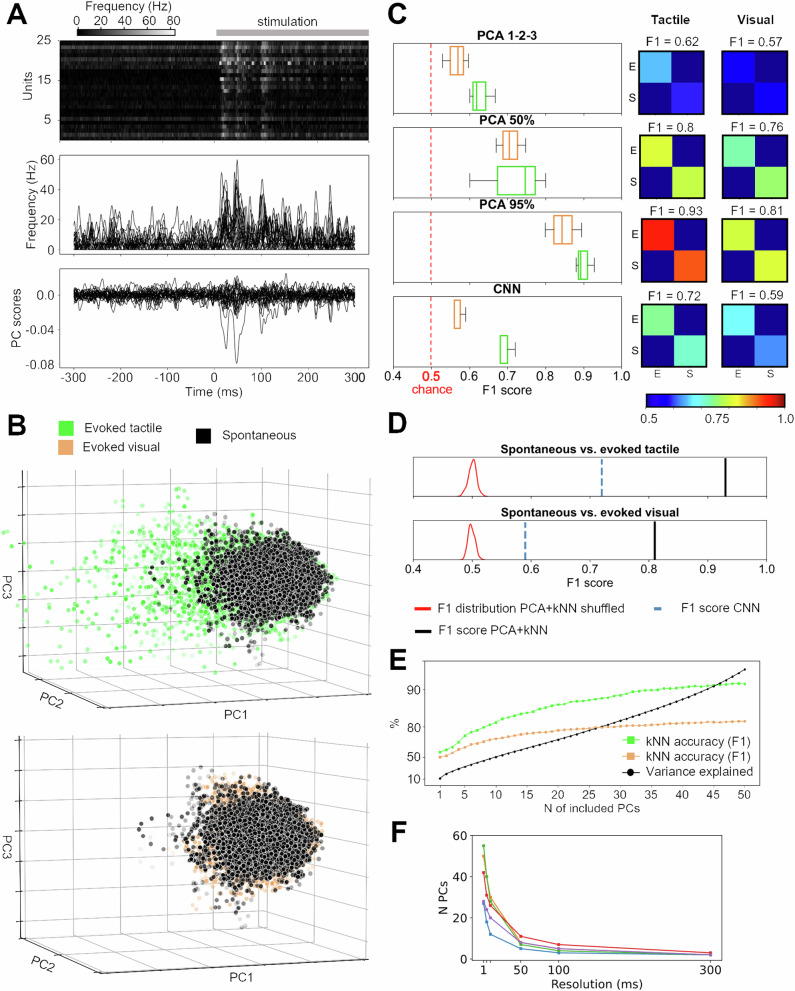
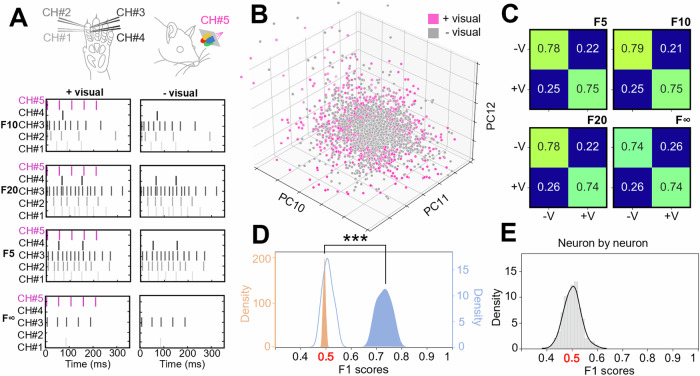
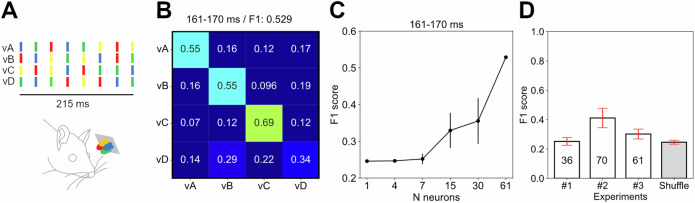
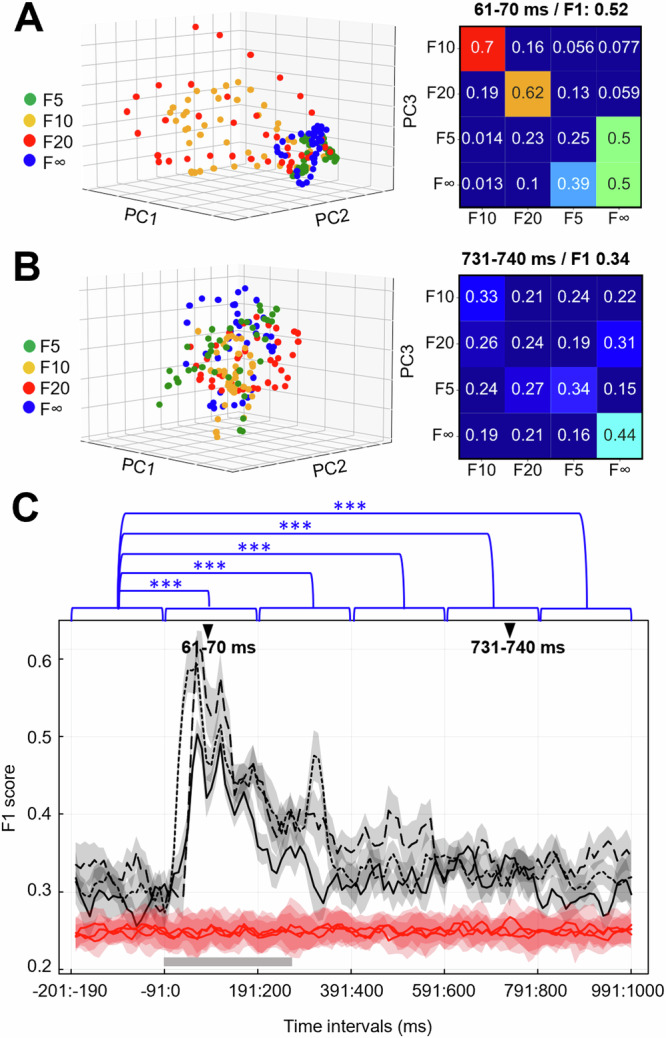
Complexity is important for flexibility of natural behavior and for the remarkably efficient learning of the brain. Here we assessed the signal complexity among neuron populations in somatosensory cortex (S1). To maximize our chances of capturing population-level signal complexity, we used highly repeatable resolvable visual, tactile, and visuo-tactile inputs and neuronal unit activity recorded at high temporal resolution. We found the state space of the spontaneous activity to be extremely high-dimensional in S1 populations. Their processing of tactile inputs was profoundly modulated by visual inputs and even fine nuances of visual input patterns were separated. Moreover, the dynamic activity states of the S1 neuron population signaled the preceding specific input long after the stimulation had terminated, i.e., resident information that could be a substrate for a working memory. Hence, the recorded high-dimensional representations carried rich multimodal and internal working memory-like signals supporting high complexity in cortical circuitry operation.


Conflict of interest statement

The authors declare no competing interests

Figures

Fig. 1
Fig. 1. Principal component analysis (PCA) showed that both tactile and visual inputs changed the activity distribution patterns of the S1 neuron population.
A The responses to tactile inputs for a subpopulation of the recorded neurons from one experiment. Top, normalized averaged spike responses of individual neurons across all tactile input patterns. Middle, superimposed average spike responses of the individual neurons (middle) averaged across all tactile input patterns shown with the spike frequency on the y-axis. Bottom, the PC scores of the full neuron population of the experiment (N = 61 neurons) for the first 25 principal components (PCs). B Activity distribution patterns as quantified by the PC scores of the first 3 PCs for the S1 neuron population activity during tactile (top) and visual (bottom) evoked responses, compared to the spontaneous activity. Note the same viewing angle in the two plots and that the distribution of the spontaneous data points therefore is identical between the plots. In both plots, the depth location of a data point is reflected by its level of transparency. C Decoding performance for visual (orange) and tactile (green) evoked responses using PCs#1-3 (top), PCs explaining 50% of the variance, PCs explaining 95% of the variance, as well as the non-PC based, convolutional neural network (CNN) analysis, across all experiments. Insets to the right are the corresponding confusion matrices from the experiment illustrated in (AD). D The decoding performances, quantified as the F1 score for PCs explaining 95% of the variance (black line), compared to the results for the same data across 50 different label shufflings (red) as well as the decoding obtained using CNN (blue dashed line). E The kNN decoding accuracy (F1 scores) as a function of the number of PCs included in the analysis for visual (orange) and tactile (green) inputs. The black line indicates the cumulative variance explained for each PC. F Number of PCs needed to explain 95% of the variance as a function of the temporal resolution of the neural data across the 5 experiments.
Fig. 2
Fig. 2. S1 neuron population responses to given tactile input patterns changed when they were combined with visual inputs.
A We used a set of 4 fixed tactile input patterns (the labels of which are indicated to the left of each respective pattern, not to be confused with the F1 score) applied to digit 2, which were combined with simultaneous visual stimulation in half of the trials (+visual versus –visual). B Neuron population responses illustrated for three example higher-order PCs. C Decoding accuracy (F1 scores) for the separation of the two conditions (with or without simultaneous visual input, +V and −V) for the four individual tactile input patterns indicated by their respective labels in the top right corner. The chance level was 0.5, or 50% (as the decoding task was binary, combined or not combined with visual input). Note that the F1 score is based on all PCs required to explain 95% of the variance in this and all other figures below illustrating F1 score results. D Across the three experiments and the four tactile input patterns (N = 12), F1 scores for the separation of the two conditions (+V vs −V) for non-shuffled data (blue) and shuffled control (orange) (asterisks indicate their distributions to be significantly different at p < 0.001). The blue curve without fill represents the non-shuffled data when it was down-sampled to 300 ms resolution. E Decoding performance for the same four tactile patterns +V/−V for the 62 S1 neurons when the responses of each neuron were considered separately (as opposed to taking the information of the activity distribution across the neuron population into account).
Fig. 3
Fig. 3. The activity distribution patterns of S1 neuron populations separated fine nuances of visual input patterns.
A The four visual patterns used (vA-vD). The patterns had equal lengths, equal pulse lengths and equal interpulse intervals, but the color series differed. B An example confusion matrix of the visual input pattern decoding performance quantified for a population of S1 neurons in one time window, with the time window and the F1 score indicated on top. C The decoding accuracy as a function of the number of neurons included in the analyzed neuron population. Each test was made using N random samples from the available neuron population and the mean ± 2 SDs is shown. D The average F1 score for the S1 neuron populations across all time windows, shown for each of the three experiments. The standard deviations are shown in red. The chance level decoding was obtained by shuffling the visual input pattern labels and ended up at the theoretical chance level of 0.25 (25% for four stimulation patterns).
Fig. 4
Fig. 4. The cortical separation of tactile versus spontaneous data depended on the time window considered.
A Spontaneous versus tactile data for a few of the higher order PCs (#10–12), which is the same data as in Fig. 1B, although Fig. 1B instead illustrates the three lower order PCs. B Same viewing angle as in (A), but with spontaneous data removed and the timing of the data point versus the stimulus onset being color coded (key at the bottom). C Across the three experiments, the average kNN separation (F1 score) and its 95% confidence interval (CI) per each 50 ms time window from 200 ms prestimulus onset to 300 ms poststimulus onset. The plot shows both the actual data (gray) and their shuffled controls (red), for each respective experiment.
Fig. 5
Fig. 5. The S1 neuron population retained information about the specific tactile pattern long after it had terminated.
A Activity distribution patterns across the neuron population (1 expt.) for four different tactile input patterns (color coded) across a 10 ms time window (61–70 ms), exemplified in a lower order PC space (PCs #1–3). Note that for each stimulation pattern there are 40 data points for each 10 ms time window (see methods). Right, the kNN confusion matrix for the same time window. B Similar plot as in A for a later time window. C For each experiment, the average F1 score and 95% CI for each time window ranging from −200 ms before until 1000 ms after the stimulus onset. Below, in red, the corresponding average F1 score and 95% CI for each time window when the labels of the stimulation patterns were shuffled. The duration of the tactile patterns is indicated by a gray bar, arrowheads indicate the time points for the data illustrated in (A, B). The results of t-tests comparing the F1 scores of the 200 ms prestimulus time window with those of the different 200 ms time windows are shown on top. Data from all experiments were combined in each comparison, the asterisks indicate the significance level p < 0.01.

Similar articles

References

    1. Jazayeri, M. & Ostojic, S. Interpreting neural computations by examining intrinsic and embedding dimensionality of neural activity. Curr. Op. Neurobiol. 70, 113–120 (2021). - PMC - PubMed
    1. Stergiou, N. & Decker, L. M. Human movement variability, nonlinear dynamics, and pathology: is there a connection? Hum. Mov. Sci.30, 869–888 (2011). 10.1016/j.humov.2011.06.002 - DOI - PMC - PubMed
    1. Jordão, S. et al. Muscle activity variability patterns and stride to stride fluctuations of older adults are positively correlated during walking. Sci. Rep. 13. 10.1038/s41598-023-47828-9 (2023). - PMC - PubMed
    1. Cavanaugh, J. T., Kelty-Stephen, D. G. & Stergiou, N. Multifractality, interactivity, and the adaptive capacity of the human movement system: a perspective for advancing the conceptual basis of neurologic physical therapy. J. Neurol. Phys. Ther.41, 245–251 (2017). 10.1097/NPT.0000000000000199 - DOI - PMC - PubMed
    1. Li, Z. et al. An indicator to quantify the complexity of signals and surfaces based on scaling behaviors transcending fractal. Chaos Solitons Fractals 163. 10.1016/j.chaos.2022.112556 (2022).

Publication types

LinkOut - more resources