. 2024 Aug 23;7(1):1041.
doi: 10.1038/s42003-024-06740-2.

PGRMC2 and HLA-G regulate immune homeostasis in a microphysiological model of human maternal-fetal membrane interface

Affiliations

PGRMC2 and HLA-G regulate immune homeostasis in a microphysiological model of human maternal-fetal membrane interface

Ryan C V Lintao et al. Commun Biol. .

Abstract

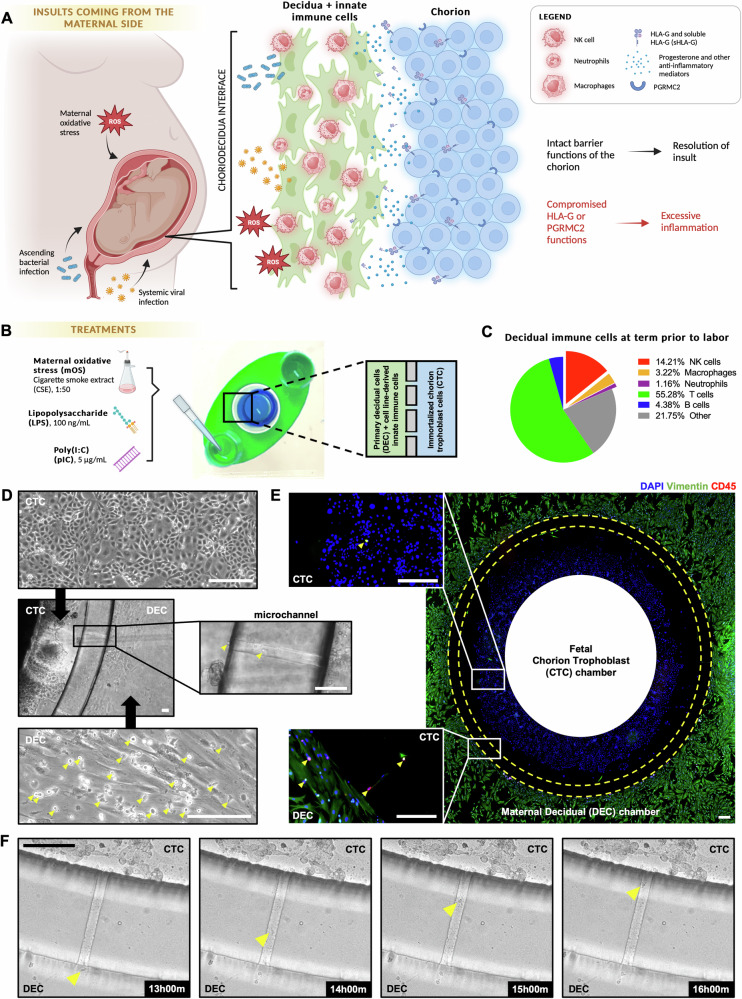
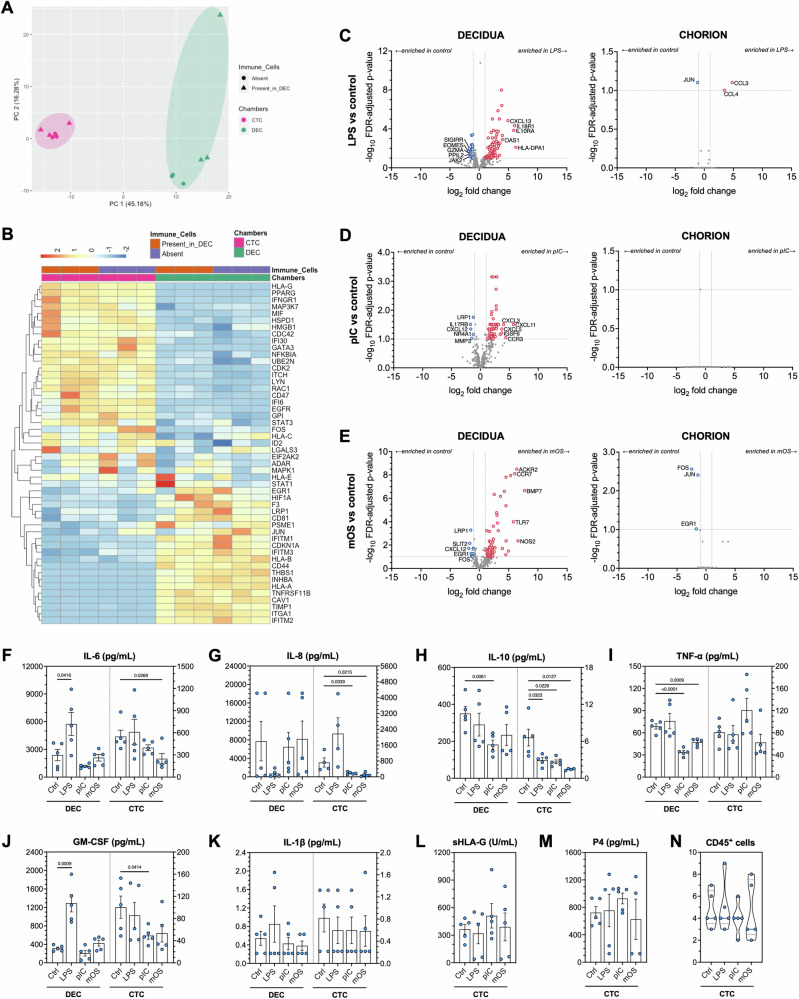
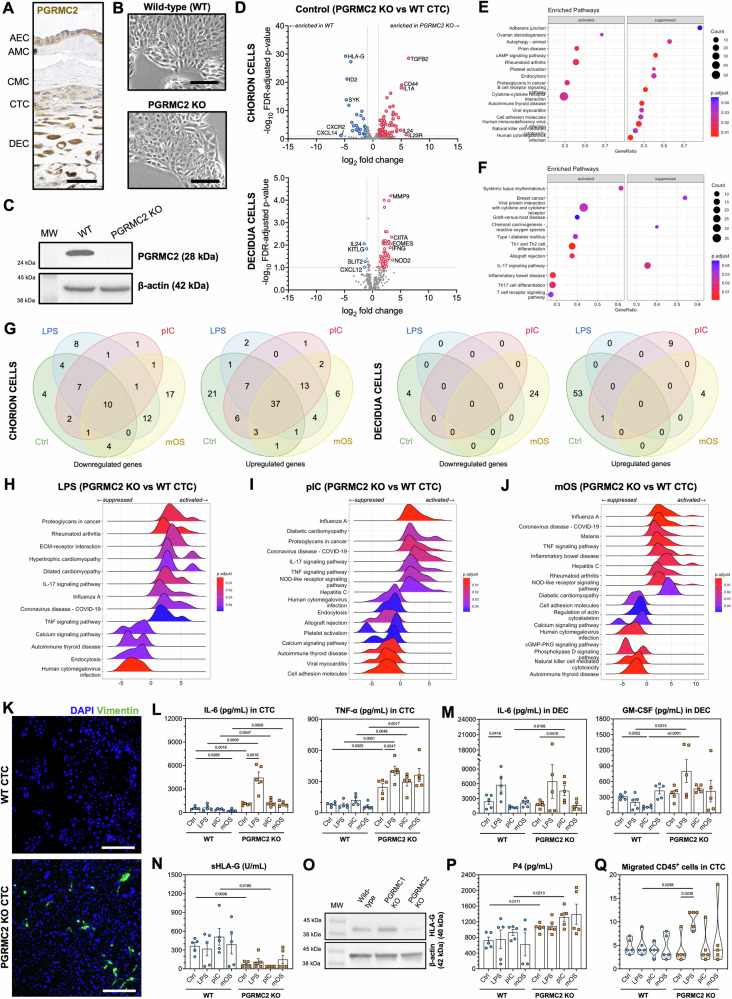
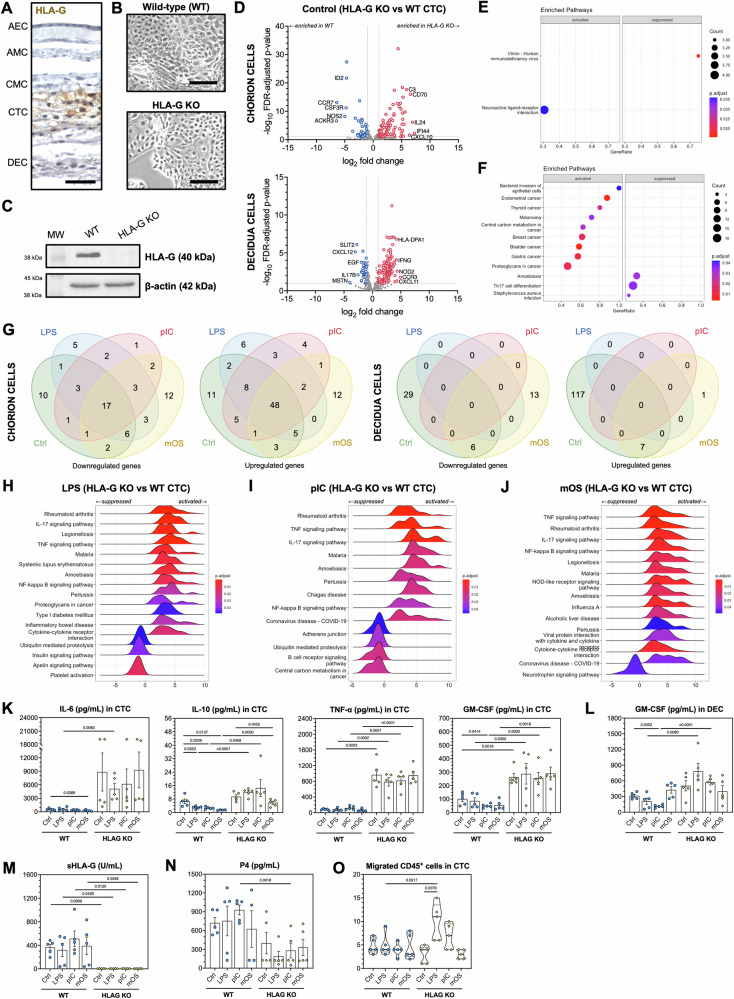
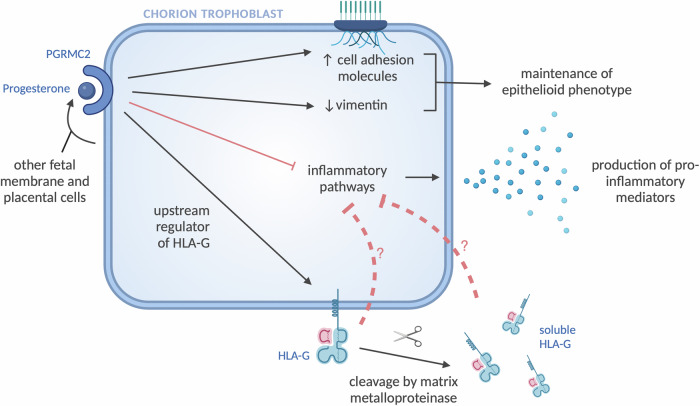
Chorion trophoblasts (CTCs) and immune cell-enriched decidua (DECs) comprise the maternal-fetal membrane interface called the chorio-decidual interface (CDi) which constantly gets exposed to maternal stressors without leading to labor activation. This study explored how CTCs act as a barrier at CDi. The roles of human leukocyte antigen (HLA)-G and progesterone receptor membrane component 2 (PGRMC2) in mediating immune homeostasis were also investigated. The CDi was recreated in a two-chamber microfluidic device (CDi-on-chip) with an outer chamber of primary DECs and immune cell line-derived innate immune cells and an inner chamber of wild-type or PGRMC2 or HLA-G knockout immortalized CTCs. To mimic maternal insults, DECs were treated with lipopolysaccharide, poly(I:C), or oxidative stress inducer cigarette smoke extract. Expression levels of inflammation and immunity genes via targeted RNA sequencing, production of soluble mediators, and immune cell migration into CTCs were determined. In CDi-on-chip, decidua and immune cells became inflammatory in response to insults while CTCs were refractory, highlighting their barrier function. HLA-G and PGRMC2 are found to be vital to immune homeostasis at the CDi, with PGRMC2 serving as an upstream regulator of inflammation, HLA-G expression, and mesenchymal-epithelial transition, and HLA-G serving as a frontline immunomodulatory molecule, thus preventing fetal membrane compromise.


Conflict of interest statement

The authors declare no competing interests.

Figures

Fig. 1
Fig. 1. Human chorio-decidual interface-on-chip (CDi-on-chip).
A Conceptual framework of how the chorio-decidual interface responds to maternal insults. We hypothesize that the decidua and resident innate immune cells counter maternal insults by promoting inflammation, while the chorion produces immunoregulatory molecules such as HLA-G and PGRMC2. With intact barrier functions, the insult should resolve without causing fetal inflammatory response. When HLA-G or PGRMC2 is compromised, this should result in excessive inflammatory response that may lead to premature labor activation. B Schematic diagram of the chorio-decidual interface-on-chip and treatments. Both (A) and (B) are created with BioRender.com. C Immune cell subpopulations in the decidua parietalis at term prior to labor (n = 3) based on Mosebarger et al. . D Phase-contrast images of the CDi-on-chip. Yellow arrowheads point to cell line-derived immune cells. E Immunostaining of CD45 (red) and vimentin (green) expression of cells in the CDi-on-chip. DAPI (blue) was used for nuclear staining. Separation between two chambers is highlighted in yellow dashed circle. Inset images show migrating and migrated cell line-derived immune cells (yellow arrowheads). F Timelapse stills at a device microchannel with a cell line-derived immune cell (yellow arrowhead) migrating towards CTC. Scale bar for (D–F), 100 µm. ROS: reactive oxygen species, NK: natural killer, HLA-G: human leukocyte antigen G, PGRMC2: progesterone receptor membrane component 2, CTC: chorion trophoblast cell, DEC: decidual cell, CD45: cluster of differentiation 45, LPS: lipopolysaccharide, pIC: poly(I:C), mOS: maternal oxidative stress.
Fig. 2
Fig. 2. Transcriptomic and cellular responses of the CDi-on-chip to insults.
A Principal component analysis (PCA) plots of cells based on transcriptomic profile. The first two principal components explained 61.46% of the variance. Colored symbols correspond to CTCs and DECs in both chambers of the CDi-on-chip. B Heatmap and hierarchical clustering of top 50 inflammation and immunity gene expression data for CTCs and DECs in CDi-on-chip. Upregulated genes are represented in red, and downregulated genes are represented in blue. Volcano plots of genes involved in inflammation and immunity in DEC and CTC in response to (C) LPS, (D) pIC, or (E) mOS. Significantly downregulated genes (–log10 adj. p-value > 1, log2 fold change < –1) are shown in blue dots, while significantly upregulated genes (–log10 adj. p value > 1, log2 fold change >1) are shown in red dots. Top differentially expressed genes are labeled. Measurement of (F) IL-6, (G) IL-8, (H) IL-10, (I) TNF-ɑ, (J) GM-CSF, (K) IL-1β, (L) sHLA-G and (M) progesterone production in CDi-on-chip. Multiple student’s (at least n = 4 devices from one placenta per treatment group). Data are presented as mean ± standard error of the mean (SEM). Statistics: Multiple student’s t tests (two-tailed). N Quantification of CD45+ cell migration from DEC into CTC (n = 5 devices from one placenta per treatment group). Statistics: Mann Whitney U test. p values are indicated. IL interleukin; TNF tumor necrosis factor; GM-CSF granulocyte-monocyte colony stimulating factor; sHLA-G soluble HLA-G; P4 progesterone.
Fig. 3
Fig. 3. Effect of PGRMC2 on transcriptomic and cellular responses of CDi-on-chip to various stimulants.
A Immunohistochemistry of human fetal membranes, with PGRMC2 staining brown. B Phase-contrast images of WT and PGRMC2 KO CTC. Scale bar, 100 µm. C Western blot analysis of PGRMC2 expression in WT and PGRMC2 KO CTCs. Beta-actin serves as control. D Volcano plots of genes involved in inflammation and immunity in PGRMC2 KO CTC and DEC compared to WT in control conditions. Significantly downregulated genes (–log10 adj. p value > 1, log2 fold change < –1) are shown in blue dots, while significantly upregulated genes (–log10 adj. p value > 1, log2 fold change > 1) are shown in red dots. GSEA dot plots of top significantly-enriched KEGG pathways in (E) PGRMC2 KO CTC and (F) corresponding DEC. Circle size denotes number of enriched genes in a pathway. Gene ratio denotes the quotient between number of enriched genes and total number of genes in the said pathway. Color denotes p value. G Venn diagram of common differentially expressed genes in PGRMC2 KO CTC compared to wild-type CTC and their corresponding DEC in various conditions. GSEA ridge plots of top significantly-enriched KEGG pathways in PGRMC2 KO CTC and their enrichment scores (x-axis) in response to (H) LPS, (I) pIC and (J) mOS. Peak corresponds to enrichment score; enrichment score below 0 denotes suppressed pathways, while enrichment score above zero denotes activated pathways. Color denotes p value. K Immunostaining of and vimentin (green) expression of WT and PGRMC2 KO CTCs in CDi-on-chip. DAPI (blue) was used for nuclear staining. Scale bar, 100 µm. Measurement of (L) chorionic IL-6 and TNF-ɑ, (M) decidual IL-6 and GM-CSF, (N) sHLA-G and (P) progesterone production in CDi-on-chip (at least n = 4 devices from one placenta per treatment group). Data are presented as mean ± SEM. Statistics: Multiple student’s t-tests (two-tailed). O Western blot analysis of HLA-G expression in wild-type and PGRMC1 or PGRMC2 KO CTCs. Beta-actin serves as control. Q Quantification of CD45+ cell migration from DEC into CTC (n = 5 devices from one placenta per treatment group). Data are presented as median (2nd quartile; solid line) and 1st and 3rd quartiles (dashed lines). Statistics: Multiple Mann Whitney U tests (two-tailed). AEC amnion epithelial cell, AMC amnion mesenchymal cell, CMC chorion mesenchymal cell, WT wild-type, KO knockout, GSEA Gene set enrichment analysis.
Fig. 4
Fig. 4. Effect of HLA-G on transcriptomic and cellular responses of CDi-on-chip to various stimulants.
A Immunohistochemistry of human fetal membranes, with HLA-G staining brown. B Phase-contrast images of WT and PGRMC2 KO CTC. Scale bar, 100 µm. C Western blot analysis of HLA-G expression in WT and HLA-G KO CTCs. Beta-actin serves as control. D Volcano plots of genes involved in inflammation and immunity in HLA-G KO CTC and DEC compared to WT in control conditions. Significantly downregulated genes (–log10 adj. p-value > 1, log2 fold change < –1) are shown in blue dots, while significantly upregulated genes (–log10 adj. p-value > 1, log2 fold change > 1) are shown in red dots. GSEA dot plots of top significantly-enriched KEGG pathways in (E) HLA-G KO CTC and (F) corresponding DEC. Circle size denotes number of enriched genes in a pathway. Gene ratio denotes the quotient between number of enriched genes and total number of genes in the said pathway. Color denotes p value. G Venn diagram of common differentially expressed genes in HLA-G KO CTC compared to wild-type CTC and their corresponding DEC in various conditions. GSEA ridge plots of top significantly-enriched KEGG pathways in HLA-G KO CTC and their enrichment scores (x-axis) in response to (H) LPS, (I) pIC and (J) mOS. Peak corresponds to enrichment score; enrichment score below 0 denotes suppressed pathways, while enrichment score above zero denotes activated pathways. Color denotes p-value. Measurement of (K) chorionic IL-6, IL-10, TNF-ɑ and GM-CSF, (L) decidual GM-CSF, (M) sHLA-G and (N) progesterone production in CDi-on-chip (at least n = 4 devices from one placenta per treatment group). Data are presented as mean ± SEM. Statistics: Multiple student’s t-tests (two-tailed). O Quantification of CD45+ cell migration from DEC into CTC (n = 5 devices from one placenta per treatment group). Data are presented as median (2nd quartile; solid line) and 1st and 3rd quartiles (dashed lines). Statistics: Multiple Mann Whitney U tests (two-tailed).
Fig. 5
Fig. 5. Graphical summary of the role of PGRMC2 and HLA-G expressed by CTCs at the human chorio-decidual interface.
PGRMC2 acts as a critical molecule regulating chorion integrity by maintaining the epithelioid phenotype of CTCs. It also mediates immune homeostasis either via direct activation of inflammatory pathways or via acting as an upstream regulator of HLA-G expression. HLA-G, by itself or via the action of soluble HLA-G, also modulates inflammation possibly via autocrine or paracrine signaling, although the exact mechanism remains unknown. This image is created with BioRender.com.

References

    1. Gomez-Lopez, N., StLouis, D., Lehr, M. A., Sanchez-Rodriguez, E. N. & Arenas-Hernandez, M. Immune cells in term and preterm labor. Cell Mol. Immunol.11, 571–581 (2014). 10.1038/cmi.2014.46 - DOI - PMC - PubMed
    1. Vidal, M. S., Lintao, R. C. V., Severino, M. E. L., Tantengco, O. A. G. & Menon, R. Spontaneous preterm birth: involvement of multiple feto-maternal tissues and organ systems, differing mechanisms, and pathways. Front. Endocrinol.13, 1015622 (2022).10.3389/fendo.2022.1015622 - DOI - PMC - PubMed
    1. Menon, R., Richardson, L. S. & Lappas, M. Fetal membrane architecture, aging and inflammation in pregnancy and parturition. Placenta79, 40–45 (2019). 10.1016/j.placenta.2018.11.003 - DOI - PMC - PubMed
    1. Menon, R. & Moore, J. J. Fetal membranes, not a mere appendage of the placenta, but a critical part of the fetal-maternal interface controlling parturition. Obstet. Gynecol. Clin. North Am.47, 147–162 (2020). 10.1016/j.ogc.2019.10.004 - DOI - PubMed
    1. Kammala, A. K. et al. Expression of CYP450 enzymes in human fetal membranes and its implications in xenobiotic metabolism during pregnancy. Life Sci.307, 120867 (2022). 10.1016/j.lfs.2022.120867 - DOI - PubMed

Publication types