. 2025 Feb;30(2):587-599.
doi: 10.1038/s41380-024-02672-9. Epub 2024 Aug 23.

Tau PET positivity predicts clinically relevant cognitive decline driven by Alzheimer's disease compared to comorbid cases; proof of concept in the ADNI study

Affiliations

Tau PET positivity predicts clinically relevant cognitive decline driven by Alzheimer's disease compared to comorbid cases; proof of concept in the ADNI study

Konstantinos Ioannou et al. Mol Psychiatry. 2025 Feb.

Abstract

β-amyloid (Aβ) pathology is not always coupled with Alzheimer's disease (AD) relevant cognitive decline. We assessed the accuracy of tau PET to identify Aβ(+) individuals who show prospective disease progression. 396 cognitively unimpaired and impaired individuals with baseline Aβ and tau PET and a follow-up of ≥ 2 years were selected from the Alzheimer's Disease Neuroimaging Initiative dataset. The participants were dichotomously grouped based on either clinical conversion (i.e., change of diagnosis) or cognitive deterioration (fast (FDs) vs. slow decliners (SDs)) using data-driven clustering of the individual annual rates of cognitive decline. To assess cognitive decline in individuals with isolated Aβ(+) or absence of both Aβ and tau (T) pathologies, we investigated the prevalence of non-AD comorbidities and FDG PET hypometabolism patterns suggestive of AD. Baseline tau PET uptake was higher in Aβ(+)FDs than in Aβ(-)FD/SDs and Aβ(+)SDs, independently of baseline cognitive status. Baseline tau PET uptake identified MCI Aβ(+) Converters and Aβ(+)FDs with an area under the curve of 0.85 and 0.87 (composite temporal region of interest) respectively, and was linearly related to the annual rate of cognitive decline in Aβ(+) individuals. The T(+) individuals constituted largely a subgroup of those being Aβ(+) and those clustered as FDs. The most common biomarker profiles in FDs (n = 70) were Aβ(+)T(+) (n = 34, 49%) and Aβ(+)T(-) (n = 19, 27%). Baseline Aβ load was higher in Aβ(+)T(+)FDs (M = 83.03 ± 31.42CL) than in Aβ(+)T(-)FDs (M = 63.67 ± 26.75CL) (p-value = 0.038). Depression diagnosis was more prevalent in Aβ(+)T(-)FDs compared to Aβ(+)T(+)FDs (47% vs. 15%, p-value = 0.021), as were FDG PET hypometabolism pattern not suggestive of AD (86% vs. 50%, p-value = 0.039). Our findings suggest that high tau PET uptake is coupled with both Aβ pathology and accelerated cognitive decline. In cases of isolated Aβ(+), cognitive decline may be associated with changes within the AD spectrum in a multi-morbidity context, i.e., mixed AD.


Conflict of interest statement

Competing interests: The authors declare no competing interests. Consortia: Data used in preparation of this article were obtained from the Alzheimer’s Disease Neuroimaging Initiative (ADNI) database ( adni.loni.usc.edu ). As such, the investigators within the ADNI contributed to the design and implementation of ADNI and/or provided data but did not participate in analysis or writing of this report. A complete listing of ADNI investigators can be found at: https://adni.loni.usc.edu/wp-content/uploads/how_to_apply/ADNI_Acknowledgement_List.pdf .

Figures
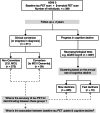
Fig. 1
Fig. 1. A flow chart of the analysis pathway.
Both clinical conversion and progress in cognitive decline were studied (* number of individuals before the exclusion of three outliers/influential points). ADAS-Cog13 13-item version of the Alzheimer’s Disease Assessment Scale-Cognitive Subscale; ADNI Alzheimer’s Disease Neuroimaging Initiative, CU cognitively unimpaired, MCI mild cognitive impairment, PET positron emission tomography.
Fig. 2
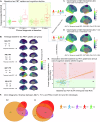
Fig. 2. The clustering pipeline for the definition of SDs and FDs in the case of the ADAS-Cog13 score.
A Auxiliary legend for the rest of the analysis. The composite temporal region of interest illustrates the regions that make up the temporal meta-ROI according to the ADNI3 protocol (bilateral amygdala, entorhinal, fusiform, inferior, and middle temporal cortices). B The LME outcome for the definition of the annual rate of cognitive decline. The slope of each line represents the annual rate of cognitive decline for each individual. Longitudinal data (≥2 years after the baseline examination) for the ADAS-Cog13 were available for 338 out of the 396 individuals, but three individuals were excluded as outliers/influential points. Therefore, our analysis pipeline was completed for 335 individuals. C The GMM outcome for clustering the individuals as SDs or FDs. The distribution of the annual rates of cognitive decline can be explained by two normal distributions (blue: meanb = 0.298, StDb = 0.378; purple: meanp = 1.669, StDp = 1.005). Individuals with an annual rate of cognitive decline ≥ meanb + (2 × StDb) ≈1.05 were clustered as FDs. D, E Spaghetti plots representing all the ADAS-Cog13 scores for each individual before and after clustering respectively. F Similar to B, but after clustering. ADAS-Cog13 13-item version of the Alzheimer’s Disease Assessment Scale-Cognitive Subscale, ADNI Alzheimer’s Disease Neuroimaging Initiative, CI cognitively impaired, CU cognitively unimpaired, FD fast decliner, SD slow decliner, GMM Gaussian mixture model, LME linear mixed-effects model, ROI region of interest, StD standard deviation.
Fig. 3
Fig. 3. Baseline tau PET uptake and clinical conversion.
A, B Baseline tau PET uptake with respect to clinical and biomarker diagnoses, respectively. C Baseline tau PET uptake in relation to the follow-up status per diagnostic group. D The results of a ROC analysis illustrated in a brain atlas for the discrimination of MCI Aβ(+) Converters among all MCI individuals. Aβ β-amyloid, AUC area under the curve, CInt confidence interval, CU cognitively unimpaired, MCI mild cognitive impairment, PET positron emission tomography, ROC receiver operating characteristic, ROI region of interest; SUVR standardized uptake value ratio.
Fig. 4
Fig. 4. Baseline tau PET uptake and progress in cognitive decline.
A Baseline tau PET uptake with respect to SD/FD profiles in both CU and CI individuals. B Average baseline tau PET uptake per group according to Aβ(-/+) and SD/FD profiles. C, D The results of a ROC analysis illustrated in brain atlases for the discrimination of Aβ(+)FDs among CI and CU + CI individuals, respectively. E Association (linear modelling) between the baseline tau PET uptake and the annual rate of cognitive decline including information about both Aβ(-/+) and SD/FD. FD was defined as ADAS-Cog13 annual rate of cognitive decline ≥ 1.05; the red/green shaded areas depict FD/SD; the gray zone for the ADAS-Cog13 annual rate of cognitive decline was obtained from meanb + [(1.65 – 2.35) × StDb] ≈ (0.92–1.19) (Fig. 2C). T(+) was defined as tau PET SUVR ≥ 1.34 in the temporal meta-ROI; the gray zone for tau PET was obtained from 1.34 ± (2.5% × 1.34) ≈ (1.31–1.37). No outliers/influential points were found. F Venn diagrams to illustrate the overlap of Aβ(+), T(+), and FDs in both CU and CI individuals. The size of each group is depicted proportional to the number of individuals it comprises. Aβ β-amyloid, ADAS-Cog13 13-item version of the Alzheimer’s Disease Assessment Scale-Cognitive Subscale, AUC area under the curve, CInt confidence interval, CI cognitively impaired, CU cognitively unimpaired, FD fast decliner, SD slow decliner, PET positron emission tomography, ROC receiver operating characteristic, ROI region of interest, SUVR standardized uptake value ratio, T tau.
Fig. 5
Fig. 5. Hypometabolism FDG PET patterns in the group of Aβ(+)T(-) fast decliners (14 out of 19 individuals had available FDG PET scans).
A representative FDG PET scan from each category of hypometabolism pattern that we identified in this group is presented. The dashed red line encloses regions with hypometabolism. A Hypometabolism pattern not suggestive of AD (A1 + A2, n = 12 (86%)). B Hypometabolism pattern suggestive of AD (n = 2 (14%)). The analysis of the FDG PET images was made in an FDA-approved software platform i.e., Syngo.via (Siemens Healthcare) (Wilson, Selwyn, and Elojeimy 2022); 3D analysis in stereotactic surface projection. The Z-scores scale is based on the Syngo.via database that consists of healthy volunteers aged 46 to 79 years old and the whole brain has been used for intensity normalization [(statistic = (Valuepatient – Meanpopulation)/Std.Devpopulation]. The resulting images were visually assessed by two independent nuclear medicine specialists. AD Alzheimer’s disease, Aβ β-amyloid, Aβ(+) Aβ positivity, FDA food and drug administration, FDG 18F-fluorodeoxyglucose, ND neurodegenerative disorder, PET positron emission tomography, T(-) tau negativity.

Similar articles

Cited by

References

    1. Kadir A, Marutle A, Gonzalez D, Schöll M, Almkvist O, Mousavi M, et al. Positron emission tomography imaging and clinical progression in relation to molecular pathology in the first Pittsburgh Compound B positron emission tomography patient with Alzheimer’s disease. Brain. 2011;134:301–17. - PMC - PubMed
    1. de Wilde A, van der Flier WM, Pelkmans W, Bouwman F, Verwer J, Groot C, et al. Association of Amyloid Positron Emission Tomography With Changes in Diagnosis and Patient Treatment in an Unselected Memory Clinic Cohort: The ABIDE Project. JAMA Neurology. 2018;75:1062–70. - PMC - PubMed
    1. Rabinovici GD, Gatsonis C, Apgar C, Chaudhary K, Gareen I, Hanna L, et al. Association of Amyloid Positron Emission Tomography With Subsequent Change in Clinical Management Among Medicare Beneficiaries With Mild Cognitive Impairment or Dementia. JAMA. 2019;321:1286–94. - PMC - PubMed
    1. Rowe CC, Bourgeat P, Ellis KA, Brown B, Lim YY, Mulligan R, et al. Predicting Alzheimer disease with β-amyloid imaging: results from the Australian imaging, biomarkers, and lifestyle study of ageing. Ann Neurol. 2013;74:905–13. - PubMed
    1. Sabri O, Sabbagh MN, Seibyl J, Barthel H, Akatsu H, Ouchi Y, et al. Florbetaben PET imaging to detect amyloid beta plaques in Alzheimer’s disease: Phase 3 study. Alzheimer’s & Dementia. 2015;11:964–74. - PubMed

LinkOut - more resources