. 2024 Oct;25(10):1943-1958.
doi: 10.1038/s41590-024-01943-5. Epub 2024 Aug 23.

Mapping spatial organization and genetic cell-state regulators to target immune evasion in ovarian cancer

Affiliations

Mapping spatial organization and genetic cell-state regulators to target immune evasion in ovarian cancer

Christine Yiwen Yeh et al. Nat Immunol. 2024 Oct.

Abstract

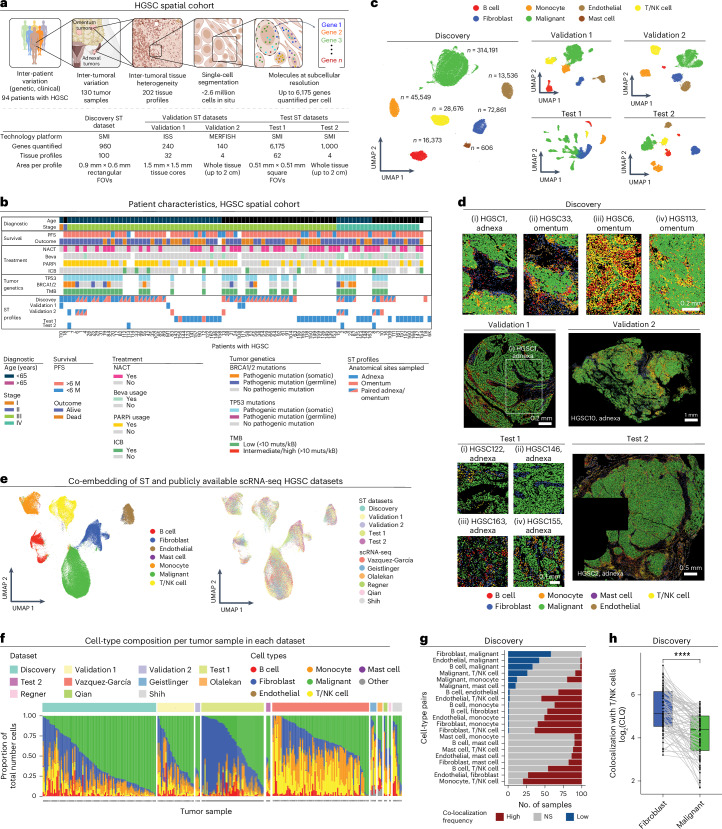
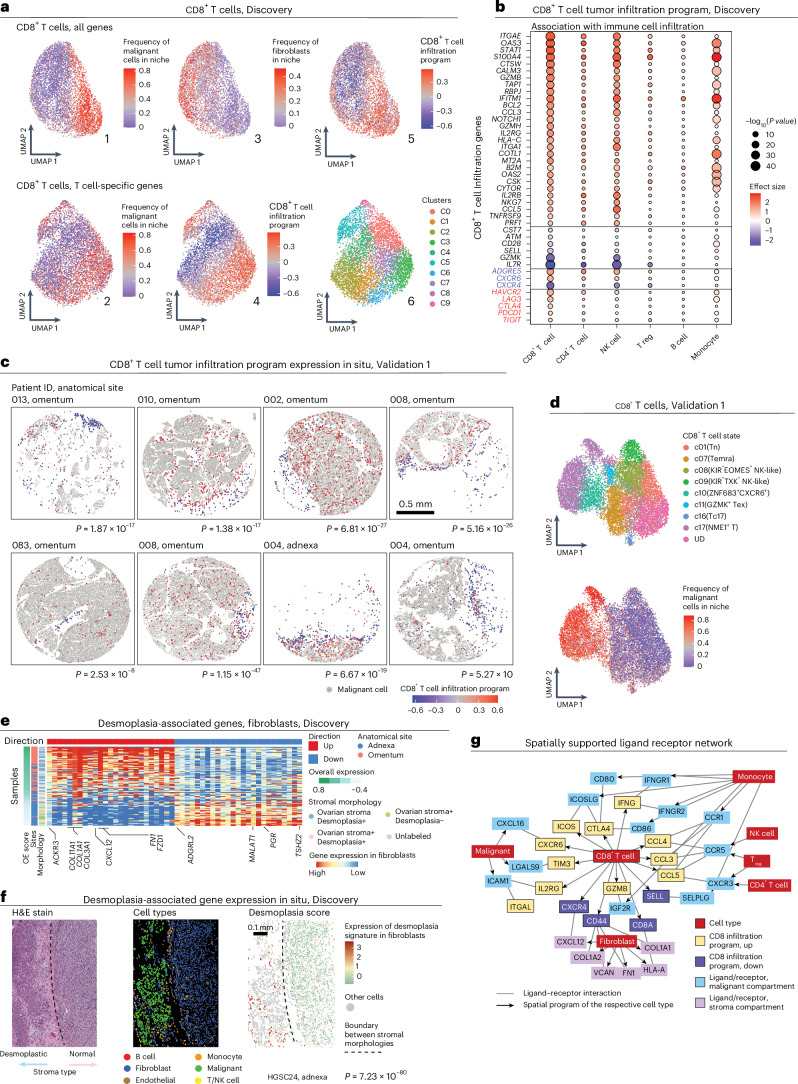
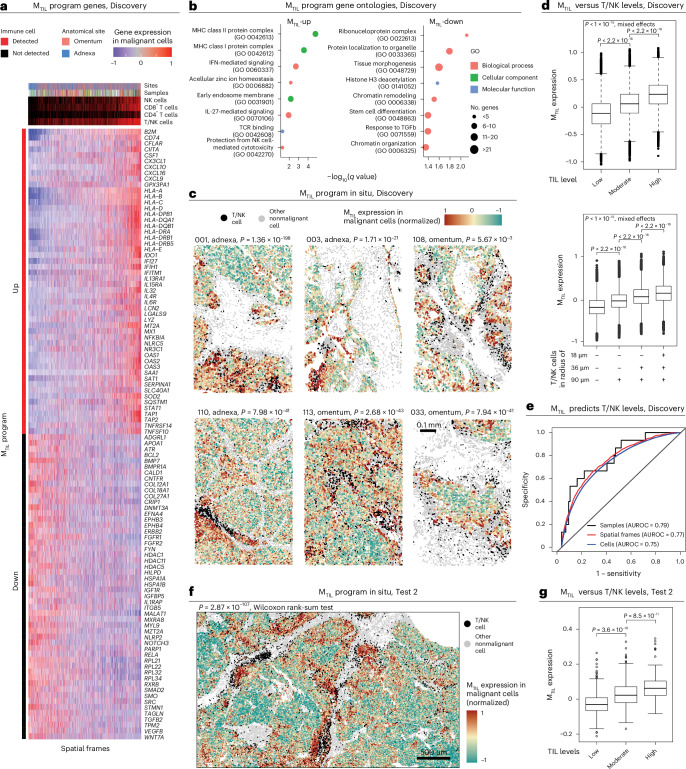
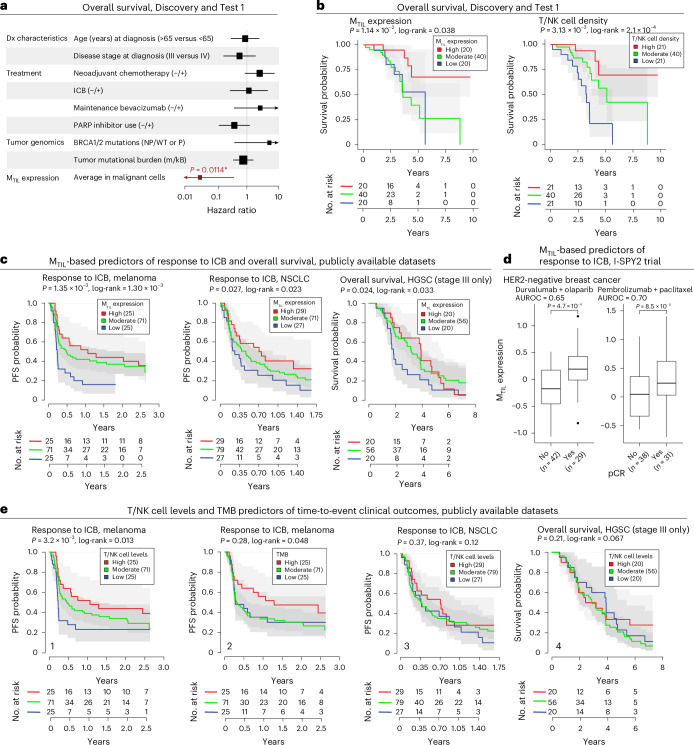
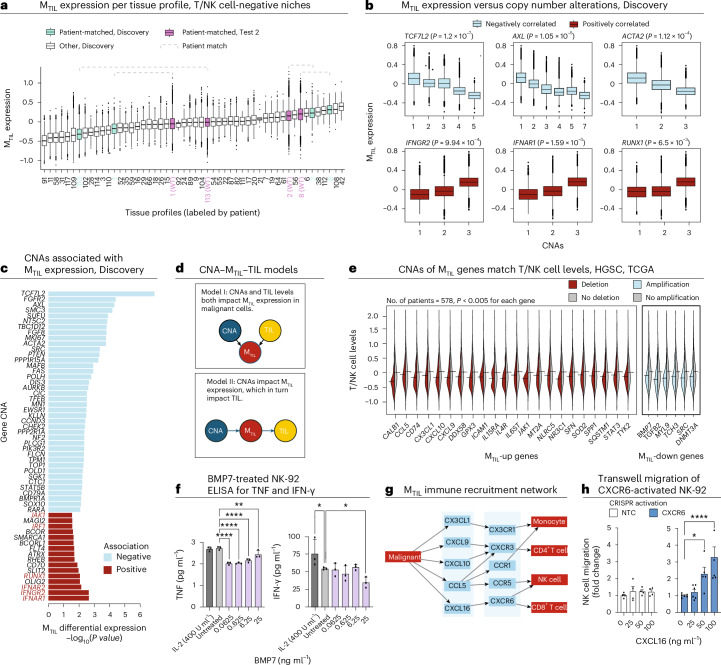
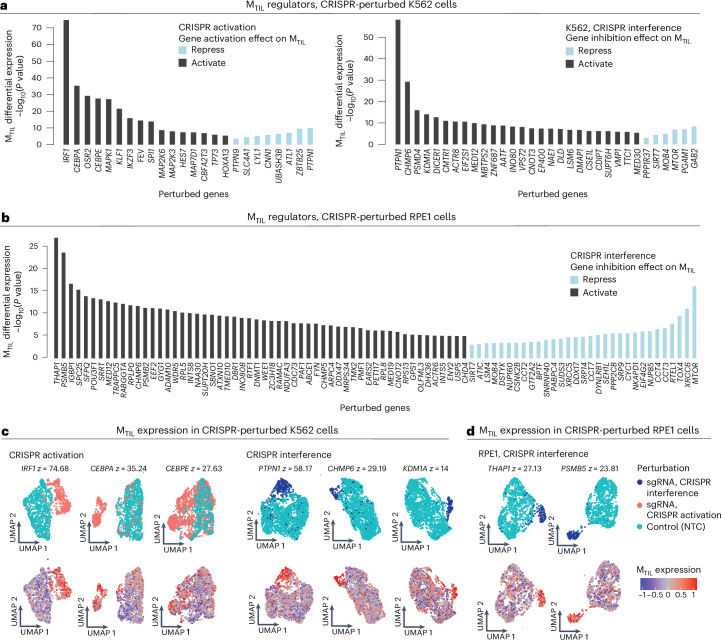
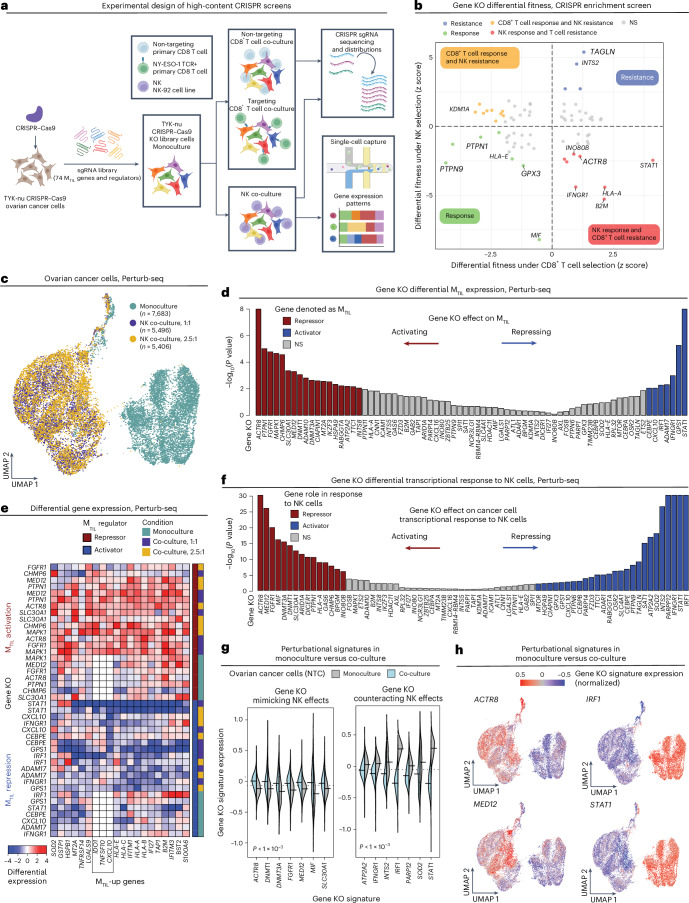
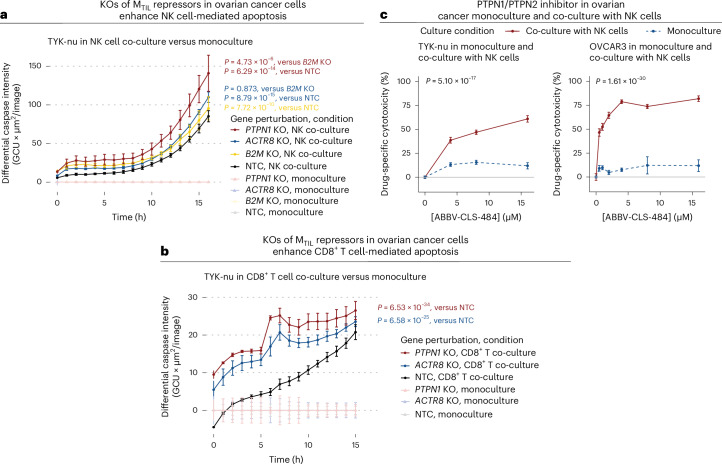
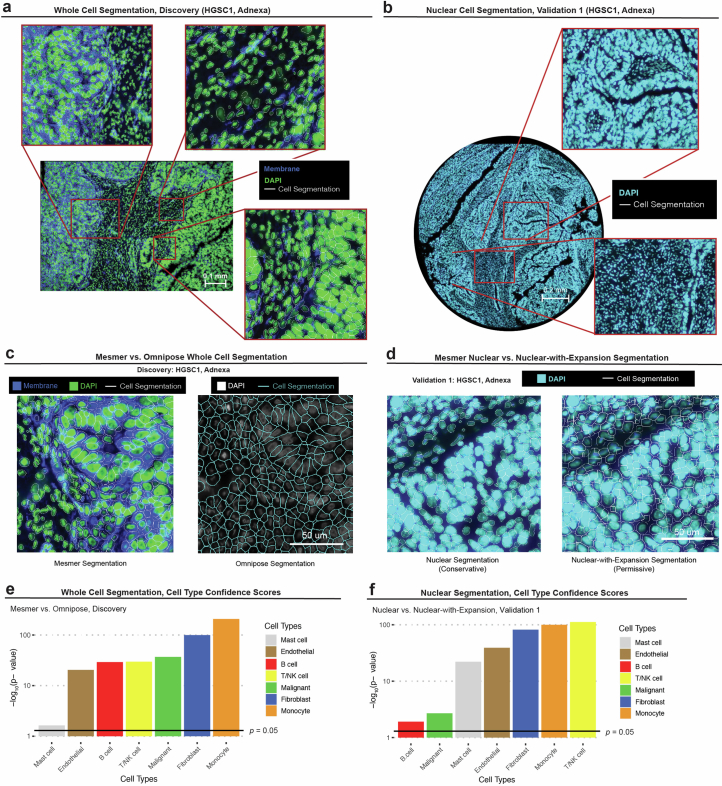
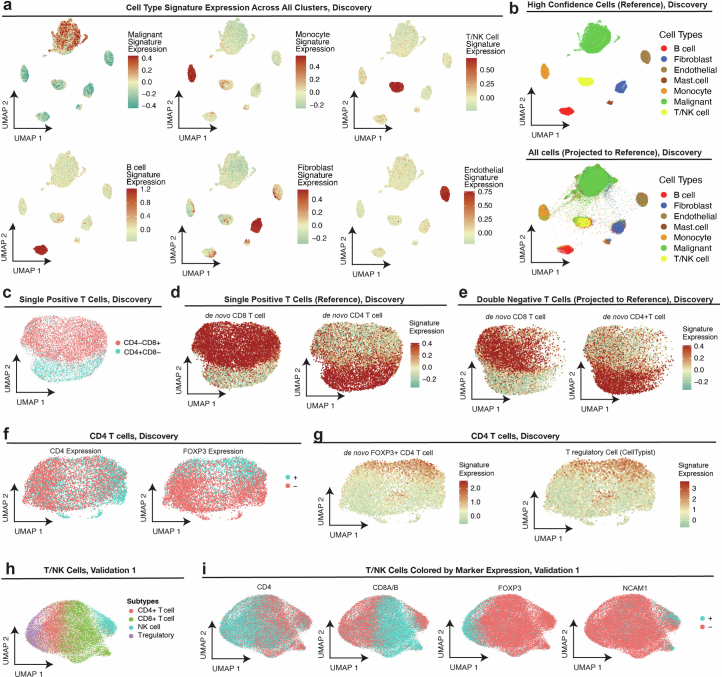
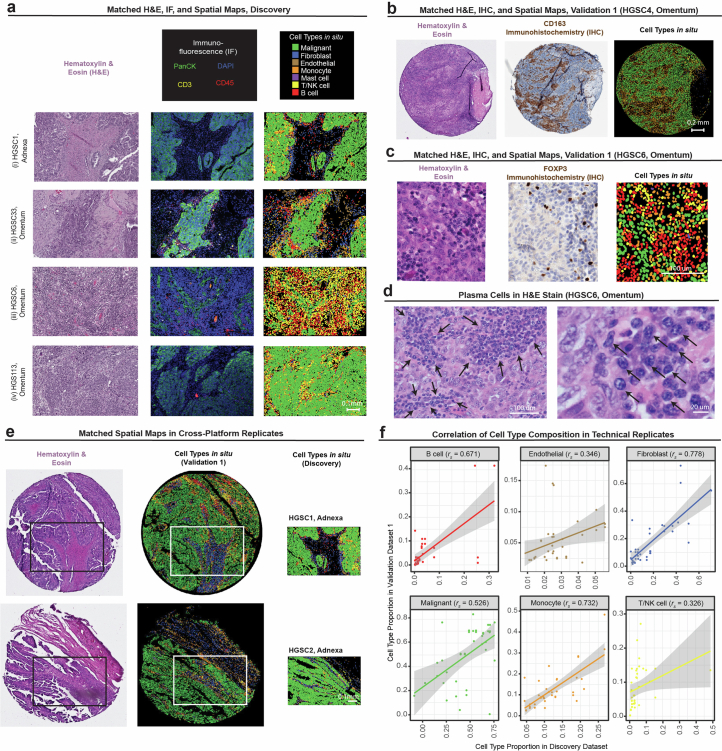
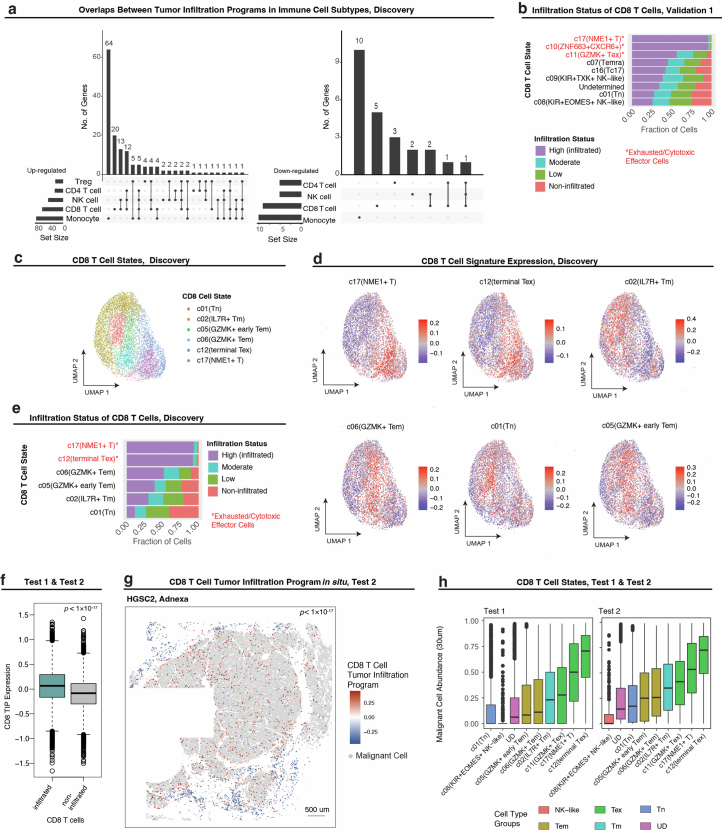
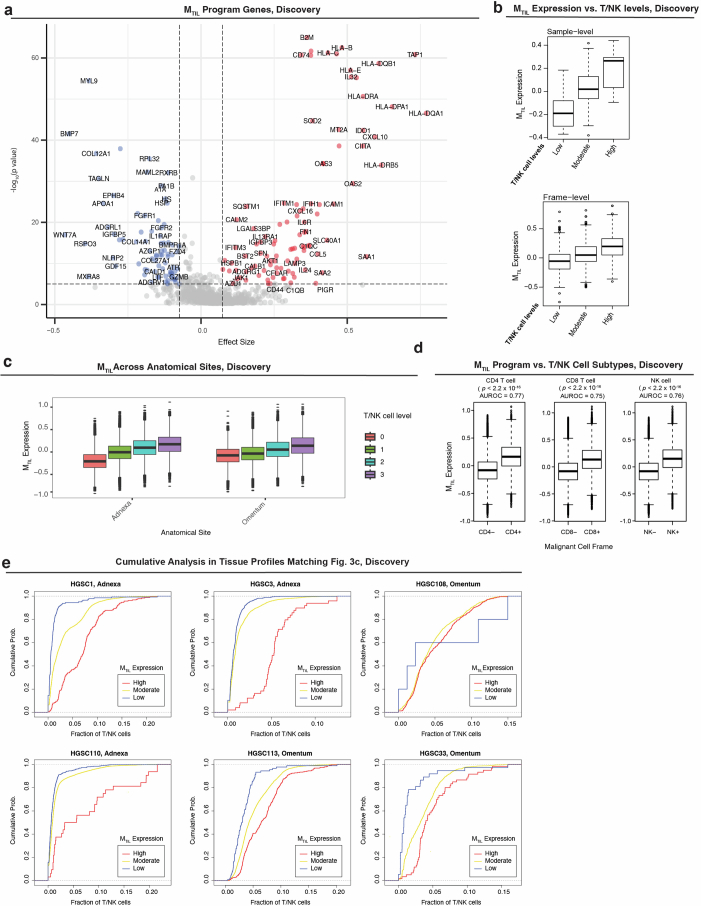
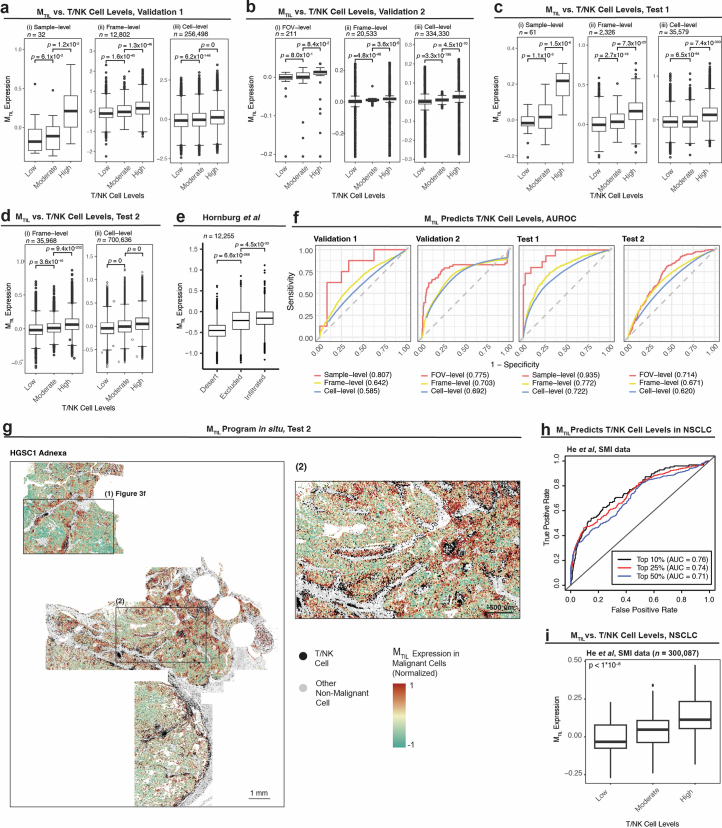
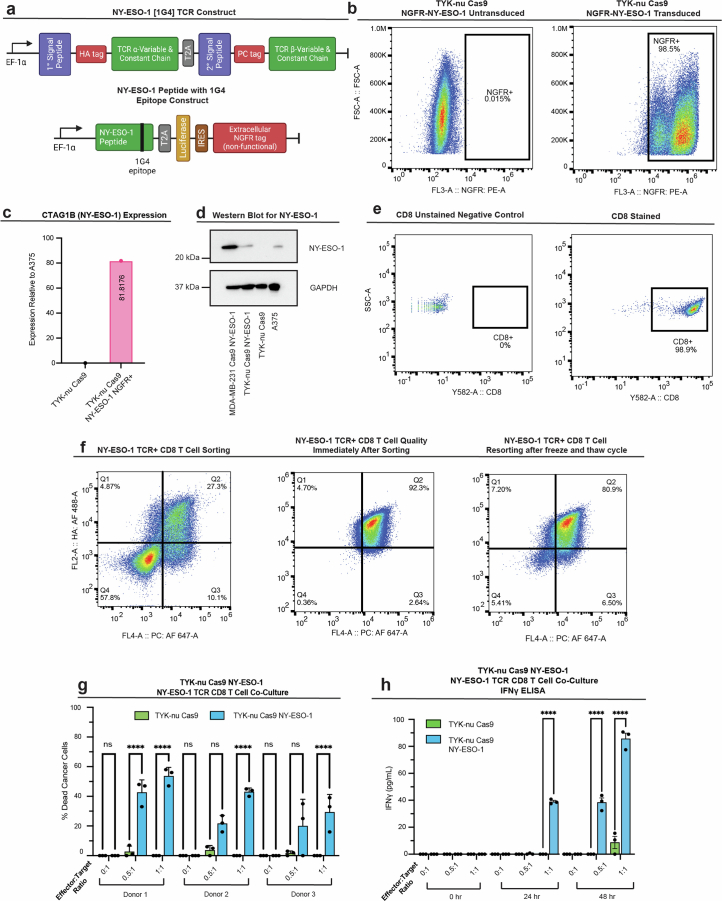
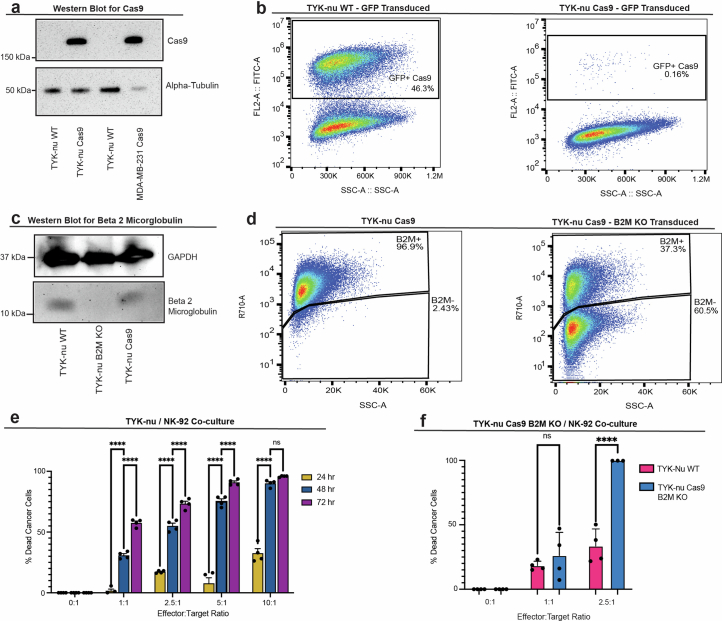
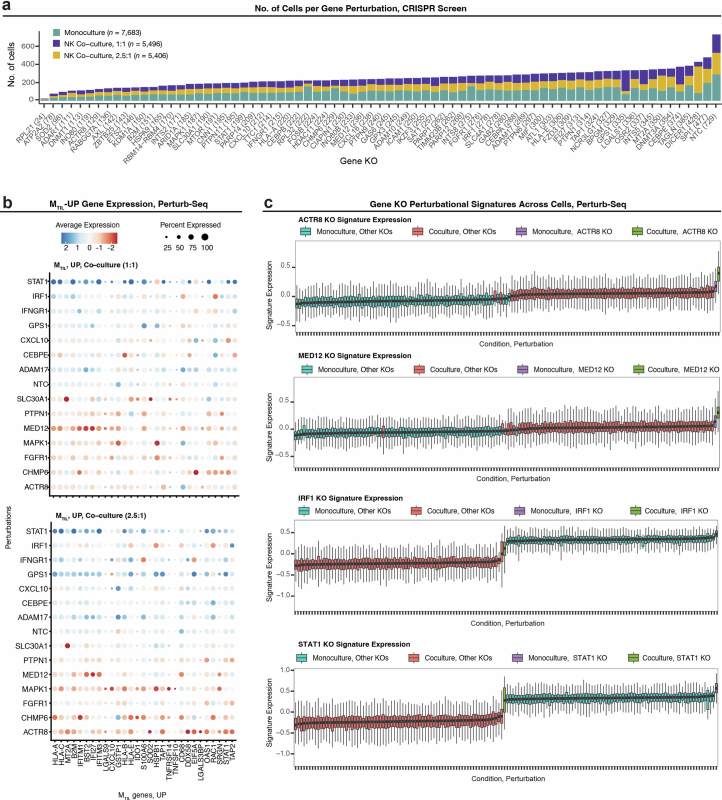
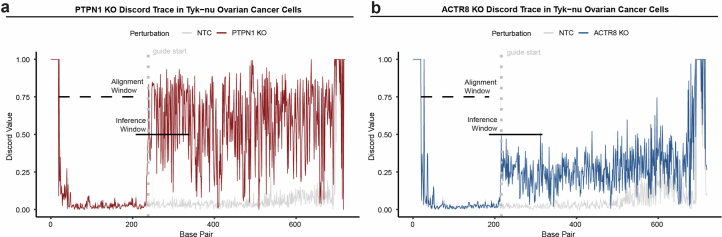
The drivers of immune evasion are not entirely clear, limiting the success of cancer immunotherapies. Here we applied single-cell spatial and perturbational transcriptomics to delineate immune evasion in high-grade serous tubo-ovarian cancer. To this end, we first mapped the spatial organization of high-grade serous tubo-ovarian cancer by profiling more than 2.5 million cells in situ in 130 tumors from 94 patients. This revealed a malignant cell state that reflects tumor genetics and is predictive of T cell and natural killer cell infiltration levels and response to immune checkpoint blockade. We then performed Perturb-seq screens and identified genetic perturbations-including knockout of PTPN1 and ACTR8-that trigger this malignant cell state. Finally, we show that these perturbations, as well as a PTPN1/PTPN2 inhibitor, sensitize ovarian cancer cells to T cell and natural killer cell cytotoxicity, as predicted. This study thus identifies ways to study and target immune evasion by linking genetic variation, cell-state regulators and spatial biology.


Conflict of interest statement

M.P.S. is a cofounder and scientific advisor of Personalis, SensOmics, Qbio, January AI, Fodsel, Filtricine, Protos, RTHM, Iollo, Marble Therapeutics and Mirvie. M.P.S. is a scientific advisor of Yuvan, Jupiter, Neuvivo, Swaza and Mitrix. M.C.B has outside interest in DEM Biopharma. The other authors declare no competing interests.

Figures

Fig. 1
Fig. 1. Single-cell ST mapping of HGSC.
a, Cohort and data overview. Created with BioRender.com. b, Summary of clinical history, tumor genetics and ST profiles per patient. Each column represents 1 of 94 patients. NACT, neoadjuvant chemotherapy; Beva, bevacizumab; PARPi, PARP inhibitor. c, Uniform manifold approximation and projection (UMAP) embedding of high-confidence spatial single-cell transcriptomes from the different datasets. n denotes number of cells within each cell-type annotation in the Discovery dataset. d, Representative tumor tissue ST images (11 of 202) with cells plotted in situ and colored based on cell-type annotations. e, Co-embedding of spatial single-cell transcriptomes from this study with six publicly available HGSC scRNA-seq datasets,–. f, Cell-type composition (y axis) per tissue profile (x axis) from this study and in six publicly available scRNA-seq HGSC datasets,–. g, Pairwise colocalization analysis: the number of tissue profiles (x axis) where each pair of cell types (y axis) shows significantly (BH FDR < 0.05, hypergeometric test) higher (red), lower (blue) or expected (gray) colocalization frequencies compared to those expected by random. h, log2 colocalization quotient (CLQ) of T/NK cells with fibroblasts (CLQT/NK cell→fibroblast, blue) and T/NK cells with malignant cells (CLQT/NK cell→malignant, green, x axis) in ST tissue profiles from the Discovery dataset (n = 87 CLQ pairs, P = 4.31 × 10−10, paired Wilcoxon rank-sum test). Light gray lines connect paired values in each ST tissue core (black dots). In the box plots, the middle line denotes the median, box edges indicate the 25th and 75th percentiles, and whiskers extend to the most extreme points that do not exceed ±1.5 times the interquartile range (IQR); further outliers (minima and maxima) are marked individually as black points beyond the whiskers; ****P < 1 × 10−4, paired Wilcoxon rank-sum test. NS, not significant.
Fig. 2
Fig. 2. Immune cell states mark immune cell tumor infiltration status.
a, UMAP embedding of CD8+ T cells (Discovery dataset) derived from gene expression of all genes (top) or only T cell-specific genes (bottom). b, The association (P value and effect size, LMM) of each gene (row) from the CD8 TIP with immune cell infiltration status, when considering CD8+ T cells and other immune cell types in the Discovery dataset (columns). c, Representative ST images from the Validation 1 dataset depicting the CD8 TIP identified in the Discovery dataset. P values denote per tissue core if the expression of the CD8 TIP is significantly higher in CD8+ T cells with a high (above median) versus low (below median) abundance of malignant cells within a radius of 30 μm (one-sided t-test). d, UMAP embedding of CD8+ T cells (Validation 1 dataset) from gene expression alone. e, Average gene expression (z score) in fibroblasts (Discovery dataset) of the top 50 desmoplasia-associated genes (columns) in each tissue profile (rows, n = 87). f, Representative tissue section (HGSC24, adnexa, Discovery dataset, 1 of 100), wherein the desmoplasia-associated genes capture stromal morphology on the per-cell level (n = 1,968 fibroblasts, P value = 7.23 × 10−80, one-sided Wilcoxon rank-sum test). These results were observed repeatedly across samples, as shown in e. g, Ligand–receptor interactions (lines) consisting of genes from the CD8 TIP and their respective ligand/receptor in the malignant compartment and stromal compartment. The arrows connect each gene to the cell type where it was found to mark the malignant or stromal compartment.
Fig. 3
Fig. 3. Malignant cell transcriptional program marks and predicts T/NK cell infiltration.
a, Heat map of genes in the MTIL (malignant transcriptional program that robustly marks the presence of TILs) program (Discovery dataset). Average expression of the top 104 MTIL genes (rows) across spatial frames (columns). b, Top gene sets enriched in MTIL based on Gene Ontology (GO) enrichment analysis. c, MTIL spatial distributions in six representative tumor tissue profiles (6 of 100, Discovery dataset). P values denote if MTIL expression is significantly (one-sided t-test) higher in frames with high-versus-low T/NK abundance, defined based on the median level in the respective tissue section. Matching cumulative analysis is provided in Extended Data Fig. 5e. d, MTIL expression in each malignant cell (Discovery dataset, n = 297,960 cells), stratified based on the relative abundance of T/NK cells in their surroundings (top) and the presence of T/NK cells at different distances (bottom). e, ROC curves obtained for cross-validated SVM classifier using MTIL expression in malignant cells (Discovery dataset) to predict T/NK cell levels, at the sample, spatial frame and single-cell levels. f, MTIL spatial distributions in a representative region from one (of four) whole-tissue section (HGSC1, adnexa, Test 2 dataset; MTIL expression in TIL-high versus TIL-low niches, P = 2.87 × 10−107, one-sided Wilcoxon rank-sum test). A full view of the whole-tissue section is provided in Extended Data Fig. 6g. g, Mean MTIL expression in malignant cells in each FOV (Test 2 dataset, n = 878 FOVs), stratified based on the relative abundance of T/NK cells in each FOV. In d and g, in the box plots, the middle line denotes the median, box edges indicate the 25th and 75th percentiles, and whiskers extend to the most extreme points that do not exceed ±1.5 times the IQR; further outliers are marked individually with circles (minima/maxima). P values of group comparisons are derived from a one-sided Student’s t-test.
Fig. 4
Fig. 4. MTIL predicts patient survival and ICB response.
a, Hazard ratios (HRs) estimated for each predictor from multivariate Cox proportional hazards models of overall survival in the HGSC cohort of this study (Discovery and Test 1 datasets, n = 30 and 54 patients for genomic and non-genomic features, respectively). Bars indicate 95% confidence intervals (Methods). Arrowheads indicate that the 95% interval extends beyond the HR limits shown in the x axis. *P value < 0.05, multivariate Cox proportional hazards models. b, Kaplan–Meier curves and numbers-at-risk table of overall survival in patients with HGSC (Discovery and Test 1 datasets); patients stratified by average MTIL expression (left), and T/NK cell density (right) in adnexal tumors. c, Kaplan–Meier curves and numbers-at-risk tables of ICB PFS probability (melanoma, left; NSCLC, middle) and overall survival (external HGSC cohort, right) with patients stratified by tumor MTIL expression. d, MTIL expression is significantly higher in patients with HER2-negative breast cancer with pCR (pathogenic clinical response) versus without pCR in two arms of the I-SPY2 clinical trial (durvalumab + olaparib (n = 71 patients) and pembrolizumab + paclitaxel (n = 67 patients)). In the box plots, the middle line denotes the median, box edges indicate the 25th and 75th percentiles, and whiskers extend to the most extreme points that do not exceed ±1.5 times the IQR; further outliers are marked individually (minima/maxima). P values derived from one-sided Student’s t-test. e, T/NK cell levels estimated from bulk transcriptomics and TMB (mut/kB) as predictors of ICB responses in the datasets shown in c. Kaplan–Meier curves and numbers-at-risk tables of ICB PFS probability in patients with melanoma stratified by T/NK cell levels (1) and TMB (2), and in patients with NSCLC stratified by T/NK cell levels (3), and of overall survival in patients with HGSC stratified by T/NK cell levels (4). In b, c and e, P values were calculated from the Wald statistic of covariate-controlled Cox proportional hazards regression models. The log-rank P value was derived from comparing discretized predictors (high = top quartile versus low = bottom quartile).
Fig. 5
Fig. 5. Genetic association with MTIL and T/NK cell levels.
a, MTIL expression in adnexal malignant cells (Discovery and Test 2 datasets, n = 264,825 cells) residing in tissue niches where T/NK cells were not detected, stratified by tissue profiles labeled by patient and dataset. Dashed brackets indicate adnexal malignant cells from patient-matched tissue profiles from Discovery and Test 2. b, MTIL expression in malignant cells (Discovery dataset), stratified by somatic copy number of six respective genes based on patient-matched bulk tumor genomic profile (LMM, n = 40 patients). c, Top CNAs showing a significant (BH FDR < 0.05, LMM; Methods) association with MTIL expression in malignant cells in the Discovery dataset. d, CNA–MTIL–TIL models. e, Deletion (red) of MTIL-up genes and amplification (light blue) of MTIL-down genes that are significantly (BH FDR < 0.05, one side t-test) associated with low T/NK cell levels (estimated based on gene expression of T/NK cell signatures; Methods) in an independent TCGA HGSC cohort of 578 patients. Exact P values are provided in Supplementary Table 9a. f, ELISA quantification of IFN-γ (1:100) and TNF (undiluted) in NK-92 supernatant treated with various concentrations of recombinant human BMP7. g, MTIL chemokines and the matching chemokine receptors in immune cell TIPs. h, Fold change of NK-92 cell migration of CXCR6+ NK-92 cells derived via CRISPR activation (Supplementary Fig. 9) versus control NK-92 cells (transduced with non-targeting control CRISPR activation guides, left) at varying CXCL16 concentrations. In the box plots in a and b, the middle line denotes the median, box edges indicate the 25th and 75th percentiles, and whiskers extend to the most extreme points that do not exceed ±1.5 times the IQR; further outliers are marked individually with circles (minima/maxima). In f and h, error bars represent the mean ± s.d. for f and mean ± s.e.m. for h; comparisons are indicated via brackets; *P < 0.05, **P < 0.01, ***P < 0.001, ****P < 0.0001 (ordinary one-way ANOVA); brackets that are not shown denote nonsignificant (P > 0.05) comparisons. Data from n = 3 biological replicates were collected per condition in f and n = 4 technical replicates were collected per condition in h. Source data
Fig. 6
Fig. 6. Meta-analyses of Perturb-seq datasets identify regulators of the MTIL program.
a,b, Differential MTIL expression (two-sided t-test comparing cells with the respective perturbation to cells with control sgRNAs) for MTIL altering perturbations identified in K562 (myelogenous leukemia) (a) and RPE1 (human retinal pigment epithelial) (b) cell lines Perturb-seq data,. c,d, Representative UMAP embeddings of MTIL altering perturbation: cells were labeled based on the sgRNA detected (top) and based on MTIL expression (bottom) in K562 (c) and RPE1 (d) cell lines. z denotes −log10(P value), two-sided t-test, comparing MTIL expression in the perturbed versus control cells.
Fig. 7
Fig. 7. High-content CRISPR screens identify perturbations that de-repress or repress MTIL.
a, Overview of experimental design. Created with BioRender.com. b, Ovarian cancer cell (TYK-nu) differential fitness (MAGeCK) under CD8+ T cell and NK cell selection pressures. c, UMAP of scRNA-seq profiles from Perturb-seq screen. Each dot corresponds to an ovarian cancer cell (TYK-nu) with 1 of the 232 guides confidently detected, cultured in monoculture or co-culture with NK cells at a 1:1 or a 2.5:1 effector-to-target ratio. d, Differential expression of MTIL genes (Fisher’s combined test; Methods) when comparing ovarian cancer cells with the respective gene KO to those with NTC sgRNAs. e, Differential expression of MTIL-up genes upon different gene KOs under different conditions, shown for genes identified as MTIL repressors or activators. fh, Gene KOs alter the cancer cell transcriptional response to NK cells. f, Differential expression of the gene KO signature in control ovarian cancer cells in monoculture versus co-culture (two-sided t-test). g, Gene KO signature expression in control ovarian cancer cells in monoculture versus co-culture; statistical significance per KO shown in f. h, UMAPs as in c with cells colored according to differential gene KO signature expression.
Fig. 8
Fig. 8. Inhibiting MTIL repressors sensitizes cancer cells to T/NK cell-mediated cytotoxicity.
a, Fluorescent caspase-3/caspase-7 activity monitored in NTC and PTPN1, ACTR8 and B2M KO syngeneic TYK-nu cell lines in monoculture and co-culture with NK-92 cells over 16 h. b, Fluorescent caspase-3/caspase-7 activity monitored in NTC, PTPN1 and ACTR8 KO syngeneic TYK-nu cell lines in monoculture and co-culture with TCR-specific CD8+ T cells over 16 h. In a and b, P values were derived from Satterthwaite’s ANOVA in time-controlled two-sided LMMs; n = 3 technical replicates per experimental condition. c, PTPN1/PTPN2 inhibitor (ABBV-CLS-484) increased NK-mediated cytotoxicity in TYK-nu (left) and OVCAR3 (right) ovarian cancer cell lines in a dose-dependent manner. P values were derived from Satterthwaite’s ANOVA in dose-controlled two-sided LMMs; n = 3 technical replicates per experimental condition. For ac, all data shown represent the mean + s.e.m. GCU, global counting unit. Source data
Extended Data Fig. 1
Extended Data Fig. 1. Cell segmentation.
(a) Representative whole-cell segmentation performed for the Discovery dataset. Input data includes DAPI immunofluorescent (IF) and cell membrane stain. Cell boundaries represented as white contours. This is a single representative sample out of 100. Similar results were obtained for all 100 other samples. (b) Representative nuclear segmentation performed for Validation 1 dataset. Input data includes DAPI IF stain. Cell boundaries represented as white contours. This is a single representative sample out of 32 samples. Similar results were obtained for all other samples. (c) Representative comparison of Mesmer vs. Omnipose cell segmentation in a tissue profile (1 of 100) from the Discovery dataset. (d) Representative comparison of Mesmer Nuclear (left) and Mesmer Nuclear-with-Expansion (right) segmentation in a tissue profile (1 of 32) from Validation 1 dataset. (e) P values denoting if cell type confidence scores are significantly higher (one-sided Wilcoxon sum rank test) for whole cells segmented by Mesmer vs. Omnipose for each cell type in the Discovery dataset. (f) P values denoting if cell type confidence scores are significantly higher (one-sided Wilcoxon sum rank test) in cells segmented by Mesmer Nuclear vs. Mesmer Nuclear-with-Expansion for each cell type in Validation 1 dataset.
Extended Data Fig. 2
Extended Data Fig. 2. Cell type annotations of spatial transcriptomics.
(a) UMAP projection (matches (b) and Fig. 1c) of high confidence (Supplementary Methods) spatial single cell transcriptomes (Discovery dataset); cells colored by overall expression of pre-defined cell type signatures (Supplementary Table 3,a, Methods). (b) UMAP projection of high confidence (top panel, matches (a) and Fig. 1c) spatial single cell transcriptomes (Discovery dataset) to yield a reference map. UMAP projection of all cells in the Discovery dataset (bottom panel) onto the high confidence reference map. (c-d) UMAP embedding of single positive (that is, CD4+ or CD8+) T cell transcriptomes (Discovery dataset), cells colored by (c) CD8 and CD4 expression, and (d) expression of de novo CD8 (left) and CD4 (right) T cell expression signatures. (e) Projection of double negative T/NK cell transcriptomes (Discovery) onto CD8/CD4 T cell reference map in (b), with cells colored by overall expression of the de novo CD8 (left) and CD4 (right) T cell gene signatures (Supplementary Table 3,b). (f) UMAP embedding of CD4 T cell transcriptomes (Discovery dataset), cells colored by CD4 expression (left) and FOXP3 expression (right). (g) UMAP as in (f), with cells (Discovery dataset) colored based on de novo FOXP3+CD4 T cell gene signature expression (left) and pre-defined regulatory T cell (Treg) signature expression (Methods; Supplementary Table 3,a). (h-i) UMAP embedding T/NK single cell transcriptomes in Validation 1 dataset, cells colored by (h) final T/NK cell subtype annotations, (i) detection of (from left to right): CD4, CD8A/B, FOXP3 (regulatory T cell marker), and NCAMI (NK cell marker).
Extended Data Fig. 3
Extended Data Fig. 3. Cross-platform ST data validations.
(a) Hematoxylin & Eosin (H&E) staining (left), Immunofluorescence (middle) of in situ cell type annotations in the Discovery dataset (right) for four representative tissue FOV (4 of 100). (b-c,e-f) cells colored according to cell type legend in (a). (b) H&E staining (left), Immunohistochemistry (IHC) stain for CD163 (middle; monocyte marker) with corresponding in situ cell type annotations (right) in a representative tissue core (1 of 32) in Validation 1 dataset. (c) H&E (left), IHC stain for FOXP3 (middle, Treg marker), and corresponding in situ cell type annotations (right) in a representative tissue (1 of 32) FOV from Validation 1 dataset. (d) H&E stains of HGSC6 omentum tumor tissue (1 of 100) resolving morphology of plasma cells (black arrows) identified based on the Discovery tissue profile shown in panel (a)(iii). (e) H&E (left), in situ cell type annotations from Validation 1 dataset (middle), and Discovery dataset (right) from technical replicate pairs (2 of 39). Each dataset was processed and annotated separately. White box denotes region of tissue profiled by ISS via Xenium in the Validation 1 dataset that corresponds an adjacent region profiled by SMI in the Discovery dataset (same row). (f) Cell type proportion in technical replicates profiled both in the Discovery and Validation 1 datasets. Straight lines correspond to the linear regression fit; grey ribbons correspond to 95% confidence interval; rs denotes the Spearman correlation coefficient.
Extended Data Fig. 4
Extended Data Fig. 4. CD8 T cell states reflect CD8 T cell tumor infiltration levels.
(a) Size and overlap between the tumor infiltration programs (TIPs) identified in the Discovery dataset for the five different immune cell subsets, shown for the up-regulated (left) and down-regulated (right) subsets. (b) Stratification CD8 T cell subsets based on tumor infiltration status (Validation 1 dataset). (c-d) UMAP embedding of CD8 T cells (Discovery dataset) from gene expression only; cells colored by CD8 T cell states (c), overall expression of predefined CD8 T cell signatures. (d). (e) Stratification CD8 T cell subsets based on tumor infiltration status (Discovery dataset). (f) Expression of CD8 TIP in infiltrating vs. non-infiltrating CD8 T cells (Test 1 and Test 2 datasets); p-value derived from one-sided student’s t-test. (g) CD8 TIP expression marks infiltrating CD8 T cells in the Test datasets, shown in situ for a representative whole tissue section (HGSC2, Adnexa, 1 of 4); p-value derived from one-sided student’s t-test. (h) Abundance of malignant cells in a 30um radius of CD8 T cells in Test datasets, stratified by CD8 T cell subset.
Extended Data Fig. 5
Extended Data Fig. 5. MTIL marks T/NK infiltration at micro- and macro-scales.
(a) Statistical significance and effect size showing the association of each gene’s expression in malignant cells with T/NK cell levels, quantified via mixed effect models (two-sided) applied to the Discovery dataset (Methods). (b-d) In the Discovery dataset: MTIL expression in malignant cells as a function of (b) discretized T/NK cell levels across tissue profiles (n = 99 profiles, top) and spatial frames (n = 6699 frames, bottom), (c) T/NK cell levels in spatial frames (n = 6699 frames) across anatomical sites, (d) presence of T/NK cell subtypes in spatial frames (n = 6699 frames): CD4 T cells (left), CD8 T cells (middle), and NK cells (right); p-values derived from one-sided student’s t-test. (e) Cumulative probability analysis of fraction of T/NK cells in spatial frames stratified by MTIL expression in 6 representative tissue profiles (Discovery dataset) shown in Fig. 3c. In (b-d) Boxplots middle line: median; box edges: 25th and 75th percentiles; whiskers: most extreme points that do not exceed ± IQR x 1.5; further outliers are marked individually with circles (minima/maxima).
Extended Data Fig. 6
Extended Data Fig. 6. MTIL is predictive of T/NK infiltration.
(a-d) MTIL expression in malignant cells, stratified by discretized TIL levels in a malignant cell’s niche in (a) Validation 1 dataset, (b) Validation 2 dataset, (c) Test 1 dataset, and (d) Test 2 dataset. (e) MTIL expression in malignant cells, stratified by tissue immune subtyping in Hornburg et al scRNA-seq study. In (a-e) p-value derived from one-sided t-tests. (f) MTIL expression in malignant cells as a predictor of T/NK cell levels. Predictive performances are quantified and visualized via the receiver operating characteristic (ROC) curves shown per ST dataset. Area under the ROC (AUROC) curve is reported in parentheses. (g) In situ MTIL expression marks T/NK cell levels shown in a representative whole tissue section (HGSC1, Adnexa, Test 2 dataset; MTIL expression is higher in TIL-high versus TIL-low niches, p = 2.87 × 10−107, one-sided Wilcoxon rank sum test). A magnified version of region (1) is shown in Fig. 3f, region (2) is magnified in the right image. (h-i) MTIL predicts T/NK cell levels at the microenvironment level in an independent ST SMI data from NSCLC. (h) ROCs depicting prediction performances in NSCLC when predicting the top 10%, 25%, and 50% most T/NK cell rich frames based on the MTIL expression in malignant cells. (i) MTIL expression in NSCLC malignant cells stratified by the level of T/NK cells in their vicinity (‘high’ and ‘low’ depict the top and bottom quartiles, respectively, and ‘moderate’ otherwise). p-value derived from one-sided mixed effect tests. In (a-e, i) boxplots middle line: median; box edges: 25th and 75th percentiles; whiskers: most extreme points that do not exceed ± IQR x 1.5; further outliers are marked individually with circles (minima/maxima).
Extended Data Fig. 7
Extended Data Fig. 7. Establishing an ex vivo model of TCR-dependent T cell cytotoxicity.
(a) Top: NY-ESO-1 [1G4] TCR lentiviral construct used to engineer primary human CD8 T cells. Bottom: NY-ESO-1 peptide with 1G4 epitope lentiviral construct used to edit TYK-nu Cas9 cells to express the 1G4 NY-ESO-1 antigen. A non-functional, extracellular domain of human growth factor receptor (NGFR) was used to detect and isolate NY-ESO-1 expressing cancer cells. Created with BioRender.com. (b) Representative flow cytometric analysis gated on the expression of the non-functional NGFR tag to quantify TYK-nu Cas9 cells transduced to express NY-ESO-1 antigen (TYK-nuCas9,NY-ESO-1+). (c) qPCR quantification of CTAG1B mRNA expression in TYK-nuCas9,NY-ESO-1+ cells relative to A375 melanoma cell line with endogenous CTAG1B expression. (d) Western blot of NY-ESO-1 expression from NY-ESO-1 transduced MDA-MB-231 Cas9, TYK-nuCas9,NY-ESO-1+, TYK-nuCas9, and A375 whole cell lysates. GAPDH was used as a loading control. Data shown in (d) is one representative experiment repeated three times with similar results. (e) Representative flow cytometric analysis of CD8+ T cells isolated from PBMC. (f) Representative flow cytometric analysis of NY-ESO-1 TCR transduced CD8 T cells. HA (α chain) and PC (β chain) double-positive CD8+ T cells were sorted (left). Cells were re-analyzed immediately after sorting to determine sorting quality (middle). Sorted HA+PC+ CD8+ T cells that were frozen and thawed were re-sorted to determine population purity over time (right). (g) TCR-dependent cytotoxicity: NY-ESO-1 TCR expressing primary CD8 T cells were co-cultured with TYK-nuCas9 cells or TYK-nuCas9,NY-ESO-1+ cells at variable effector to target cell ratios (E:T). The percentage of dead cancer cells was calculated by normalizing to cancer cell monoculture conditions. (h) ELISA quantification of IFNγ secreted in the co-culture supernatant (1:1000). In (g) and (h): co-cultures were performed using n = 3 technical replicates per condition and n = 3 different T cell donors; comparisons are indicated with brackets; p-values ****p < 1 × 10⁻⁴ (two-way analysis of variance (ANOVA) with multiple comparisons for (g) and (h)); ‘ns’ denote non-significant (p > 0.05) comparisons. Exact p-values and raw blot images are provided with the Source Data. Data shown for (g) represent mean ± standard deviation and (h) mean ± s.e.m. Source data
Extended Data Fig. 8
Extended Data Fig. 8. Establishing an in vitro cancer-NK model for CRISPR screens.
(a) Western blot of Cas9 protein from WT and Cas9 transduced whole cell lysates. Alpha tubulin measured as a loading control. (b) Representative flow cytometric analysis gated on GFP expression to measure Cas9 efficiency using pMCB306 plasmid. Loss of GFP denotes Cas9 activity (Methods). (c) Western blot of beta-2-microglobulin (B2M) from whole cell lysates of WT, Cas9, and B2MKO TYK-nu. GAPDH measured as a loading control. (d) B2M surface expression by flow cytometry in B2Mwt and B2MKO Cas9 TYK-nu cells. (e) 24-to-72-hour time course cell viability in co-cultures of TYK-nuCas9 and NK-92 cells at variable effector to target cell ratios. Percent killing was calculated by normalizing to monoculture conditions. Co-cultures were performed in 4 replicates per condition as shown. (f) 48-hour cell viability of B2MKO and B2MWT TYK-nu cell lines in co-culture with NK-92 cells. Percent killing was calculated by normalizing to the respective monoculture conditions. Data shown in (a) and (c) are one representative experiment repeated two or more times with similar results. In (e) and (f), co-culture data is represented by mean ± s.e.m. for (e) and mean ± standard deviation for (f) with each experiment performed in n = 4 technical replicates; p-values **** represent p < 1 × 10⁻⁴ and *p < 0.05 (two-way analysis of variance (ANOVA) with multiple comparisons); ‘ns’ shown denote non-significant (p > 0.05) comparisons. Exact p-values and raw blot images are provided with the Source Data. All statistical tests were conducted on GraphPad Prism version 10.2.3. Source data
Extended Data Fig. 9
Extended Data Fig. 9. Perturb-seq screen in ovarian cancer identifies immune response regulators.
(a) Number of cells detected with sgRNAs targeting each gene in the CRISPR knockout (KO) library. (b) Gene expression of MTIL-up genes under different gene KOs. (c) Gene KOs mimic (top and second tows) and repress (third and bottom rows) transcriptional response to NK cells: Expression of KO gene signatures (ACTR8, MED12, IRF1, and STAT1) across ovarian cancer cells (n = 18,585 cells in each row) stratified based on culture condition and gene KO combination. Boxplots middle line: median; box edges: 25th and 75th percentiles; whiskers: most extreme points that do not exceed ± IQR x 1.5; minima and maxima are depicted by extreme ends of whiskers.
Extended Data Fig. 10
Extended Data Fig. 10. Validation of PTPN1 KO and ACTR8 KO in ovarian cancer cells.
(a-b) Discordance of base pairs corresponding to KO target genes (a) PTPN1 and (b) ACTR8 generated from Sanger sequencing using Synthego ICE Analysis tool (v3). Non-targeting control (NTC) depicted in grey. Alignment window for sequences depicted with dashed black bar; interference window for sequences depicted with solid black bar; start of guide sequence is depicted as a grey dotted line.

References

    1. Galon, J. & Bruni, D. Tumor immunology and tumor evolution: intertwined histories. Immunity52, 55–81 (2020). - PubMed
    1. Biswas, S. et al. IgA transcytosis and antigen recognition govern ovarian cancer immunity. Nature591, 464–470 (2021). - PMC - PubMed
    1. Chen, D. S. & Mellman, I. Oncology meets immunology: the cancer–immunity cycle. Immunity39, 1–10 (2013). - PubMed
    1. Leach, D. R., Krummel, M. F. & Allison, J. P. Enhancement of antitumor immunity by CTLA-4 blockade. Science271, 1734–1736 (1996). - PubMed
    1. Chamoto, K., Yaguchi, T., Tajima, M. & Honjo, T. Insights from a 30-year journey: function, regulation and therapeutic modulation of PD1. Nat. Rev. Immunol.10.1038/s41577-023-00867-9 (2023). - PubMed