. 2024 Aug 23;24(1):363.
doi: 10.1186/s12886-024-03553-z.

Higher phosphate concentrations as in aqueous humor of diabetic patients increase intraocular lens calcification

Affiliations

Higher phosphate concentrations as in aqueous humor of diabetic patients increase intraocular lens calcification

Rebecca Buhl et al. BMC Ophthalmol. .

Abstract

Background: Clinical evidence suggests an association between phosphate concentrations in aqueous humor and the risk of intraocular lens (IOL) calcification. To test this hypothesis the influence of different phosphate concentrations on IOL calcification was evaluated in an in vitro electrophoresis model.

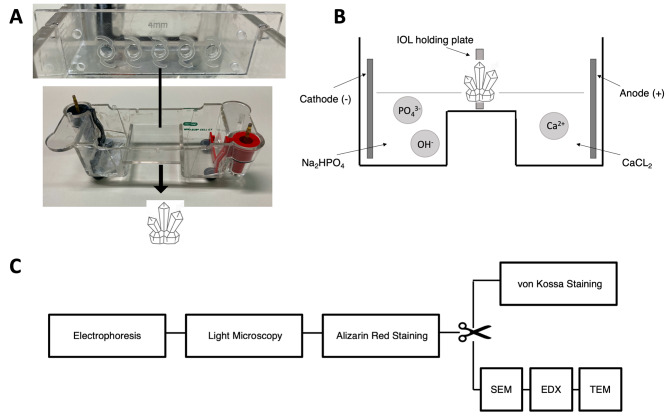
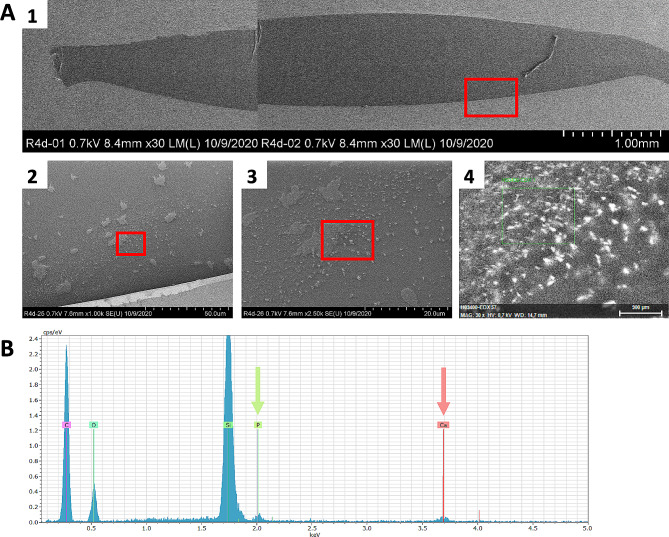
Methods: 20 IOLs of two hydrophilic IOL models (CT Spheris 204, Zeiss; Lentis L-313, Oculentis) and one hydrophobic control IOL model (Clareon CNA0T0, Alcon) were exposed to physiologic and elevated phosphate concentrations, similar to diabetic aqueous humor. IOL calcification was analyzed by alizarin red staining, von Kossa staining, scanning electron microscopy, energy dispersive x-ray spectroscopy and transmission electron microscopy with electron diffraction.

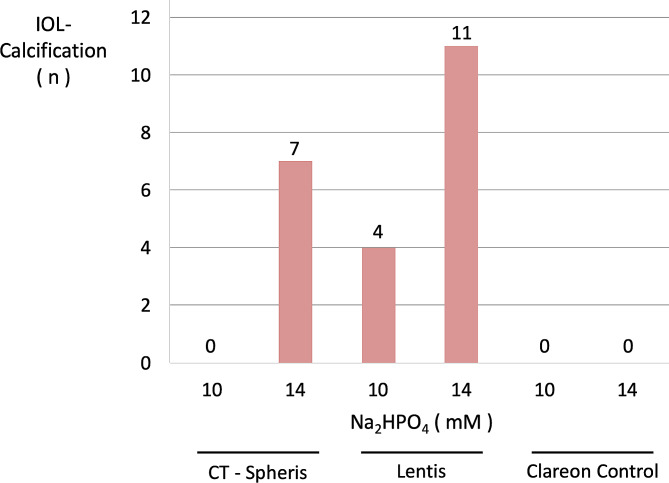
Results: Higher phosphate concentrations were associated with IOL calcification. Analyses of IOL surfaces and cross-sections documented calcification in no CT Spheris and 4 Lentis IOLs following exposure to 10 mM Na2HPO4, compared with 7 and 11 positive analyses following exposure to 14 mM Na2HPO4, respectively. Furthermore, a clear association between IOL calcification and the duration of electrophoresis was demonstrated, confirming increased phosphate concentrations and duration of exposure as risk factors of IOL calcification.

Conclusions: Findings suggest that higher phosphate concentrations in aqueous humor, as seen in diabetic patients, contribute to an increased IOL calcification risk, potentially explaining clinical observations showing an increased risk of IOL calcification in patients with diabetes.

Keywords: Aqueous humor; Diabetes; IOL Calcification; Phosphate concentration; Proliferative diabetic retinopathy.


Conflict of interest statement

R. Buhl, S. Schickhardt, L. Britz, and I. Lieberwirth declare that they have no competing interests. T. Yildirim reports personal fees from Alcon. R. Khoramnia reports grants, personal fees and non-financial support from Alimera, Alcon, Bayer, Johnson & Johnson, Hoya, Novartis, Physiol, Rayner and Roche, grants from Chengdu Kanghong, personal fees and non-financial support from Allergan, Kowa, Oculentis/Teleon, Oculus, Santen, and Acufocus. G. Auffarth reports grants, personal fees, non-financial support and consulting fees from Johnson & Johnson and Alcon, grants, personal fees and non-financial support from Carl Zeiss Meditec, Hoya, Kowa, Oculentis/Teleon, Rayner, Santen, Sifi, and Ursapharm, grants and personal fees from Biotech, Oculus, and EyeYon, grants from Acufocus, Anew, Contamac, Glaukos, Physiol, and Rheacell.

Figures

Fig. 1
Fig. 1
Electrophoresis model and IOL analysis protocol. a. Electrophoresis model with the cathode (left) and anode (right) chamber and the IOL holding plate above. b. Schematic demonstration of the electrophoresis model with the Na2HPO4 solution at the cathode (left) and CaCl2 solution at the anode (right). The phosphate and calcium ions diffuse to the other side respectively, passing through the IOLs in the IOL holding plate, causing crystal formation and therefore IOL calcification. CaCl2: Calcium chloride, Na2HPO4: Disodium hydrogen phosphate. c. Following electrophoresis, the IOLs underwent different analyses as indicated. Gross light microscopy was performed to obtain overview images. Alizarin red staining was used to detect superficial calcium phosphate deposits. Subsequently, the IOL was cut in half and the von Kossa method was used to identify deposits below the IOL polymer surface in cross-sections of one IOL half. SEM and EDX were performed at the Max Planck Institute for polymer research in Mainz (Germany) to detect crystal growth in IOL cross-sections. TEM and ED were performed following EDX, allowing definitive identification of the specific calcium phosphate crystal present. SEM: Scanning electron microscopy, ED: Electron diffraction, EDX: Energy-dispersive X-ray spectroscopy, TEM: Transmission electron microscopy with electron diffraction
Fig. 2
Fig. 2
CT Spheris (top row) and Lentis IOL (bottom row) after 20 h exposure to 10 mM Na2HPO4. Native images show a general overview. Alizarin red staining detects superficial calcium phosphate deposits. Once the IOL has subsequently been halved, von Kossa staining identifies deposits below the IOL polymer surface in cross-sections of the IOL. Similarly to von Kossa staining, SEM identifies crystals below the IOL surface in cross-sections obtained following halving of the IOL (Fig. 4A1). EDX analysis confirmed that the crystals contain calcium and phosphorus. The bottom left scale bars show 0.5 mm. Na2HPO4: Disodium hydrogen phosphate, EDX: Energy-dispersive X-ray spectroscopy, SEM: Scanning electron microscopy
Fig. 3
Fig. 3
CT Spheris (top row), Lentis (middle row) and Clareon IOL (bottom row) after 20 h exposure to 14 mM Na2HPO4. Native images show a general overview. Alizarin red staining detects superficial calcium phosphate deposits. Once the IOL has subsequently been halved, von Kossa staining identifies deposits below the IOL polymer surface in cross-sections of the IOL. Similarly to von Kossa staining, SEM identifies crystals below the IOL surface in cross-sections obtained following halving of the IOL (Fig. 4A1). EDX analysis confirmed that the crystals contain calcium and phosphorus. Compared to the CT Spheris (top row) and Lentis (middle row) IOLs, no positive histologic staining occurred in the Clareon control IOL and SEM images obtained of both surfaces and cross-sections of the IOL remained free of any crystal growth. The bottom left scale bars show 0.5 mm. Na2HPO4: Disodium hydrogen phosphate, EDX: Energy-dispersive X-ray spectroscopy, SEM: Scanning electron microscopy
Fig. 4
Fig. 4
Both SEM overview and magnification as well as EDX microanalysis of crystal growth in the Lentis IOL following 20 h exposure to 14 mM Na2HPO4. a1. SEM overview of the investigated IOL cross-section. a2,3. SEM magnification of the investigated IOL cross-section documenting calcium phosphate crystal growth. a4. EDX analysis of the precise area indicated. b. Analysis of the elements present shows distinctive peaks for calcium (Ca) and phosphorus  (P) and confirms that the crystal contains both elements. The silicon peak (Si) is an artefact created because a silicon wafer is used in the analysis. The peaks for carbon (C) and oxygen (O) are also expected as these are elements contained in hydroxyapatite, the present calcium phosphate salt. Na2HPO4: Disodium hydrogen phosphate, SEM: Scanning electron microscopy, EDX: Energy-dispersive X-ray spectroscopy
Fig. 5
Fig. 5
Electron crystallography of crystal growth in the Lentis IOL polymer following 20 h exposure to 14 mM Na2HPO4. a. Transmission electron microscopy demonstrating crystal growth. b. Crystal electron diffraction pattern, used to identify the specific chemical composition and crystal structure in the calcium phosphate crystal present. c. The very high match between the crystals’ electron diffraction pattern (gross, blue line) and the database electron diffraction pattern for hydroxyapatite (marker 1, green lines) confirms that the crystal is made of hydroxyapatite. Na2HPO4: Disodium hydrogen phosphate
Fig. 6
Fig. 6
Qualitative analysis of IOL calcification based on SEM analyses. Both surfaces and sides of the IOL’s cross-sections were analyzed for crystal growth (present/not present) after every duration of exposure (5, 10, 15 and 20 h). C: control IOL, h: hours, mM: millimolar
Fig. 7
Fig. 7
Total number of documented IOL calcifications in SEM analyses (present/not present) for every IOL model and concentration tested (Fig. 6), illustrating the clear association between Na2HPO4 concentration and IOL calcification. Na2HPO4: Disodium hydrogen phosphate
Fig. 8
Fig. 8
Lentis IOLs following 5 (a), 10 (b) and 20 h (c) of exposure to 14 mM Na2HPO4, illustrating the association between degree of calcification and duration of exposure. Na2HPO4: Disodium hydrogen phosphate
Fig. 9
Fig. 9
Comparison of crystal growth in SEM magnification of the CT Spheris IOL following 20 h exposure to 10 mM and 14 mM Na2HPO4. a. Magnification of CT Spheris IOL cross-section following 20 h exposure to 10 mM Na2HPO4, documenting no calcium phosphate crystal growth. b. Magnification of CT Spheris IOL cross-section following 20 h exposure to 14 mM Na2HPO4, documenting calcium phosphate crystal growth and demonstrating that crystal growth only occurred following exposure to the elevated Na2HPO4 concentration. SEM: Scanning electron microscopy, Na2HPO4: Disodium hydrogen phosphate

References

    1. Gartaganis SP, Prahs P, Lazari ED, et al. Calcification of Hydrophilic Acrylic intraocular lenses with a hydrophobic surface: Laboratory Analysis of 6 cases. Am J Ophthalmol. 2016;168:68–77. 10.1016/j.ajo.2016.04.018. 10.1016/j.ajo.2016.04.018 - DOI - PubMed
    1. Gartaganis SP, Kanellopoulou DG, Mela EK, et al. Opacification of hydrophilic acrylic intraocular lens attributable to calcification: investigation on mechanism. Am J Ophthalmol. 2008;146:395–403. 10.1016/j.ajo.2008.04.032. 10.1016/j.ajo.2008.04.032 - DOI - PubMed
    1. Neuhann T, Yildirim TM, Son HS, et al. Reasons for explantation, demographics, and material analysis of 200 intraocular lens explants. J Cataract Refract Surg. 2020;46:20–6. 10.1016/j.jcrs.2019.08.045. 10.1016/j.jcrs.2019.08.045 - DOI - PubMed
    1. Łabuz G, Yildirim TM, van den Berg T, et al. Assessment of straylight and the modulation transfer function of intraocular lenses with centrally localized opacification associated with the intraocular injection of gas. J Cataract Refract Surg. 2018;44:615–22. 10.1016/j.jcrs.2018.01.033. 10.1016/j.jcrs.2018.01.033 - DOI - PubMed
    1. Yildirim TM, Labuz G, Khoramnia R, et al. Impact of primary calcification in segmented refractive bifocal intraocular lenses on Optical Performance Including Straylight. J Refract Surg. 2020;36:20–7. 10.3928/1081597x-20191119-01. 10.3928/1081597x-20191119-01 - DOI - PubMed

LinkOut - more resources