. 2024 Aug 23;22(1):411.
doi: 10.1186/s12964-024-01794-5.

ΔNp63 bookmarks and creates an accessible epigenetic environment for TGFβ-induced cancer cell stemness and invasiveness

Affiliations

ΔNp63 bookmarks and creates an accessible epigenetic environment for TGFβ-induced cancer cell stemness and invasiveness

Eleftheria Vasilaki et al. Cell Commun Signal. .

Abstract

Background: p63 is a transcription factor with intrinsic pioneer factor activity and pleiotropic functions. Transforming growth factor β (TGFβ) signaling via activation and cooperative action of canonical, SMAD, and non-canonical, MAP-kinase (MAPK) pathways, elicits both anti- and pro-tumorigenic properties, including cell stemness and invasiveness. TGFβ activates the ΔNp63 transcriptional program in cancer cells; however, the link between TGFβ and p63 in unmasking the epigenetic landscape during tumor progression allowing chromatin accessibility and gene transcription, is not yet reported.

Methods: Small molecule inhibitors, including protein kinase inhibitors and RNA-silencing, provided loss of function analyses. Sphere formation assays in cancer cells, chromatin immunoprecipitation and mRNA expression assays were utilized in order to gain mechanistic evidence. Mass spectrometry analysis coupled to co-immunoprecipitation assays revealed novel p63 interactors and their involvement in p63-dependent transcription.

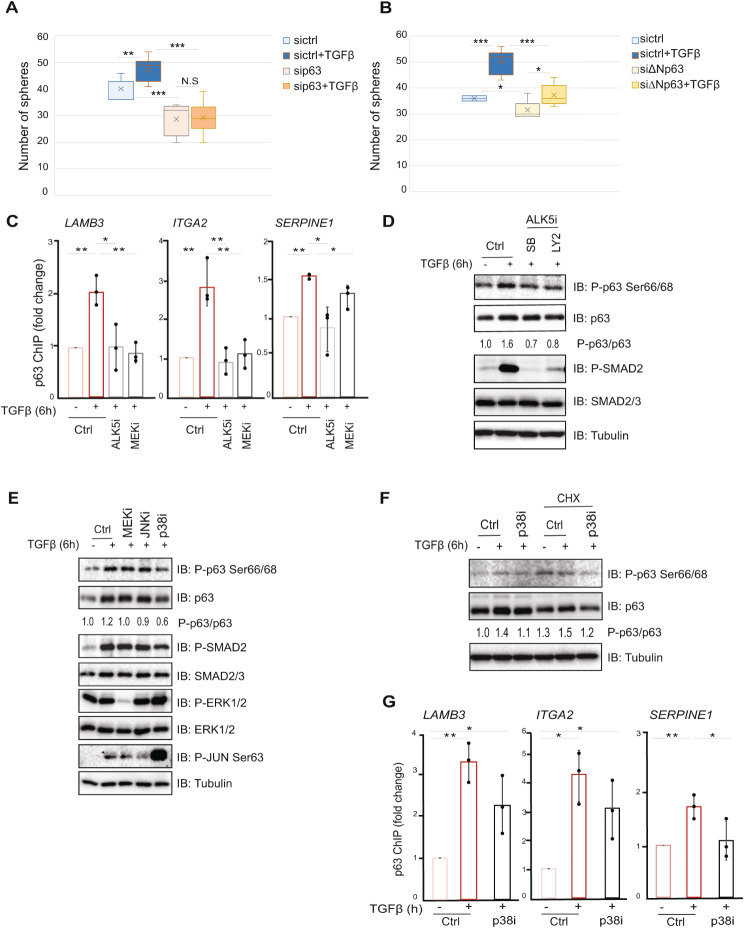
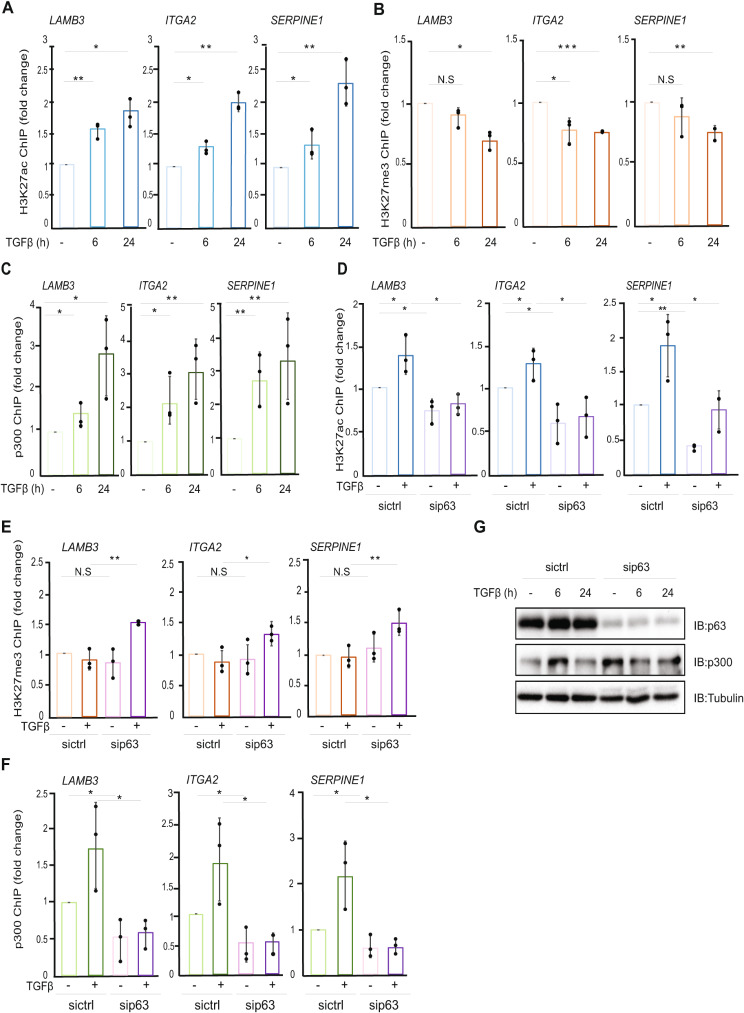
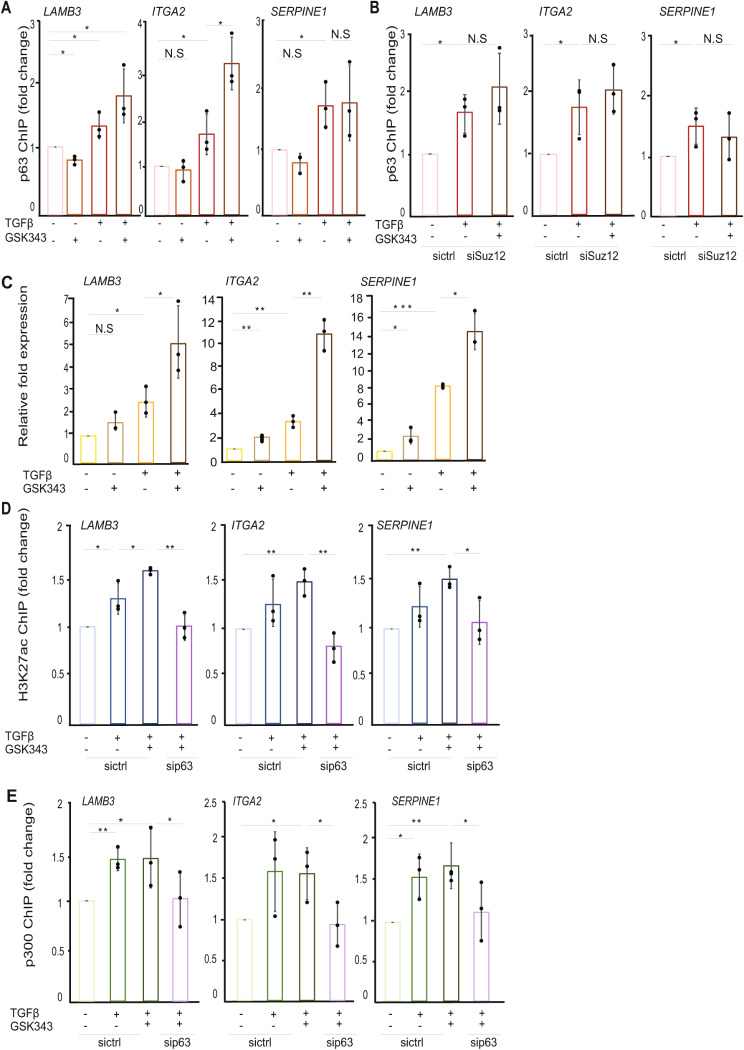
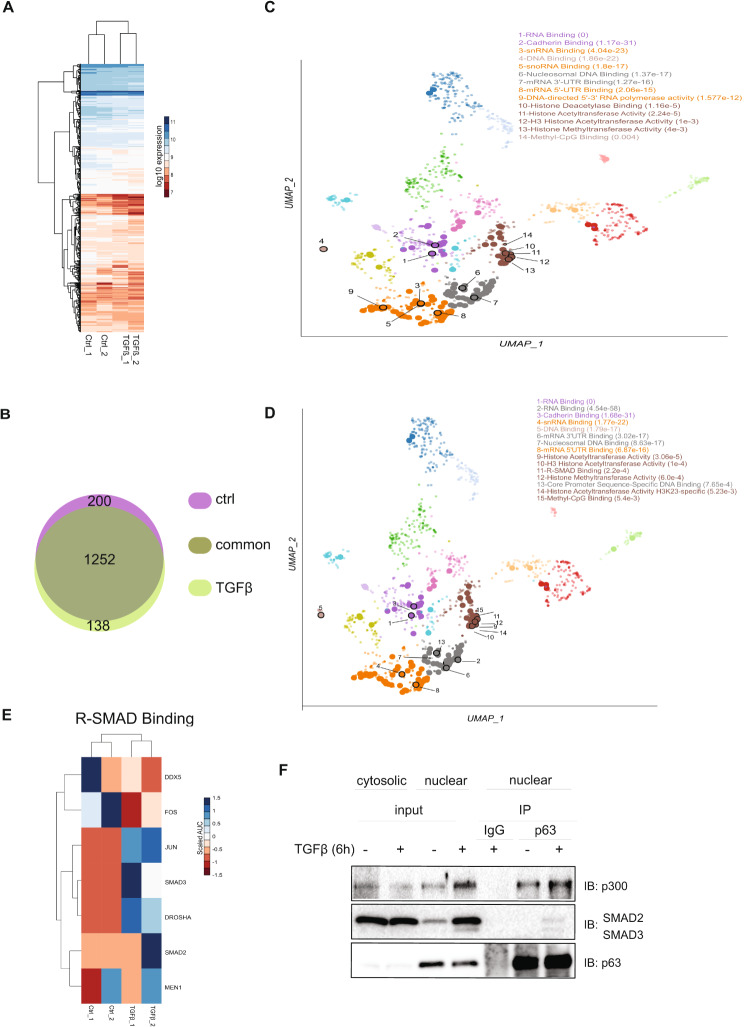
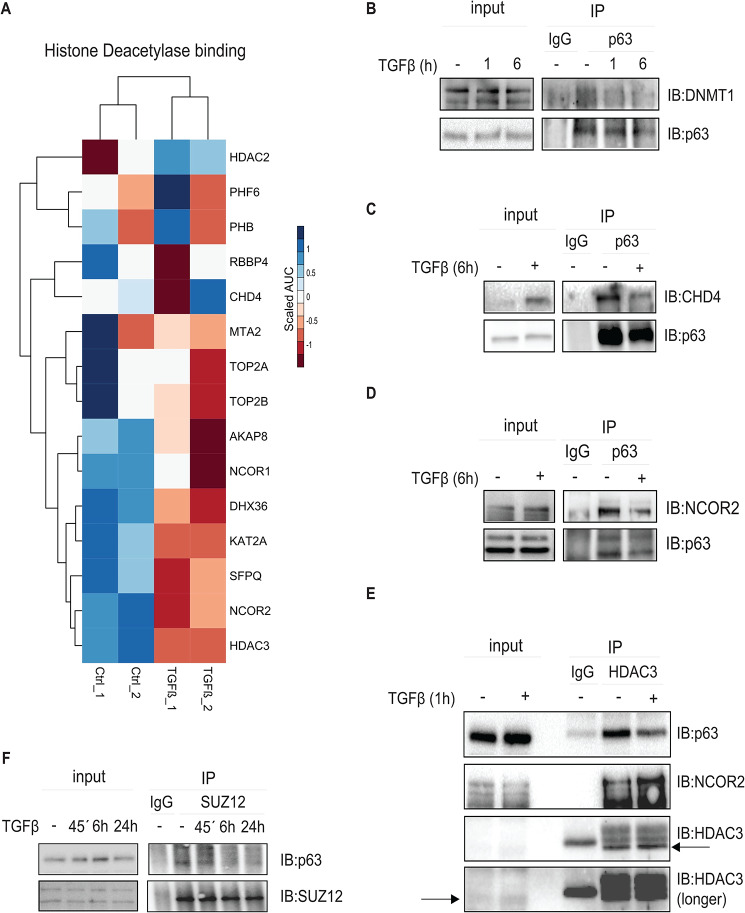
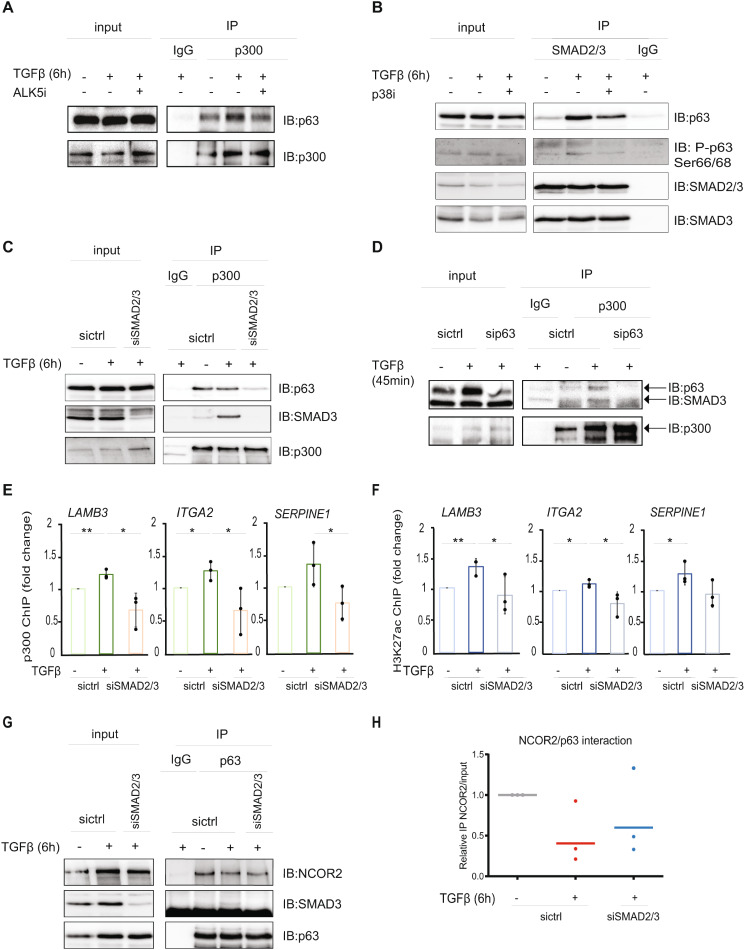
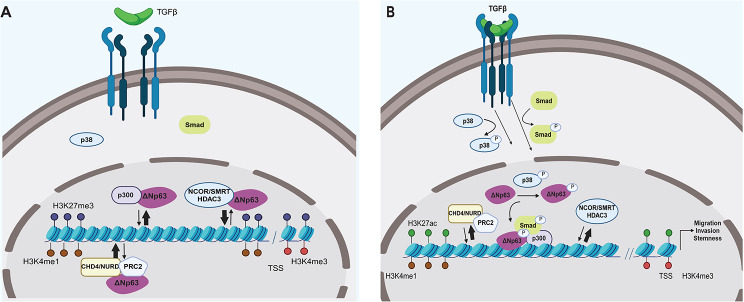
Results: The sphere-forming capacity of breast cancer cells was enhanced upon TGFβ stimulation and significantly decreased upon ΔNp63 depletion. Activation of TGFβ signaling via p38 MAPK signaling induced ΔNp63 phosphorylation at Ser 66/68 resulting in stabilized ΔNp63 protein with enhanced DNA binding properties. TGFβ stimulation altered the ratio of H3K27ac and H3K27me3 histone modification marks, pointing towards higher H3K27ac and increased p300 acetyltransferase recruitment to chromatin. By silencing the expression of ΔNp63, the TGFβ effect on chromatin remodeling was abrogated. Inhibition of H3K27me3, revealed the important role of TGFβ as the upstream signal for guiding ΔNp63 to the TGFβ/SMAD gene loci, as well as the indispensable role of ΔNp63 in recruiting histone modifying enzymes, such as p300, to these genomic regions, regulating chromatin accessibility and gene transcription. Mechanistically, TGFβ through SMAD activation induced dissociation of ΔNp63 from NURD or NCOR/SMRT histone deacetylation complexes, while promoted the assembly of ΔNp63-p300 complexes, affecting the levels of histone acetylation and the outcome of ΔNp63-dependent transcription.

Conclusions: ΔNp63, phosphorylated and recruited by TGFβ to the TGFβ/SMAD/ΔNp63 gene loci, promotes chromatin accessibility and transcription of target genes related to stemness and cell invasion.

Keywords: Chromatin accessibility; Protein-protein interaction; Signal transduction; Transcription; Transforming growth factor β (TGFβ); p63.


Conflict of interest statement

The authors declare no competing interests.

Figures

Fig. 1
Fig. 1
Activation of TGFβ signaling enhances p63 recruitment to DNA via ALK5/p38 kinase-dependent phosphorylation. (A-B) Sphere formation assay of HCC1954 cells in the presence or absence of TGFβ as indicated. Cells were transfected with non-targeting control (sictrl) siRNA or with siRNAs specific against all p63 isoforms (A) or specific against the ΔNp63 isoforms (B). Cells were cultured in stem cell medium in 96-well ultra-low attachment plates. Sphere numbers per well were counted under microscopy. (C) ChIP-qPCR showing the effect of ALK5 kinase or MEK1/2 kinase inhibition on the TGFβ-induced recruitment of p63 to DNA. Values are expressed as relative fold-change corresponding to the enrichment of p63 antibody in each gene locus under treatment conditions divided by the enrichment in the control condition (ctrl). (D-E) TGFβ stimulation induced ALK5- and p38-dependent phosphorylation of ΔNp63 at Ser66/Ser68. Immunoblotting (IB) analysis of MCF10A MII cells, treated with the indicated kinase inhibitors or DMSO (ctrl) in the presence of TGFβ for 6 h. (F) Cycloheximide (CHX) chase experiment in MCF10A MII cells. Lysates of cells treated or not with p38 inhibitor (SB203580) or DMSO (ctrl) in the presence or not of TGFβ for 6 h were analyzed by IB with the indicated antibodies. In panels D-F, one of four independent experiments with similar results, is shown. The intensities of the p-p63 Ser66/68, p63 and tubulin bands from each of the four independent experiments were quantified and the values were used to calculate the ratio of p-p63/p63, presented between the corresponding immunoblots. (G) ChIP-qPCR showing the effect of p38 inhibition on the TGFβ-induced recruitment of p63 to DNA. Graphs presented in panels A-C and G show results of three independent experiments as mean ± SD; * P < 0.05, ** P < 0.01, *** P < 0.001. The dots in the graphs of panels C and G represent the individual values from each of the three independent ChIP experiments
Fig. 2
Fig. 2
TGFβ-induced gene expression correlates with changes in histone modification marks orchestrated by p63. (A-B) ChIP-qPCR showing the changes in H3K27ac (A) and H3K27me3 (B) histone marks of the indicated gene loci in MCF10A MII cells, incubated in starvation medium overnight and stimulated or not with TGFβ for the indicated time-periods. (C) ChIP-qPCR showing the effect of TGFβ treatment on p300 binding to the indicated gene loci in MCF10A MII cell. (D-E) ChIP-qPCR experiments showing the effect of p63 depletion on H3K27ac (D) and H3K27me3 (E) marks. MCF10A MII cells transfected with non-targeting control (sictrl) siRNA or with siRNA specific against all p63 isoforms were incubated overnight in starvation medium and treated or not with TGFβ for 24 h. (F) Effect of p63 depletion on p300 recruitment to chromatin. MCF10A MII cells transfected with siRNAs and treated or not with TGFβ as in panels D and E, were subjected to ChIP with p300 antibody and subsequent qPCR analysis. (G) Effect of p63 depletion on p300 expression. MCF10A MII cells transfected with non-targeting control (sictrl) siRNA or with siRNAs specific against all isoforms of p63 were treated or not with TGFβ for 6–24 h and subjected to IB analysis with the indicated antibodies. Data are representative of three independent experiments with similar results. Graphs presented in panels A-F show results of three independent experiments as mean ± SD; * P < 0.05, ** P < 0.01, *** P < 0.001, N.S: not significant difference. The dots represent the individual values from each of the three independent experiments
Fig. 3
Fig. 3
H3K27me3 inhibition increases p63 and p300 recruitment to chromatin only in the presence of active TGFβ signaling. (A) ChIP-qPCR showing the recruitment of p63 to the indicated gene loci in MCF10A MII cells treated or not with an EZH2 inhibitor (GSK343) for 48 h in the presence or not of TGFβ stimulation for 24 h. (B) ChIP-qPCR showing the effect of SUZ12 depletion in combination with treatment with a GSK343 inhibitor on the TGFβ-induced p63 binding to the indicated gene loci. (C) qRT-PCR analysis of the effect of TGFβ stimulation and GSK343 inhibition on the expression of LAMB3, ITGA2 and SERPINE1 genes. MCF10A MII cells were incubated overnight in starvation medium and subsequently treated with 5 µΜ GSK343 inhibitor for 24 h before the stimulation or not with TGFβ for an additional 24 h. (D, E) Effect of p63 silencing on the H3K27ac mark and the recruitment of p300 in MCF10A MII cells treated or untreated with TGFβ and GSK343. Lysates of MCF10A MII cells were subjected to ChIP with H3K27ac (D) of p300 (E) antibodies and subsequent qPCR analysis. Graphs presented in panels A-E show results of three independent experiments as mean ± SD; * P < 0.05, ** P < 0.01, ***P < 0.001, N.S: not significant difference. The dots represent the individual values from each of the three independent experiments
Fig. 4
Fig. 4
Identification of ΔNp63-interacting proteins. (A) Heatmap showing the peptide intensities derived from the MS/MS spectrum for control samples (Ctrl) and TGFβ-treated samples. Log10 expression represents peptide intensities derived from quantifying area under curve (AUC) of significantly enriched peaks. (B) Illustration of the number of the identified p63 interactors, enriched in both control condition and TGFβ-treated condition (common), uniquely enriched in control condition (control) or uniquely enriched in TGFβ-treated condition (TGFβ). C, D UMAP plots visualizing the most significantly enriched molecular functions derived from the gene ontology database and associated with proteins identified in control samples (C) and TGFβ-treated samples (D). (E) Heatmap depicting the intensity patterns of proteins involved in R-SMAD binding in the respective samples. Scaled AUC was calculated using Z-score method representing quantified AUC of peptide intensities. (F) p63 interaction with p300 and SMAD2/3. MCF10A MII cells, starved in 0.2% FBS medium and stimulated with TGFβ or not for 6 h, were subjected to nuclear-cytosolic fractionation. The nuclear lysates (input nuclear) were immunoprecipitated (IP) with p63-specific antibody, or IgG control, and analyzed by immunoblotting utilizing specific antibodies, as indicated. One of three independent experiments with similar results, is shown
Fig. 5
Fig. 5
Activation of TGFβ signaling induces a switch in the ΔNp63 epigenetic interactors. (A) Heatmap depicting the intensity patterns of proteins involved in histone deacetylase binding in the respective samples. Scaled AUC was calculated using Z-score method representing quantified AUC of peptide intensities. (B-E) MCF10A MII cells, starved in 0.2% FBS medium and stimulated with TGFβ or not for the indicated time points, were subjected to immunoprecipitation (IP) with a p63-specific antibody (B-D) or an HDAC3-specific antibody (E), or IgG control, and analyzed by IB with the antibodies recognizing p63 (B-E) and DNMT1 (B), CHD4 (C), NCOR2 (D) or HDAC3 (E). In E, arrows indicate the band detecting HDAC3 expression. (F) SUZ12 interaction with p63. MCF10A MII cells, starved in 0.2% FBS medium and stimulated with TGFβ for the indicated time periods, were subjected to IP with SUZ12-specific antibody and subsequent IB with specific antibodies. In panels B-F, one of three independent experiments with similar results, is shown
Fig. 6
Fig. 6
Activation of SMAD2 and SMAD3 transcription factors drives the p63 selectivity on histone modulation complexes. (A) Effect of ALK5 inhibition on p63/p300 interaction. Lysates of MCF10A MII cells treated with ALK5 kinase inhibitor (SB505124) or not (control) in the presence of TGFβ stimulation were subjected to IP with p300-specific antibody or IgG control, and analyzed by IB with the indicated antibodies. (B) Effect of p38 inhibition on p63/SMAD2/3 interaction. Lysates of MCF10A MII cells treated with p38 kinase inhibitor (SB203580) or not (control) in the presence of TGFβ stimulation were subjected to IP with SMAD2/3 antibody or IgG control, and analyzed by IB with the indicated antibodies. (C) Effect of SMAD2/3 depletion on p63/p300 interaction. MCF10A MII cells transfected with non-targeting control (sictrl) siRNA or with siRNA specific against SMAD2 and SMAD3 were incubated in starvation medium and treated or not with TGFβ for 6 h. Cell lysates were subjected to IP with p300-specific antibody or IgG control, and analyzed by IB with the indicated antibodies. (D) Effect of p63 depletion on SMAD3/p300 interaction. MCF10A MII cells transfected with non-targeting control (sictrl) siRNA or with siRNA specific against all p63 isoforms were incubated in starvation medium overnight and treated or not with TGFβ for 45 min. Cell lysates were subjected to IP with a p300-specific antibody or IgG control, and analyzed by IB with the indicated antibodies. (E, F) Effect of SMAD2/3 depletion on p300 recruitment to chromatin (E) and H3K27ac (F). MCF10A MII cells transfected with siRNAs and starved as in panel C were treated or not with TGFβ for 24 h. Cell lysates were subjected to ChIP with p300 (E) or H3K27ac (F) antibodies and subsequent qPCR analysis. Graphs presented in panels E-F show results of three independent experiments as mean ± SD; * P < 0.05, ** P < 0.01. The dots represent the individual values from each of the three independent experiments. (G) Effect of SMAD2/3 depletion on p63/NCOR2 interaction. MCF10A MII cells transfected with siRNAs and starved as in panel A were treated or not with TGFβ for 6 h. Cell lysates were subjected to IP with p63 and analyzed by IB with the indicated antibodies. One of three independent experiments with similar results, is shown. (H) Graph illustrating the relative IP NCOR2/input as average values from the quantification of three independent experiments performed as described in panel G. The dots represent the individual values from each of the three independent experiments
Fig. 7
Fig. 7
Schematic illustration of the effect of active TGFβ signaling on ΔNp63-dependent transcription. (A) In the absence of active TGFβ pathway, ΔNp63 is bound to NURD/PRC2 and NCOR/SMRT/HDAC3 complexes on TGFβ/SMAD target regulatory genomic loci. These regions showing high H3K4me1 are bookmarked for transcription by ΔNp63; however, the presence of the H3K27 tri-methylation mark results in condensed chromatin and inactive transcription. (B) Activation of TGFβ signaling leads to phosphorylation of ΔNp63 at Ser66/68 via p38 MAPK, nuclear translocation of SMAD2/3 transcription factors and complex formation between ΔNp63, SMAD2/3 and p300. p300 catalyzes the acetylation of K27 on H3, which promotes chromatin accessibility and activation of gene transcription favoring cancer cell stemness and invasiveness. Dynamic interactions with chromatin are shown with two anti-parallel arrows. Arrow thickness correlates to the prevalent interaction (association or dissociation). Created with BioRender.com

References

    1. Van Bokhoven H, Hamel BCJ, Bamshad M, Sangiorgi E, Gurrieri F, Duijf PHG, et al. p63 gene mutations in EEC Syndrome, Limb-Mammary Syndrome, and isolated Split Hand–Split Foot Malformation Suggest a genotype-phenotype correlation. Am J Hum Genet. 2001;69:481–92. 10.1086/323123 - DOI - PMC - PubMed
    1. Suh E-K, Yang A, Kettenbach A, Bamberger C, Michaelis AH, Zhu Z, et al. p63 protects the female germ line during meiotic arrest. Nature. 2006;444:624–8. 10.1038/nature05337 - DOI - PubMed
    1. Amelio I, Grespi F, Annicchiarico-Petruzzelli M, Melino G. p63 the guardian of human reproduction. Cell Cycle. 2012;11:4545–51. 10.4161/cc.22819 - DOI - PMC - PubMed
    1. Soares E, Zhou H. Master regulatory role of p63 in epidermal development and disease. Cell Mol Life Sci. 2018;75:1179–90. 10.1007/s00018-017-2701-z - DOI - PMC - PubMed
    1. Chen Y, Peng Y, Fan S, Li Y, Xiao ZX, Li C. A double dealing tale of p63: an oncogene or a tumor suppressor. Cell Mol Life Sci. 2018;75:965–73. 10.1007/s00018-017-2666-y - DOI - PMC - PubMed

MeSH terms

Substances

LinkOut - more resources