. 2024 Oct 14;52(18):10934-10950.
doi: 10.1093/nar/gkae724.

The impact of the embryonic DNA methylation program on CTCF-mediated genome regulation

Affiliations

The impact of the embryonic DNA methylation program on CTCF-mediated genome regulation

Ana Monteagudo-Sánchez et al. Nucleic Acids Res. .

Abstract

During mammalian embryogenesis, both the 5-cytosine DNA methylation (5meC) landscape and three dimensional (3D) chromatin architecture are profoundly remodeled during a process known as 'epigenetic reprogramming.' An understudied aspect of epigenetic reprogramming is how the 5meC flux, per se, affects the 3D genome. This is pertinent given the 5meC-sensitivity of DNA binding for a key regulator of chromosome folding: CTCF. We profiled the CTCF binding landscape using a mouse embryonic stem cell (ESC) differentiation protocol that models embryonic 5meC dynamics. Mouse ESCs lacking DNA methylation machinery are able to exit naive pluripotency, thus allowing for dissection of subtle effects of CTCF on gene expression. We performed CTCF HiChIP in both wild-type and mutant conditions to assess gained CTCF-CTCF contacts in the absence of 5meC. We performed H3K27ac HiChIP to determine the impact that ectopic CTCF binding has on cis-regulatory contacts. Using 5meC epigenome editing, we demonstrated that the methyl-mark is able to impair CTCF binding at select loci. Finally, a detailed dissection of the imprinted Zdbf2 locus showed how 5meC-antagonism of CTCF allows for proper gene regulation during differentiation. This work provides a comprehensive overview of how 5meC impacts the 3D genome in a relevant model for early embryonic events.


Figures

Graphical Abstract
Graphical Abstract
Figure 1.
Figure 1.
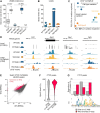
CTCF exhibits potential 5meC-sensitivity at a minority of loci. (A) Distribution of average 5meC levels over 10 kb bins (n = 273 121) in E3.5 inner cell mass cells (ICM), the E7.5 epiblast, Dnmt WT (WT) and Dnmt triple KO (TKO) embryonic stem cells (ESCs) and Epiblast-like cells (EpiLCs). Data from Wang et al. 2014 (in vivo), Richard Albert et al. (WT ESC & EpiLC) and Domcke et al. (TKO ESC). Boxplots represent the median (line inside the box), where 50% of the data are distributed (the box), and whiskers denote the values lying within 1.5 times the interquartile range. (B) Luminometric methylation assay (LUMA) depicting global 5meC levels in WT ESCs grown in serum and 2i + vitC, TKO ESCs grown in 2i + vitC and WT and TKO EpiLCs (Day 4). Data are represented as the mean of two replicates, which are included as individual data points. (C) Principal component analysis (PCA) plot of CTCF CUT&RUN data in WT and TKO ESCs and EpiLCs. Individual replicates and the percent variation explained by each principal component are shown. (D) UCSC genome browser screenshots of putative 5meC-sensitive CTCF binding sites at the Csf1 and Nrp2 loci. DNA methylation levels in WT ESCs and EpiLCs and the location of Refseq genes and CTCF binding motifs are included. The strand (±) and position (5, 7 or 15) of the methylated CpG is indicated. Cell-type specific CTCF binding at the naïve pluripotency marker gene Rex1 (Zfp42) and the formative pluripotency marker gene Fgf5 are shown for comparison. Csf1: chr3:107728899–107729432, Nrp2: chr1:62738262–62738551, Rex1: chr8:43305548–43306216, Fgf5: chr5:98255482–98256478. (E) 2D scatterplot showing CTCF peak enrichment levels (RPKM) in WT and TKO EpiLCs. Statistically enriched peaks in TKO (linear modeling with Limma, fold-change > 2, t-test adjusted Pvalue < 0.05) are highlighted in red. (F) Violin plot of the distribution of EpiLC DNA methylation levels within CTCF peaks. Peaks are categorized as in E. (G) Bar plot showing the proportion of CTCF peaks that overlap a canonical CTCF binding motif with a CpG at position 5, 7 or 15. The CTCF sequence motif is included (JASPAR MA0139.1).
Figure 2.
Figure 2.
Chromatin architecture is remodeled during EpiLC differentiation in WT and TKO backgrounds. (A) PCA plot showing the variation in 3D CTCF contacts between WT and TKO ESCs and EpiLCs. (B) 2D scatterplot of CTCF contacts between WT ESCs and EpiLCs. All significant loops are shown in gray. Loops with enriched contacts (>4 reads, FDR < 0.05) in EpiLCs are highlighted in green and ESC-enriched loops are highlighted in purple. (C) PCA plot showing the variation in 3D H3K27ac interaction contacts between WT and TKO ESCs and EpiLCs. (D) 2D scatterplot of H3K27ac contacts between WT ESCs and EpiLCs as in B. (E) UCSC genome browser screenshots of the naïve pluripotency marker gene Rex1 (Zfp42) and the formative pluripotency marker gene Fgf5 loci. Note the ESC-specific CTCF and H3K27ac binding, CTCF and H3K27ac looping, and gene expression of Rex1 in WT and TKO backgrounds. EpiLC-specific binding, loop contacts and expression of Fgf5 is included for comparison. Rex1: chr8:43264884–43373313, Fgf5: chr5:98139881–98390116. Gray loops represent significant interactions that are consistent across the data being compared, purple are ESC-specific, and green are EpiLC-specific.
Figure 3.
Figure 3.
A subset of CTCF loops and promoter-enhancer contacts are disrupted in 5meC-deficient EpiLCs. (A) 2D scatterplots of CTCF loop contacts in WT versus TKO ESCs (left) and EpiLCs (right). Loops with significantly enriched contacts in TKO cells (FDR < 0.05) are highlighted in red. (B) Schema showing two potential scenarios resulting from global DNA hypomethylation in TKO EpiLCs (right) due to CTCF binding and altered promoter-enhancer contact formation and nearby gene transcription. Top: a hypomethylated CTCF binding site creates a loop that increases enhancer-promoter interactions. Bottom: a hypomethylated CTCF binding site results in a loop that insulates enhancer-promoter interactions. (C) Bar plot of Zdbf2 expression levels (RPKM) in a time course assay of ESC-to-EpiLC differentiation in WT and TKO cells. Bars represent the mean, and replicates are shown as dots. D: days EpiLC differentiation. Statistically significant changes in gene expression between WT and TKO (Linear modeling with Limma, fold-change > 1, t-test adjusted P value < 0.05) are indicated by asterisks. (D) Contact matrix (top), genome browser screenshot (middle) and virtual 4C (bottom) plots of the Zdbf2 locus. Top: differential CTCF contacts between WT and TKO EpiLCs are displayed, where each pixel represents a 1 kb bin. The TKO-enriched contacts between the TAD border and the putative 5meC-sensitive CTCF binding site is magnified in the inset. Reference points 1 (CTCF) and 2 (H3K27ac) for the virtual 4C plots (bottom) are indicated by a dashed box. Middle: browser screenshot showing CpG methylation, CTCF and H3K27ac enrichment levels and loops. Gray loops represent significant interactions that are consistent across the data being compared, orange loops are TKO-specific. Refseq genes, CpG islands, CTCF motifs (positive strand in red, negative strand in blue) are included. The CTCF motif with a CpG at position 5 that underlies a putative 5meC-sensitive CTCF peak is highlighted. Bottom: Virtual 4C plots of reference points 1 (CTCF) and 2 (H3K27ac) showing interaction frequencies between the reference point and adjacent area. The background model is shown as a dotted gray line. Statistically enriched contacts (chi-squared test, alpha < 0.25) are highlighted in blue (WT EpiLC-specific) or orange (TKO EpiLC-specific). Coordinates: chr1:63165972–63304123.
Figure 4.
Figure 4.
Precision cytosine demethylation at the Zdbf2 locus results in increased CTCF binding and failure to completely activate gene expression. (A) Schema depicting the site-directed 5meC erasure strategy. A catalytically inactive Cas9 (dCas9, gray rectangle) fused to a SunTag (five gray circles) is recruited to target chromatin by one or several gRNAs and in turn recruits the catalytic domain of TET1 (purple) via scFv interactions with the SunTag. Cells are differentiated for 4 days (left) and assessed for 5meC levels, CTCF binding, nearby gene expression and 3D conformation compared to control cells expressing non-target gRNA (right). (B) Bisulphite-pyrosequencing results of cells expressing non-target sgRNA (black) and cells expressing sgRNAs (purple) targeted to the Zdbf2 CTCF binding site. The position of each CpG within the amplicon is indicated, and the CpG corresponding to CpG5 in the canonical CTCF binding motif is highlighted by the red box. Data are shown as mean ± standard error for three replicates. (C) ChIP-qPCR results of the same cells as in B. Data are shown as mean ± standard error for three replicates represented by unfilled circles. (D) RT-qPCR results of the same cells as in B over a time course of 7 days of EpiLC differentiation. Expression of each replicate was normalized to two housekeeping genes (Rrm2 & Rplp0), and then to WT ESCs. Data are shown as mean ± standard error for three replicates. (E) UCSC genome browser screenshot of the Zdbf2 locus showing 4C-seq results of the same cells as in B. The TKO-specific CTCF HiChIP loop (orange) is included for reference. Grey loops represent significant interactions shared between WT and TKO EpiLCs. The TKO-specific CTCF binding site was used as a viewpoint. Note that genomic contacts generally increase on the left side of the plot in the TET1-edited condition, when CTCF binding at the viewpoint is enriched. P-values were calculated by two-tailed paired t-test assuming unequal variance: *P< 0.05, **P< 0.01, **P< 0.001, ****P< 0.0001.
Figure 5.
Figure 5.
CTCF insulates promoter-enhancer interactions at the Zdbf2 locus. (A) UCSC genome browser screenshot of the Zdbf2 locus. CpG methylation levels in WT ESCs and EpiLCs are shown, followed by H3K27me3 (45) and H3K27ac (HiChIP) profiles in WT and TKO ESC and EpiLCs. Refseq genes, CpG islands, CTCF binding motifs and the TAD boundary are shown. Previously defined enhancers (E1-4) are shown in blue, the Zdbf2 CGI promoter in green, and the CTCF binding site deletion is highlighted in red. Statistically enriched CTCF loops in TKO EpiLCs (as shown in Figure 3) are included (orange). Gray loops represent significant interactions that are consistent across WT and TKO EpiLCs. Zdbf2: chr1:63165972–63304123. (B) Schema showing the hypothesized insulating effect of CTCF binding on Zdbf2 promoter-enhancer looping. In hypomethylated cells where CTCF is bound and enhancer sequences are insulated, the promoter sequence is marked by PRC2-associated H3K27me3 and repressed (top). When the CTCF binding site is DNA methylated or deleted, the enhancers have increased access to the Zdbf2 promoter, leading to increased expression (bottom). (C) Bar chart showing the relative expression levels of Zdbf2 by RT-qPCR in WT and ΔCTCF_Binding Site (ΔCTCF_BS) ESCs treated with UNC1999 (PRC2 inhibitor) or UNC2400 (mock). Data are shown as mean ± standard error for three replicates. P-values were calculated by two-tailed paired t-test: *P< 0.05.

References

    1. Greenberg M.V.C., Bourc’his D.. The diverse roles of DNA methylation in mammalian development and disease. Nat. Rev. Mol. Cell Biol. 2019; 20:590–607. - PubMed
    1. Nichols J., Silva J., Roode M., Smith A.. Suppression of Erk signalling promotes ground state pluripotency in the mouse embryo. Development. 2009; 136:3215–3222. - PMC - PubMed
    1. Argelaguet R., Clark S.J., Mohammed H., Stapel L.C., Krueger C., Kapourani C.-A., Imaz-Rosshandler I., Lohoff T., Xiang Y., Hanna C.W.et al. .. Multi-omics profiling of mouse gastrulation at single-cell resolution. Nature. 2019; 576:487–491. - PMC - PubMed
    1. Lieberman-Aiden E., van Berkum N.L., Williams L., Imakaev M., Ragoczy T., Telling A., Amit I., Lajoie B.R., Sabo P.J., Dorschner M.O.et al. .. Comprehensive mapping of long-range interactions reveals folding principles of the human genome. Science. 2009; 326:289–293. - PMC - PubMed
    1. Cremer T., Cremer M.. Chromosome territories. Cold Spring Harb. Perspect. Biol. 2010; 2:a003889. - PMC - PubMed