. 2024 Nov 5;33(21):1873-1886.
doi: 10.1093/hmg/ddae125.

Expression levels of core spliceosomal proteins modulate the MBNL-mediated spliceopathy in DM1

Affiliations

Expression levels of core spliceosomal proteins modulate the MBNL-mediated spliceopathy in DM1

Jiss M Louis et al. Hum Mol Genet. .

Abstract

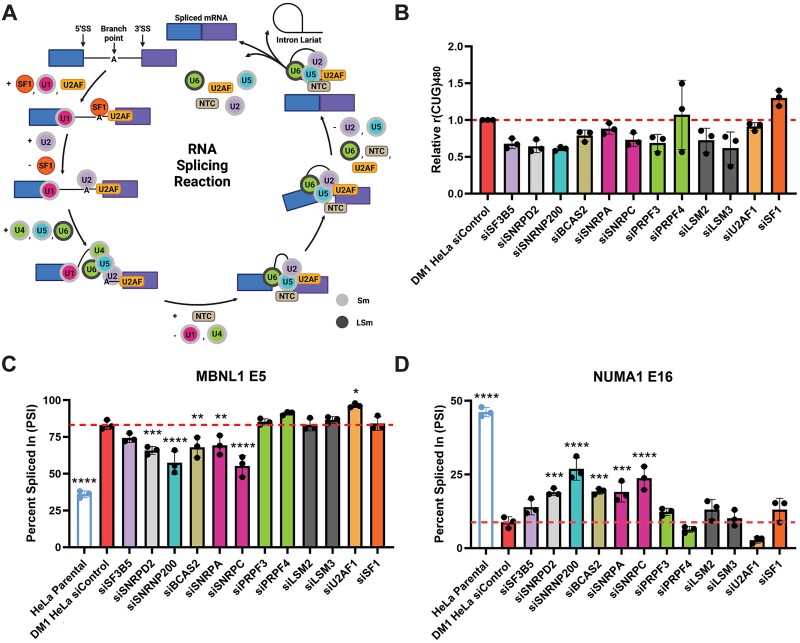
Myotonic dystrophy type 1 (DM1) is a heterogeneous multisystemic disease caused by a CTG repeat expansion in DMPK. Transcription of the expanded allele produces toxic CUG repeat RNA that sequesters the MBNL family of alternative splicing (AS) regulators into ribonuclear foci, leading to pathogenic mis-splicing. To identify genetic modifiers of toxic CUG RNA levels and the spliceopathy, we performed a genome-scale siRNA screen using an established HeLa DM1 repeat-selective screening platform. We unexpectedly identified core spliceosomal proteins as a new class of modifiers that rescue the spliceopathy in DM1. Modest knockdown of one of our top hits, SNRPD2, in DM1 fibroblasts and myoblasts, significantly reduces DMPK expression and partially rescues MBNL-regulated AS dysfunction. While the focus on the DM1 spliceopathy has centered around the MBNL proteins, our work reveals an unappreciated role for MBNL:spliceosomal protein stoichiometry in modulating the spliceopathy, revealing new biological and therapeutic avenues for DM1.

Keywords: alternative splicing; genetic modifiers; genome screen; myotonic dystrophy; repeat expansion diseases.


Figures

Figure 1
Figure 1
A genome-scale esiRNA knockdown screen identifies core spliceosomal proteins that selectively reduce r(CUG)480 levels. (A) Schematic of the screening workflow. (B) Non-targeting esiLuciferase negative control and si(CUG)7 positive control treatments across the screen (mean ± SEM, n = 45). Student’s t-test, ****P < 0.0001. (C) Top 5 enriched gene ontology (GO) terms by significance (P-value) from all primary hits that reduce relative r(CUG)480 levels < 0.5 or elevate/stabilize r(CUG)480 levels > 1.55 using DAVID functional annotation [22,23]. (D) Cytoscape [24] interaction network analysis of all 34 hits from C with core spliceosome components highlighted with dark circles. (E) Relative r(CUG)480 levels following siRNA knockdown of the top 17 hits in independent HeLa DM1 clones #1 and 19 (circle and triangle, respectively) [20]. Measurements relative to non-targeting siRNA control.
Figure 2
Figure 2
Expression of spliceosomal hits correlates with DMPK levels, ankle dorsiflexion strength and are elevated in DM1 patients. (A) Read counts in transcripts per million (TPM) for spliceosomal hits compared to DMPK levels in DM1 patients (n = 44). r = Pearson correlation (B) correlations of normalized ankle dorsiflexion strength scores (100 = strongest, 0 = weakest) with expression levels of spliceosomal hits. (C) Expression levels of spliceosomal hits in DM1 patients compared to unaffected controls (n = 11). Welch’s t-test, ns = not significant, ***P < 0.001, ****P < 0.0001. Raw RNAseq data for tibialis anterior tissue and normalized ankle dorsiflexion scores were obtained from DMseq.org [27] and read counts in TPM were obtained from the raw data using kallisto (version 0.44.0) [28].
Figure 3
Figure 3
Select core components of the spliceosome modulate r(CUG)480 levels and MBNL-mediated alternative splicing in HeLa DM1 cells. (A) Schematic depicting a simplified pre-mRNA splicing cycle with the associated complexes. U1 small nuclear ribonucleoprotein (snRNP) interacts with the 5′ splice site; SF1 binds to the intron branch point sequence; U2AF heterodimer binds the 3′splice site; U2 snRNP is recruited and SF1 exits; the U4/U6/U5 tri-snRNP is recruited; U1 and U4 exit and the spliceosome undergoes step-wise conformational changes involving the nineteen complex (NTC) leading to the catalytic complex that facilitates 2 sequential transesterification reactions. Sm proteins associate with U1, U2, U4 and U5 snRNPs while LSm proteins associate with U6 snRNP. First the branchpoint adenosine initiates a nucleophilic attack on the 5′ splice site (5′SS) leading to a second reaction between the 3′-OH of the 5′SS and the 3′SS that results in intron lariat removal, exon ligation and the eventual disassembly of the post splicing complex. (B) Relative r(CUG)480 levels following siRNA knockdown and (C and D) RT-PCR isoform analysis of the indicated alternative cassette exon events in HeLa DM1 cells of representative core spliceosomal proteins, based on subcomplex from A. Mean ± SD, n = 3 biological replicates, one-way ANOVA with Dunnett’s multiple comparisons to DM1 HeLa siControl, *P < 0.05, **P < 0.01, ***P < 0.001, ****P < 0.0001.
Figure 4
Figure 4
Knockdown of SNRPD2 reduces DMPK expression and promotes MBNL-mediated AS in primary fibroblasts. (A) RT-qPCR of SNRPD2 expression relative to GAPDH control. Mean ± SD, n = 6 biological replicates. (B) Representative immunoblot and (C) quantification of SNRPD2 protein relative to GAPDH loading control. Mean ± SD, n = 3 biological replicates. (D) RT-qPCR of DMPK expression relative to GAPDH control. Mean ± SD, n = 6 biological replicates, unpaired two-tailed t-test, *P < 0.05, **P < 0.01, ***P < 0.001, ****P < 0.0001. (E) RT-PCR isoform analysis of INSR exon 11 inclusion following siSNRPD2 treatment in unaffected control and DM1 patient fibroblasts. Mean ± SD, n = 6 biological replicates. (F) Single or compound siMBNL1 and siSNRPD2 treatments compared to siControl in unaffected control fibroblasts. Mean ± SD, n = 3 biological replicates. One-way ANOVA with Tukey’s multiple comparisons test, ns—not significant, **P < 0.01, ****P < 0.0001.
Figure 5
Figure 5
SNRPD2 knockdown has broadly comparable transcriptomic effects in control and DM1 fibroblasts but can differentially affect MBNL-mediated AS. (A) MA plot displaying gene-expression differences comparing siSNRPD2 treatment to siControl treatment. Gene-expression change (log2 fold) is plotted against the mean of normalized counts. Significant changes with adjusted P < 0.05 and a log2 fold change of > 0.5 are highlighted. (B) Venn diagram depicting the proportion of unique and shared gene expression changes resulting from SNRPD2 knockdown. (C) MBNL1 expression is upregulated due to SNRPD2 knockdown from the RNAseq analysis and is confirmed using RT-qPCR to evaluate MBNL1 relative to GAPDH. (D) The number of significantly altered AS events resulting from SNRPD2 knockdown categorized as mutually exclusive exons (MXE), alternative 5′ and 3′ splice site (A5′SS and A3′SS), retained intron (RI) and skipped exon (SE). Events were filtered by a ΔPSI cut-off > 10%, FDR < 0.1 and a minimum of 25 junction-spanning reads. (E) Box plot with outliers of mean ΔPSI for each AS category following SNRPD2 knockdown shows broadly similar AS changes in unaffected and DM1 fibroblasts. (F) Isoform analysis of the indicated panel of candidate MBNL-regulated SE events reveals that DM1 fibroblasts may be more sensitive to SNRPD2 modulation for MBNL-regulated AS. Mean ± SD, n = 3 biological replicates, unpaired two-tailed t-test, ns—not significant, **P < 0.01, ***P < 0.001.
Figure 6
Figure 6
Knockdown of SNRPD2 reduces DMPK expression and ribonuclear foci and rescues MBNL-mediated mis-splicing in primary DM1 patient myoblasts. (A) Representative immunoblot and (B) quantification of SNRPD2 protein relative to GAPDH loading control in unaffected control and DM1 patient myoblasts. (C) RT-qPCR of DMPK expression relative to GAPDH control. (D) Fluorescence in situ hybridization for CUG ribonuclear foci using a (CAG)8-Cy3 probe with DAPI for nuclei, scale bar—10 μm. (E) Quantification of the percentage of foci-positive (+ve) nuclei and the percentage of nuclei containing more than 2 foci. Mean ± SD, n = 3 biological replicates, unpaired two-tailed t-test, ns—not significant, *P < 0.05, **P < 0.01, ****P < 0.0001. (F) RT-PCR isoform analysis of the indicated cassette exon. Mean ± SD, n = 3 biological replicates, one-way ANOVA with Tukey’s multiple comparisons test, ns—not significant, *P < 0.05, ***P < 0.001, ****P < 0.0001.
Figure 7
Figure 7
Model for MBNL:Spliceosome dynamics in DM1. The MBNL alternative splicing factors have a developmentally regulated program for “healthy” splicing that is mediated through interactions with the spliceosome (left). In DM1, this equilibrium is disrupted due to MBNL protein sequestration into ribonuclear foci by expanded CUG RNA and upregulation of core spliceosomal genes, causing an imbalance to the system (middle). As spliceosomal proteins have AS regulatory potential conferred by their expression levels, equilibrium can be partially restored in DM1 through modulating spliceosome components (right).

References

    1. Thornton CA. Myotonic dystrophy. Neurol Clin 2014;32:705–719. - PMC - PubMed
    1. Brook JD, McCurrach ME, Harley HG. et al. Molecular basis of myotonic dystrophy: expansion of a trinucleotide (CTG) repeat at the 3′ end of a transcript encoding a protein kinase family member. Cell 1992;68:799–808. - PubMed
    1. Harley HG, Brook JD, Rundle SA. et al. Expansion of an unstable DNA region and phenotypic variation in myotonic dystrophy. Nature 1992;355:545–546. - PubMed
    1. Mahadevan M, Tsilfidis C, Sabourin L. et al. Myotonic dystrophy mutation: an unstable CTG repeat in the 3′ untranslated region of the gene. Science 1992;255:1253–1255. - PubMed
    1. Sznajder LJ, Swanson MS. Short tandem repeat expansions and RNA-mediated pathogenesis in myotonic dystrophy. Int J Mol Sci 2019;20:3365. - PMC - PubMed

Publication types

MeSH terms