. 2024 Oct 15;436(20):168751.
doi: 10.1016/j.jmb.2024.168751. Epub 2024 Aug 22.

Single Acetylation-mimetic Mutation in TDP-43 Nuclear Localization Signal Disrupts Importin α1/β Signaling

Affiliations

Single Acetylation-mimetic Mutation in TDP-43 Nuclear Localization Signal Disrupts Importin α1/β Signaling

Ying-Hui Ko et al. J Mol Biol. .

Abstract

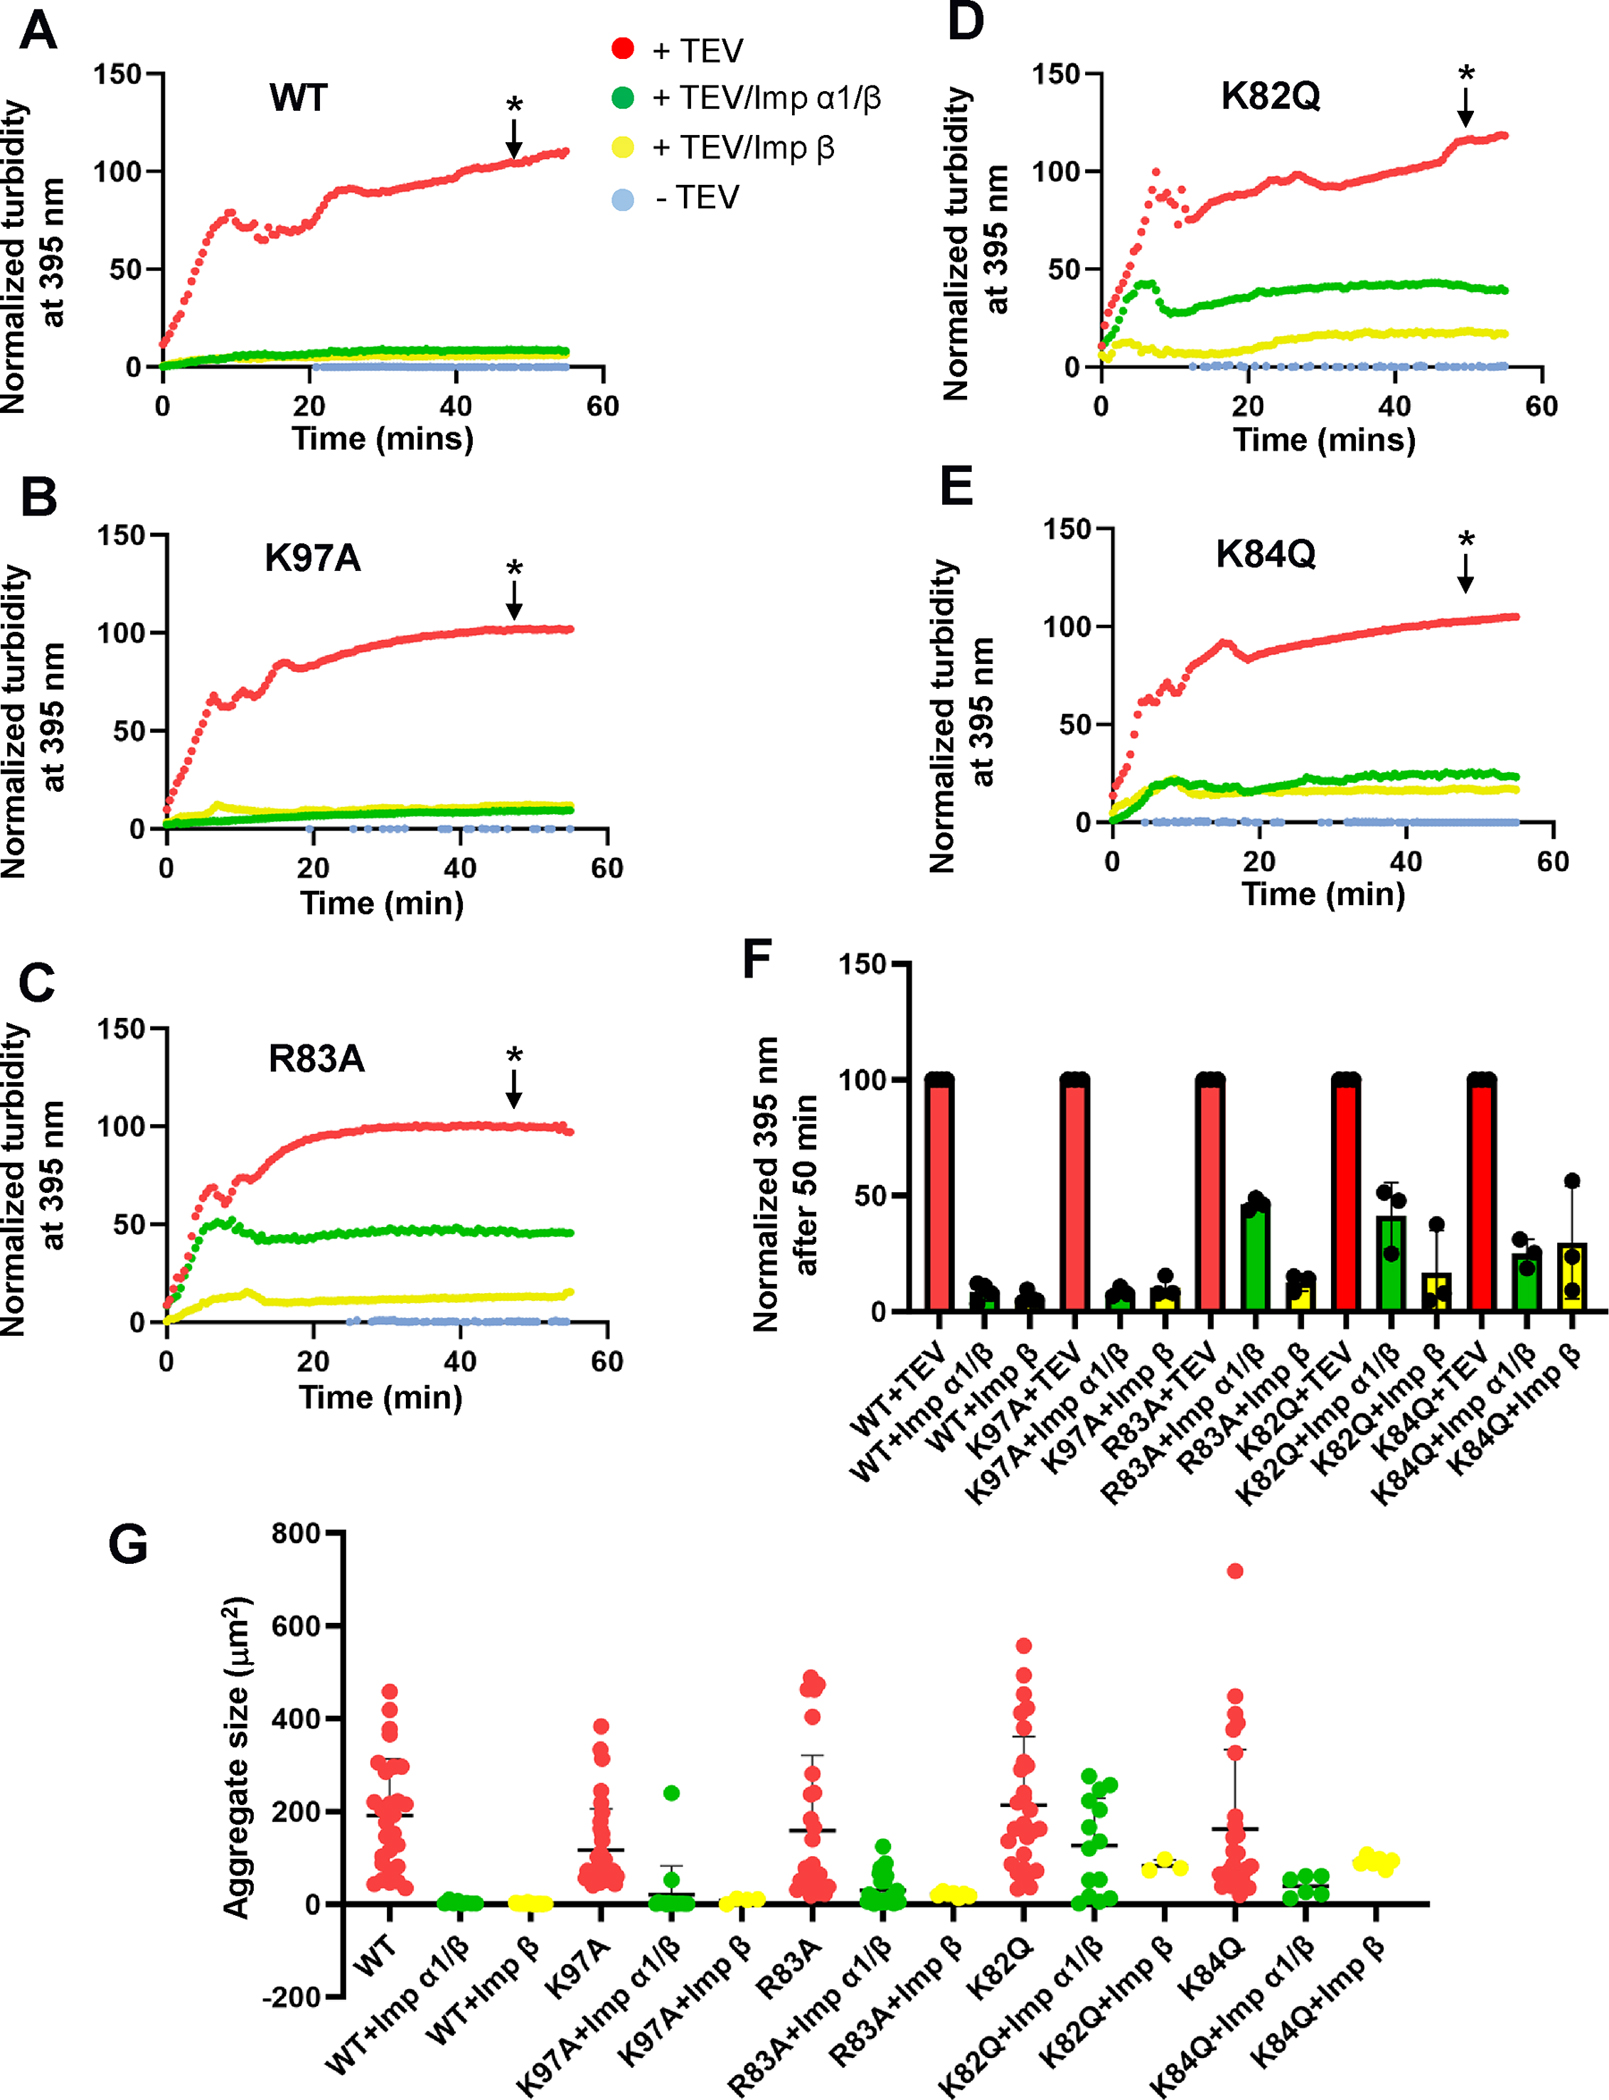
Cytoplasmic aggregation of the TAR-DNA binding protein of 43 kDa (TDP-43) is the hallmark of sporadic amyotrophic lateral sclerosis (ALS). Most ALS patients with TDP-43 aggregates in neurons and glia do not have mutations in the TDP-43 gene but contain aberrantly post-translationally modified TDP-43. Here, we found that a single acetylation-mimetic mutation (K82Q) near the TDP-43 minor Nuclear Localization Signal (NLS) box, which mimics a post-translational modification identified in an ALS patient, can lead to TDP-43 mislocalization to the cytoplasm and irreversible aggregation. We demonstrate that the acetylation mimetic disrupts binding to importins, halting nuclear import and preventing importin α1/β anti-aggregation activity. We propose that perturbations near the NLS are an additional mechanism by which a cellular insult other than a genetically inherited mutation leads to TDP-43 aggregation and loss of function. Our findings are relevant to deciphering the molecular etiology of sporadic ALS.

Keywords: ALS; TDP-43; importin α1; importin β; nuclear localization signal.


Conflict of interest statement

Declaration of competing interest The authors declare that they have no known competing financial interests or personal relationships that could have appeared to influence the work reported in this paper.

Figures

Figure 1.
Figure 1.. Schematics of all TDP-43 constructs used in this study (panels A-E).
The magnified box in panel (A) shows the sequence of TDP-43 bipartite NLS. Residues contacting importin α1 are shown in black; R83 and K97 occupying the P2’ and P2 sites, respectively, are colored red and highlighted in yellow. Residues in the NLS that do not contact importin α1 directly are in gray. The positions of acetylated residues studied in this paper are shown as red diamonds. A ribbon diagram of the TDP-43 NLS solved in complex with importin α (PDB id: 7N9H) is shown above the NLS amino acid sequence.
Figure 2.
Figure 2.. Subcellular localization of TDP-43 overexpressed in SH-SY5Y cells.
(A) Representative micrographs of SH-SY5Y cells overexpressing indicated TDP-43 variants tagged with mCherry (red) and counterstained with DAPI (blue) and the membrane stain CellBrite (green). WT TDP-43 is in the nucleus, but K82Q, R83A, AND R83K variants are strongly localized in the cytoplasm. (B) Quantification of TDP-43 subcellular distribution from three biological replicate cell experiments (n=3) quantifying ~1000 cells per construct. Dots represent individual cells with a median indicated by the bars. Standard Deviations are WT = 14; K82Q = 14.16; R83A = 13.67; R83K = 14.60; K84Q = 15.18; T88E = 14.86; A90V = 16.84; S91A = 16.44; S92A = 13.57; K97A = 11.55; A315E = 11.44. Statistical analysis was performed with a one-way ANOVA using Dunnett’s multiple caparisons test. Significant (p<0.01) deviation from the WT TDP-43.
Figure 3.
Figure 3.. In cellulo pull-down assay.
(A) Representative SDS-PAGE gel of the pull-down experiment in which WT TDP-43 NTD-NLS-RRM1 and mutants in TDP-43 NLS region were co-expressed with the importin α1/β heterodimer. (B) Quantification of GST-TDP-43-NTD-NLS-RRM1 bands from replicate SDS-PAGE gels (n=7). Band intensity was measured through ImageJ [72]. Histogram columns indicate the ratio of TDP-43 band intensity to the normalized importin α1 intensity, with standard deviation (error bars). Significant (p<0.01) deviation from the WT TDP-43: importin α1 ratio was determined through a two-tailed Student’s t-test assuming unequal variance. ***p < 0.001; n.s., not significant.
Figure 4.
Figure 4.. TDP-43 aggregation monitored by turbidity assay.
(A-E) The turbidity assay was carried out for each TDP-43 variant using 10 μM of the TDP-43-TEV-MBP fusion protein (TDP-43-M). For each TDP-43 variant, we recorded four aggregation kinetics: TDP-43-M incubated without TEV (blue dot); TDP-43-M incubated with TEV (red dots); TDP-43-M incubated with TEV and importin α1/β (green dots); TDP-43-M incubated with TEV + importin β (yellow dots). Free MBP (blue dot) is included as a control. Each TDP-43 variant was independently repeated three times. (F) Quantification of TDP-43 variants turbidity at 395 nm after 50 minutes from panels (A-E). (G) After 50 minutes (shown by an asterisk in Fig. 4A–E), each TDP-43 variant was imaged under a 100x magnification microscope (Leica DMi8) (shown in Fig. S5). The panel shows a quantification of particle size for all TDP-43 variants. Each dot represents the length of the aggregated particles at 100x magnification. Mean and standard deviation are shown as black lines in each group.
Figure 5.
Figure 5.. FRET Assay.
(A) A schematic diagram of the FRET assay that was used to evaluate how mutations in the TDP-43 NLS (indicated as red asterisks) affect importin α/β1 binding and disruption of NTD dimerization. (B) Fluorescence titration assay. An increasing quantity of purified importin α1/β complex between 0–100 μM (equal to a 0–10 molar excess) was titrated against 5 μM of CFP-TDP-43-NTD-NLS and 5 μM of YFP-TDP-43-NTD-NLS. The concentrations of importin α1/β shown are 0 μM (grey),10 μM (1x, orange), 20 μM (2x, light blue), 50 μM (5x, yellow), 80 μM (8x, dark blue), 100 μM (10x, green). The fluorescence signal was recorded between 455–600 nm. (C) Quantification of normalized FRET signal at 531 nm from panel (B). (D) Quantification of the normalized FRET signal at 531 nm (Y-axis) versus the importin α1/β (X-axis) concentration. Different lines represent different mutations/acetylation-mimetics in the TDP-43 NLS. Each experimental group was independently repeated three times. The standard deviation is the black bar on each data point (color circle).
Figure 6.
Figure 6.. Solution structure of the importin α1/β:TDP-43 import complex.
(A) SDS-Page analysis of the importin α1/β complex and the importin α1/β/TDP-43 trimeric complex used for structural studies. (B) Experimental scattering profile of the importin α1/β/TDP-43 complex (black trace) overlaid with Rg distribution across the scattering peak (red circles). (C) Guinier region of the intensity I(q) to the scattering vector (q2). The qmax(Rg) cut-off was 1.3. (D) P(r) function with Dmax of 217.2 Å. (E) A dimensionless Kratky plot of the scattering data. (F) Model of the importin α1/β/TDP-43 complex fit within the electron density (light blue) generated by DENSS. The importin α1 is shown in red, the TDP-43 NLS in green, TDP-43-NTD in blue, and TDP-43-RRM1 in purple. (G) The comparison of the scattering profile predicted for the model to the empirical scattering of the complex produced a χ2 value of 1.31.
Figure 7.
Figure 7.. Model for how insults in TDP-43 lead to aggregation.
(A) Phosphorylation of TDP-43 CTD at S379, S403/S404, and S409/S410 enhance aggregation. (B) Acetylation in RRMs impairs RNA binding, leading to the accumulation of insoluble TDP-43. (C) Acetylation in the NTD-NLS at K82 (and possibly ubiquitination of K79) disrupts importin α1/β signaling. (D) C9orf72 DPRs impair importins function. (E) TDP-43 fragments TDP-25 and TDP-35 lacking the NLS further contribute to aggregation by making CTD-mediated contacts with WT and PTMs-modified TDP-43. Altogether, these insults cause TDP-43 aggregation and formation of β-amyloid-like aggregates.

References

    1. Andersen PM, Al-Chalabi A. Clinical genetics of amyotrophic lateral sclerosis: what do we really know? Nat Rev Neurol. 2011;7:603–15. - PubMed
    1. François-Moutal L, Perez-Miller S, Scott DD, Miranda VG, Mollasalehi N, Khanna M. Structural Insights Into TDP-43 and Effects of Post-translational Modifications. Front Mol Neurosci 2019;12:301. - PMC - PubMed
    1. Doll SG, Cingolani G. Importin alpha/beta and the tug of war to keep TDP-43 in solution: quo vadis? Bioessays. 2022;44:e2200181. - PMC - PubMed
    1. Neumann M, Sampathu DM, Kwong LK, Truax AC, Micsenyi MC, Chou TT, et al. Ubiquitinated TDP-43 in frontotemporal lobar degeneration and amyotrophic lateral sclerosis. Science. 2006;314:130–3. - PubMed
    1. Masrori P, Van Damme P. Amyotrophic lateral sclerosis: a clinical review. Eur J Neurol. 2020;27:1918–29. - PMC - PubMed

MeSH terms

LinkOut - more resources