. 2025 Feb;82(2):174-188.
doi: 10.1016/j.jhep.2024.08.009. Epub 2024 Aug 22.

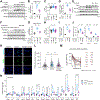
ACMSD inhibition corrects fibrosis, inflammation, and DNA damage in MASLD/MASH

Affiliations

ACMSD inhibition corrects fibrosis, inflammation, and DNA damage in MASLD/MASH

Yasmine J Liu et al. J Hepatol. 2025 Feb.

Abstract

Background & aims: Recent findings reveal the importance of tryptophan-initiated de novo nicotinamide adenine dinucleotide (NAD+) synthesis in the liver, a process previously considered secondary to biosynthesis from nicotinamide. The enzyme α-amino-β-carboxymuconate-ε-semialdehyde decarboxylase (ACMSD), primarily expressed in the liver and kidney, acts as a modulator of de novo NAD+ synthesis. Boosting NAD+ levels has previously demonstrated remarkable metabolic benefits in mouse models. In this study, we aimed to investigate the therapeutic implications of ACMSD inhibition in the treatment of metabolic dysfunction-associated steatotic liver disease/steatohepatitis (MASLD/MASH).

Methods: In vitro experiments were conducted in primary rodent hepatocytes, Huh7 human liver carcinoma cells and induced pluripotent stem cell-derived human liver organoids (HLOs). C57BL/6J male mice were fed a western-style diet and housed at thermoneutrality to recapitulate key aspects of MASLD/MASH. Pharmacological ACMSD inhibition was given therapeutically, following disease onset. HLO models of steatohepatitis were used to assess the DNA damage responses to ACMSD inhibition in human contexts.

Results: Inhibiting ACMSD with a novel specific pharmacological inhibitor promotes de novo NAD+ synthesis and reduces DNA damage ex vivo, in vivo, and in HLO models. In mouse models of MASLD/MASH, de novo NAD+ biosynthesis is suppressed, and transcriptomic DNA damage signatures correlate with disease severity; in humans, Mendelian randomization-based genetic analysis suggests a notable impact of genomic stress on liver disease susceptibility. Therapeutic inhibition of ACMSD in mice increases liver NAD+ and reverses MASLD/MASH, mitigating fibrosis, inflammation, and DNA damage, as observed in HLO models of steatohepatitis.

Conclusions: Our findings highlight the benefits of ACMSD inhibition in enhancing hepatic NAD+ levels and enabling genomic protection, underscoring its therapeutic potential in MASLD/MASH.

Impact and implications: Enhancing NAD+ levels has been shown to induce remarkable health benefits in mouse models of metabolic dysfunction-associated steatotic liver disease/steatohepatitis (MASLD/MASH), yet liver-specific NAD+ boosting strategies remain underexplored. Here, we present a novel pharmacological approach to enhance de novo synthesis of NAD+ in the liver by inhibiting α-amino-β-carboxymuconate-ε-semialdehyde decarboxylase (ACMSD), an enzyme highly expressed in the liver. Inhibiting ACMSD increases NAD+ levels, enhances mitochondrial respiration, and maintains genomic stability in hepatocytes ex vivo and in vivo. These molecular benefits prevent disease progression in both mouse and human liver organoid models of steatohepatitis. Our preclinical study identifies ACMSD as a promising target for MASLD/MASH management and lays the groundwork for developing ACMSD inhibitors as a clinical treatment.

Keywords: ACMSD; DNA repair; MASLD/MASH; Mendelian randomization; NAD(+); human liver organoids.


Conflict of interest statement

Conflict of interests

Y.L. and J.A. are inventors on a patent application covering this work filed by the EPFL. A.V., R.P.M and G.M.S are employed by OrsoBio and J.A. and T.T. are advisors to OrsoBio.

Figures

Fig. 1.
Fig. 1.. ACMSD inhibition enhances the NAD+ metabolome and mitochondrial respiration.
(A) Dose-response increase of NAD+ in mPHs after 24 h TLC-065 exposure (n = 4). (B) Targeted metabolomics in mPHs exposed to 0.5 μM TLC-065 for 24 h (n = 5). (C) Dose-response curve of FAO in HuH-7 cells after 16 h TLC-065 exposure (n = 3). (D) Dose-response curve of DNL in primary rat hepatocytes after 4 h TLC-065 exposure (n = 3). (E-F) Time course and boxplot of mitochondrial respiration in mPHs (n = 7 control; n = 10 other groups, 0.1 μM TLC-065 for 24 h). (G) ATP levels in mPHs (n = 5, 0.5 μM TLC-065 for 24 h). (H) Pearson correlation of liver transcripts of FAO genes and Acmsd in BXD mice fed either chow or HFD. (I-L) NAD+ fold changes (n = 6) (I), mitochondrial respiration (n = 9 WT; 10 Acmsd KO) (J-K), and ATP fold changes (n = 6) (L) in Acmsd WT or KO mPHs. (M-P) NAD+ fold changes (n = 10 WT; 8 KO) (M), mitochondrial respiration (n = 10) (N–O), and mtDNA:nDNA (n = 4) (P) in Acmsd WT or KO mPHs exposed to 0.1 μM TLC-065 for 24 h. Error bar: mean ± SEM. *p <0.05; **p <0.01; ***p <0.001, two-sided Student’s t test (A, C-D, G, I, L). Two-way ANOVA and Bonferroni multiple comparisons test (F, K, M, O–P). DNL, de novo lipogenesis; FAO, fatty acid beta-oxidation; F, FCCP (carbonyl cyanide-p-trifluoromethoxyphenylhydrazone); HFD, high-fat diet; KO, knockout; mPHs, mouse primary hepatocytes; mtDNA:nDNA, mitochondrial/nuclear DNA; O, oligomycin; R/A, rotenone/antimycin; WT, wild-type. 3-HK, 3-OH kynurenine; TRP, tryptophan; KYN, kynurenine; NAD+, nicotinamide adenine dinucleotide; NADH, nicotinamide adenine dinucleotide hydrogen; NAAD, nicotinic acid adenine dinucleotide; NMN, nicotinamide mononucleotide; NAMN, nicotinic acid mononucleotide; NAM, nicotinamide; NADP(H), nicotinamide adenine dinucleotide phosphate (hydrogen).
Fig. 2.
Fig. 2.. ACMSD inhibition downregulates the DNA damage and interferon response in hepatocytes.
(A) Fold changes of NAD+ in mPHs exposed to 0.5 μM TLC-065 (n = 6). (B) PCA of normalized expression of mPHs exposed to 0.5 μM TLC-065 (n = 4). (C) Top10 up- or downregulated gene sets overlapping at three timepoints. (D-E) Venn diagram displaying the number of overlapping upregulated (D) and downregulated genes (E). (F) Top 10 up- or downregulated gene sets between 12 h and 24 h. Dot size indicates significance (−log10[adjusted p value]). (G) GSEA showing the effects of TLC-065 on cytoprotective and antioxidative gene sets. (H) Log2-transformed fold changes of core genes in different DNA repair pathways. *p <0.05; **p <0.01; ***p <0.001. two-sided Student’s t test (A). FDR-corrected p values (q values) (G). BER, base excision repair; FA, fanconi anaemia; HDR, homology-dependent recombination; MMR, mismatch repair; NHEJ, non-homologous end-joining; NER, nucleotide excision repair; PARP, poly (ADP-ribose) polymerase. Resp., response; Expr., expression; Metab., metabolism; Regul., regulation.
Fig. 3.
Fig. 3.. ACMSD inhibition confers genome protection in hepatocytes.
(A-B) Western blot (A) and band densitometry (B) of p-H2A.X at Ser139 in mPHs (n = 4). (C) Fold changes of ROS in Acmsd WT or KO mPHs (n = 24). (D) Fold changes of caspase-3/7 activity in mPHs (n = 7). (E) Western blot of cleaved caspase-3 and procaspase-3 (full-length) in mPHs. For A-B, D-E, 1 μM doxorubicin ± 5 μM TLC-065 for 24h. (F–H) Western blot (F), band densitometry (G) of p-H2A.X at Ser139 (n = 4) and fold changes of ROS (n = 28) (H) in Acmsd WT or KO mPHs exposed to 0.75 mM palmitate. (I-J) Fold changes of caspase-3/7 activity (n = 5) (I) and mRNA of ER stress markers (n = 6) (J) in mPHs exposed to 0.75 mM palmitate ± 10 μM TLC-065 (n = 6). (K-L) TUNEL staining and foci quantification in nuclei of mPHs treated with 1 μM doxorubicin ± 2.5 μM TLC-065 for 24h (n = 290, control; n = 368, doxo; n = 329, doxo/TLC-065). Scale bar, 20 μm. (M) Log2 transformed FC of HepIRDS expression in mPHs after 0.5 μM TLC-065 treatment (n = 4). (N) HepIRDS expression in Acmsd KO or WT mPHs exposed to 0.5 μM doxorubicin (n = 5-6). *p <0.05; **p <0.01; ***p <0.001; One-way ANOVA and Tukey’s multiple comparison test (B-D; G-J; L, N). Exp., exposure; Doxo., doxorubicin; WT, wild-type; KO, knockout; HepIRDS, hepatocyte interferon-related DNA damage resistance signature.
Fig. 4.
Fig. 4.. Liver DNA damage expression correlates with MASLD/MASH severity.
(A) Log2-transformed FC of DNA repair, PARPs, and HepIRDS signature in human MASLD/MASH datasets, comparing subjects with fibrosis ≥3 vs. ≤1. (B) Gene and phenotype correlations in the CC founder strains. The principal component 1 (PC1) of the DNA repair (DDR), PARPs, and HepIRDS were obtained from PCA of normalized liver expression data of the CC founder strains (see Fig. S3). Liver (%), percentage of body weight. (C) Log2-transformed FC of liver proteins in NAD+ synthesis-related pathways in CAST/EiJ and C57BL/6J mice fed a WD diet, compared to their CD diet-fed controls. *p <0.05; **p <0.01; ***p <0.001; Benjamini–Hochberg adjusted p values (A-C). FC, fold change; CC founder strains, collaborative cross founder strains. Chol., cholesterol; ALT, alanine aminotransferase; AST, aspartate aminotransferase.
Fig. 5.
Fig. 5.. TLC-065 reverses clinical phenotypes and molecular dysregulations in MASLD/MASH.
(A) Schematic of the experimental pipeline. (B) Blood glucose levels during oGTT in 22 weeks. (C) Fasting glycemia at 25 weeks (CD n = 10, WD n = 9, TLC-065 n = 7, B–C). (D) H&E of formalin-fixed liver sections and Oil red O (ORO) staining of liver cryosections (n = 6; magnification: 100 μm). (E-H) Sirius red (E), CD45 (F), and cytochrome c oxidase (COX) activity staining (G) of formalin-fixed liver sections (magnification: 100 μm). (H) Sirius red+ area, counts of CD45+ cells and optical density of COX activity staining (n = 6). (I) DEGs in WD/TN mice ± TLC-065 compared to the CD group (CD n = 6, WD n = 6, TLC-065 n = 4). (J) Comparison of the log2-transformed FC of genes under WD/TN (WD vs. CD) and TLC-065 (TLC-065 vs. WD). The dashed line shows the TLS regression line. Genes showing significant opposite changes (Benjamini–Hochberg adjusted p <0.05) in the comparison are color-coded by the log2 FC under TLC-065. (K) GSEA for gene sets affected by WD/TN (WD vs. CD) and reversed by TLC-065 (TLC-065 vs. WD). (L) Log2-transformed FC of fibrotic, inflammatory, and mitochondrial genes in human MASLD/MASH datasets (fibrosis ≥3 vs. fibrosis ≤1). (M) Log2-transformed FC of core genes that contribute to the enriched gene sets listed in (K). Genes presented in L are labelled in M. Error bar: mean ± SEM (B). *p <0.05; **p <0.01; ***p <0.001; One-way ANOVA and Tukey’s multiple comparisons test (C, H). FDR-corrected p values (q values) (K); Benjamini–Hochberg adjusted p values (I, L). oGTT, oral glucose tolerance test; CD, a chow (control) diet; WD, a western-style diet; ORO, Oil Red O; DEGs, differentially expressed genes; FC, fold change; TLS regression, total least squares regression; NES, normalized enrichment score; Prod., production; Metab., metabolism; Dev., development; Resp., response; Rm., removal; MITO/Mito, mitochondria; ETC, electron transport chain; OXPHOS, oxidative phosphorylation; FA, fatty acid; CATAB, catabolism.
Fig. 6.
Fig. 6.. TLC-065 counters liver cell shifts and liver DNA damage in WD/TN mice.
(A-B) Single-cell deconvolution indicating the estimated percentage of liver cell types shown in stacked bar graph (A) and boxplot (B). (C-D) Western blot of phosphorylated IκBα at Ser32/36 and total IκBα in liver lysates (CD n = 3, WD n = 5, TLC-065 n = 5) (C) and band densitometry of p-IκBα normalized to total IκBα (D). (E) Abundance of liver NAD+ metabolome normalized to protein (CD n = 10, WD n = 9, TLC-065 n = 7). (F) p-H2A.X (ser139) staining and quantification of formalin-fixed liver sections (magnification: 50 μm) (n = 6, CD; n = 8, WD; n = 6 TLC-065). Arrows indicate p-H2A.X+ nuclei. (G-H) Western blot of PARylation in liver lysates (G) and band densitometry of PAR normalized to HSP90 (H) (I-J) Immunoblotting of PAR and PARP1 on immunoprecipitated PARP1 (I) and band densitometry of auto-PARylated PARP1 normalized to total immunoprecipitated PARP1 (n = 3, CD; n = 3, WD; n = 3 TLC-065) (J). Stars in immunoblots indicate non-specific bands. In the image, the full-length PARP1 (116 KDa) and the cleaved PARP1 fragment (89 KDa) are labelled. *p <0.05; **p <0.01; ***p <0.001. One-way ANOVA and Tukey’s multiple comparisons test (B, D-F, H-J). NAD+, nicotinamide adenine dinucleotide; NMN, nicotinamide mononucleotide; NR, nicotinamide riboside; NA, nicotinic acid; NAMN, nicotinic acid mononucleotide; NAM, nicotinamide; MeNAM, methyl-NAM; PAR, poly-ADP ribose; Exp., exposure.
Fig. 7.
Fig. 7.. Effects of ACMSD inhibition are recapitulated in HLO steatohepatitis models.
(A) Schematic of the experimental pipeline. Created with Biorender.com. (B–C) PCA of normalized gene expression of GCKRTT (B) and GCKRCC (C) sHLOs ± 10 μM TLC-065 (n = 3). (D) DEGs induced by oleate or TLC-065 in GCKRTT or GCKRCC HLOs. (E) Comparison of the log2-transformed FC of genes under oleate (oleate vs. control) and TLC-065’s effects (TLC-065 vs. oleate) in GCKRTT or GCKRCC sHLOs. The dashed line shows the TLS regression line. Genes showing significant opposite changes (Benjamini–Hochberg adjusted p <0.05) in the comparison are color-coded by the log2 FC under oleate. (F) Manhattan plot showing GSEA for gene sets affected by oleate in GCKRTT sHLOs. Significant gene sets are colored as indicated for different processes. (G) GSEA of gene sets induced by oleate (oleate vs. control) and reversed by TLC-065 (TLC-065 vs. oleate) in GCKRTT sHLOs. (H–I) p-H2A.X (Ser139) immunostaining of GCKRTT HLOs exposed to 300 μM palmitate (PA) for 48 h (H) or to 5 μM doxorubicin for 24 h (I) ± 1 μM (low) or 10 μM (high) TLC-065. p-H2A.X (ser139) staining (red) and Hoechst33342 (blue). Low magnification: 50 μm for PA, PA + TLC and 70 μm for other groups. High magnification: 30 μm for control, PA, PA + TLC and 20 μm for other groups. (J) Schematic of Mendelian randomization analysis. (K) The effects of liver and whole blood DNA repair and HepIRDS gene expression on liver iron content, plasma ALT and liver fat percentage. *p <0.05; **p <0.01; ***p <0.001; Benjamini–Hochberg adjusted p values (D, K). FDR-corrected p values (F, G). iPSC, induced pluripotent stem cell; HLOs, human liver organoids; sHLOs, steatohepatitic HLOs; DEG, differentially expressed genes; Mito., mitochondria; Str., structure; Resp., response; IFN, interferon; Membr., membrane; ECM/EM, extracellular matrix; Syn., synthesis; Org., organization; Metab., metabolism; Transp., transport; Regul., regulation.

References

    1. Bayoumi A, Grønbæk H, George J, et al. The epigenetic drug Discovery landscape for metabolic-associated fatty liver disease. Trends Genet 2020;36:429–441. - PubMed
    1. Anstee QM, Day CP. The genetics of NAFLD. Nat Rev Gastroenterol Hepatol 2013;10:645–655. - PubMed
    1. Younossi Z, Anstee QM, Marietti M, et al. Global burden of NAFLD and NASH: trends, predictions, risk factors and prevention. Nat Rev Gastroentero 2018;15:11–20. - PubMed
    1. Younossi ZM, Koenig AB, Abdelatif D, et al. Global epidemiology of nonalcoholic fatty liver disease—meta-analytic assessment of prevalence, incidence, and outcomes. Hepatology 2016;64:73–84. - PubMed
    1. Sunny NE, Bril F, Cusi K. Mitochondrial adaptation in nonalcoholic fatty liver disease: novel mechanisms and treatment strategies. Trends Endocrinol Metab 2017;28:250–260. - PubMed