. 2024 Aug 25;15(1):7312.
doi: 10.1038/s41467-024-51708-9.

METI: deep profiling of tumor ecosystems by integrating cell morphology and spatial transcriptomics

Affiliations

METI: deep profiling of tumor ecosystems by integrating cell morphology and spatial transcriptomics

Jiahui Jiang et al. Nat Commun. .

Abstract

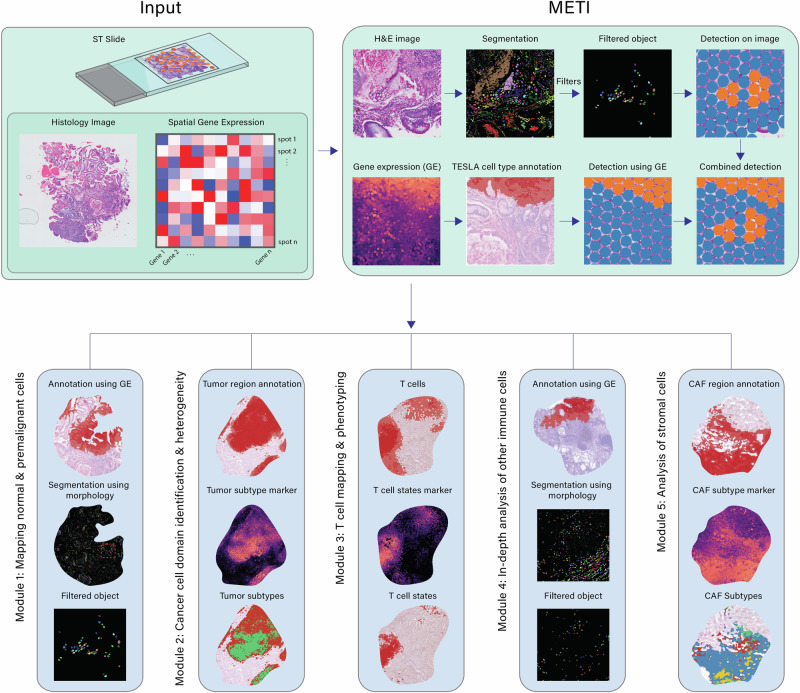
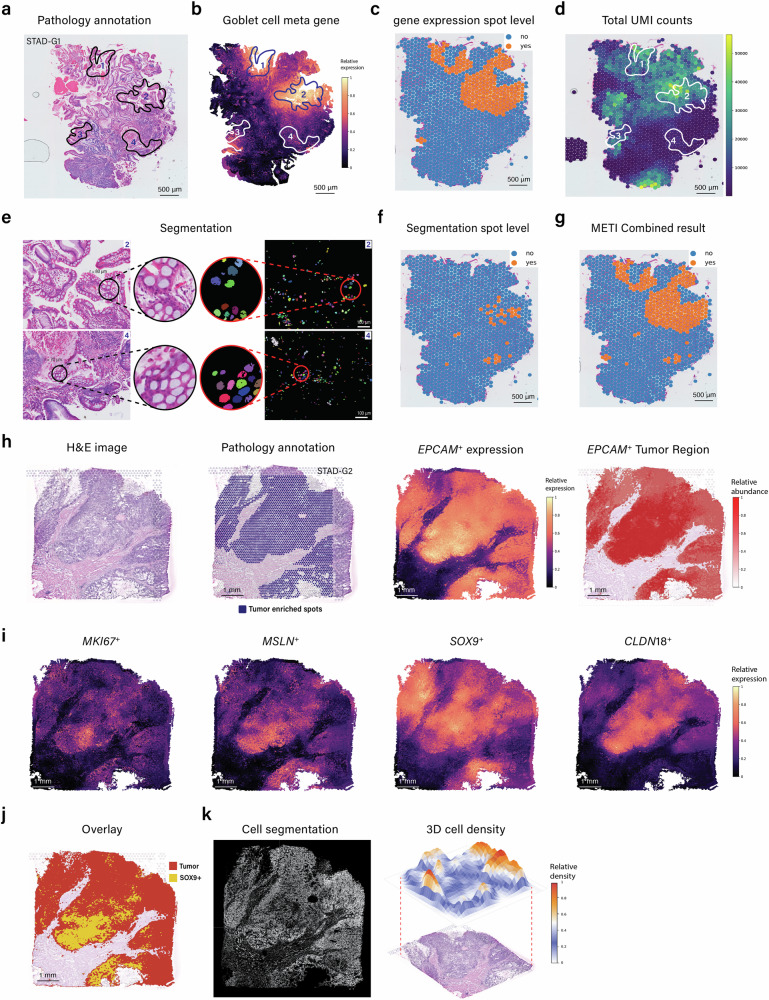
Recent advances in spatial transcriptomics (ST) techniques provide valuable insights into cellular interactions within the tumor microenvironment (TME). However, most analytical tools lack consideration of histological features and rely on matched single-cell RNA sequencing data, limiting their effectiveness in TME studies. To address this, we introduce the Morphology-Enhanced Spatial Transcriptome Analysis Integrator (METI), an end-to-end framework that maps cancer cells and TME components, stratifies cell types and states, and analyzes cell co-localization. By integrating spatial transcriptomics, cell morphology, and curated gene signatures, METI enhances our understanding of the molecular landscape and cellular interactions within the tissue. We evaluate the performance of METI on ST data generated from various tumor tissues, including gastric, lung, and bladder cancers, as well as premalignant tissues. We also conduct a quantitative comparison of METI with existing clustering and cell deconvolution tools, demonstrating METI's robust and consistent performance.


Conflict of interest statement

The authors declare no competing interests.

Figures

Fig. 1
Fig. 1. Workflow of METI.
METI takes 10x Visium Spatial Transcriptomics (ST) data, with a spot-by-gene matrix for gene expression data, Hematoxylin and Eosin (H&E) images, and XY coordinates that map the location of each spot onto the image as input. With METI algorithm, METI offers cell type identification, nuclei segmentation and the functionality of generating 3D cell density plots in five distinct modules. Module 1 is dedicated to mapping normal and premalignant cells through the integration of gene expression (GE) data and H&E images. Module 2 focuses on identifying cancer cell domains and characterizing their heterogeneity. Module 3 is dedicated to T cell mapping and phenotyping. Module 4 involves in-depth analysis of other immune cells. Lastly, Module 5 pertains to the analysis of Cancer-Associated Fibroblasts (CAFs).
Fig. 2
Fig. 2. Mapping premalignant cells and cancer cell domain.
a Pathology annotation depicting goblet cell enriched regions in STAD G1. b Goblet meta gene expression plot at pixel-level. c Spot annotation indicating regions of high goblet cell gene expression on the H&E image. d Total UMI counts for individual spots. e Identification of four distinct goblet-enriched regions on the left side, accompanied by zoomed-in views of goblet regions of the H&E image and segmentation outcomes for regions 2 and 4. f Spot annotation using segmentation results. g METI combined result by integrating gene expression and segmentation. h Pathology annotation highlighting tumor cell-enriched spots of STAD G2 (left), pixel depiction of EPCAM highly expressed regions (middle), and EPCAM+ region annotation on the H&E image (right). i Pixel-level gene expression plots for tumor subtypes, MKI67, MSLN, SOX9, and CLDN18. j Overlay of regions expressing tumor-related genes and SOX9-positive regions. k Nuclei segmentation (left) and 3D cell density plots (right).
Fig. 3
Fig. 3. T cell mapping and phenotyping.
a Pixel-level visualization of T cell marker gene expression in STAD G3 and LUAD L1 (left), accompanied by annotation indicating regions of T cell marker gene expression on the H&E image. b Pixel-level representation of CD8+ T cell marker gene expression (left), along with annotation of CD8+ T cell marker gene-expressing regions on the H&E image (right). c Pixel-level representation of CD4+ Treg marker gene expression. d Pixel-level depiction of CD8+ Tex marker gene expression. e Overlay displaying the intersection of tumor+ region and CD4+ Treg-positive region. f Overlay illustrating the overlap between tumor+ region and CD8+ Tex-positive region. g 3D cell density plots for STAD G3 and LUAD G1. h Overlay demonstrating the spatial relationship between CD4+ Treg and CD8+ Tex-positive regions.
Fig. 4
Fig. 4. In-depth analysis of other immune cells.
a H&E image of bladder cancer sample B1. b Pixel-level visualization of neutrophil marker gene expression in BLCA-B1. c H&E image of bladder cancer sample BLCA-B2. d Pixel-level visualization of neutrophil marker gene expression in BLCA-B2. e Annotation indicating regions of high neutrophil gene expression on the H&E image for BLCA-B1 and BLCA-B2; Zoom-in display of three neutrophil-enriched regions of BLCA-B1 and BLCA-B2, and four yellow-circled regions where neutrophils present visually. f Zoomed-in view of four yellow-circled region in (e) and corresponding segmentation results. g 3D cell density plots for BLCA-B1 and BLCA-B2. h Pixel-level visualization of B cell marker gene expression in STAD G4 (left), accompanied by annotation indicating regions of B cell marker gene expression on the H&E image (right). i Pixel-level visualization of plasma cell marker gene expression in STAD G4 (left), accompanied by annotation indicating regions of plasma cell marker gene expression on the H&E image (right). j 3D cell density plots for STAD G4. k Pixel-level visualization of macrophage marker gene expression in STAD G4 (left), accompanied by annotation indicating regions of plasma macrophage marker gene expression on the H&E image (right). l Zoomed-in view of macrophage regions of the H&E image and segmentation.
Fig. 5
Fig. 5. Analysis of cancer associated fibroblasts.
a Pathology annotation of fibroblast-enriched spots in STAD G2. b Fibroblasts segmentation result (left), accompanied by 3D fibroblast density plots (right). c Total UMI counts for individual spots. d Pixel-level meta gene expression plot for CAF (left), with annotations highlighting regions of elevated CAF gene expression on the corresponding H&E image (right). e Pixel-level meta gene expression plot specifically for myCAF (left), accompanied by annotations indicating regions of elevated myCAF gene expression on the H&E image (right). f Pixel-level meta gene expression plot for iCAF (left), with annotations denoting regions of elevated iCAF gene expression on the H&E image (right). g Pixel-level meta gene expression plot for apCAF (left), with annotations indicating regions of elevated apCAF gene expression on the H&E image (right). h Overlay showcasing regions of high gene expression for myCAF, iCAF, apCAF, and general CAF.

References

    1. Larsson, L., Frisen, J. & Lundeberg, J. Spatially resolved transcriptomics adds a new dimension to genomics. Nat. Methods18, 15–18 (2021). 10.1038/s41592-020-01038-7 - DOI - PubMed
    1. Walker, B. L. et al. Deciphering tissue structure and function using spatial transcriptomics. Commun. Biol.5, 220 (2022). 10.1038/s42003-022-03175-5 - DOI - PMC - PubMed
    1. Baccin, C. et al. Combined single-cell and spatial transcriptomics reveal the molecular, cellular and spatial bone marrow niche organization. Nat. Cell Biol.22, 38–48 (2020). 10.1038/s41556-019-0439-6 - DOI - PMC - PubMed
    1. Hwang, W. L. et al. Single-nucleus and spatial transcriptome profiling of pancreatic cancer identifies multicellular dynamics associated with neoadjuvant treatment. Nat. Genet54, 1178–1191 (2022). 10.1038/s41588-022-01134-8 - DOI - PMC - PubMed
    1. Marx, V. Method of the year: spatially resolved transcriptomics. Nat. methods18, 9–14 (2021). 10.1038/s41592-020-01033-y - DOI - PubMed

MeSH terms