. 2024 Aug 24;15(1):7289.
doi: 10.1038/s41467-024-51755-2.

The significance of electrical signals in maturing spermatozoa for phosphoinositide regulation through voltage-sensing phosphatase

Affiliations

The significance of electrical signals in maturing spermatozoa for phosphoinositide regulation through voltage-sensing phosphatase

Takafumi Kawai et al. Nat Commun. .

Abstract

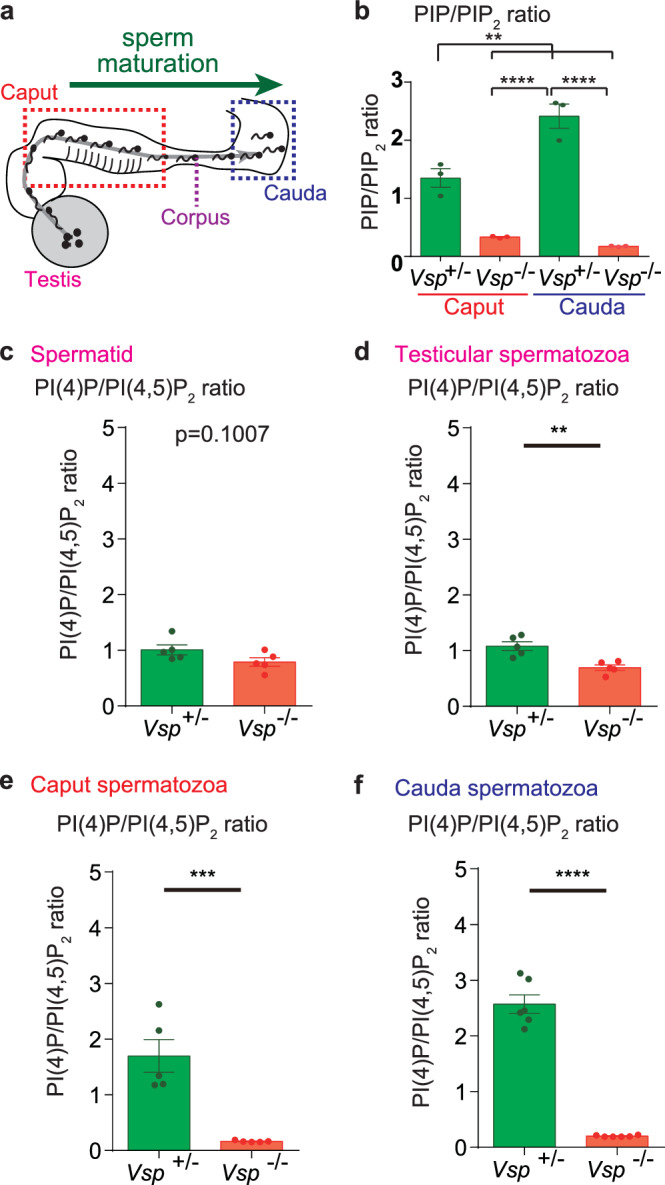
Voltage-sensing phosphatase (VSP) exhibits voltage-dependent phosphatase activity toward phosphoinositides. VSP generates a specialized phosphoinositide environment in mammalian sperm flagellum. However, the voltage-sensing mechanism of VSP in spermatozoa is not yet characterized. Here, we found that VSP is activated during sperm maturation, indicating that electric signals in immature spermatozoa are essential. Using a heterologous expression system, we show the voltage-sensing property of mouse VSP (mVSP). The voltage-sensing threshold of mVSP is approximately -30 mV, which is sensitive enough to activate mVSP in immature spermatozoa. We also report several knock-in mice in which we manipulate the voltage-sensitivity or electrochemical coupling of mVSP. Notably, the V312R mutant, with a minor voltage-sensitivity change, exhibits abnormal sperm motility after, but not before, capacitation. Additionally, the V312R mutant shows a significant change in the acyl-chain profile of phosphoinositide. Our findings suggest that electrical signals during sperm maturation are crucial for establishing the optimal phosphoinositide environment in spermatozoa.


Conflict of interest statement

The authors declare no competing interests.

Figures

Fig. 1
Fig. 1. VSP shows the phosphatase activity in maturing spermatozoa.
a Spermatozoa, which differentiate in the testis, undergo maturation as they are transported through the caput epididymis to the cauda epididymis. By the time they reach the cauda epididymis, they become fully mature and are capable of fertilization. The matured spermatozoa are stored in the epididymal cauda. b PIP/PIP2 ratio in spermatozoa from caput and cauda epididymis of each genotype mice. The significant difference of PIP/PIP2 ratio between Vsp+/- and Vsp-/- was already observed in caput epididymal spermatozoa, but the difference is more pronounced in cauda epididymal spermatozoa (Tukey’s multiple comparison test. p-value is adjusted for multiple comparison. **p < 0.01, ****p < 0.0001, n = 3 independent mice for each group). The exact p-value is shown in the Data Source file. Data are represented as mean ± s.e.m. cf PRMC-MS analysis was performed at different maturation stages of spermatozoa. The calculated PI(4)P/PI(4,5)P2 ratios are shown. (unpaired two-sided t-test, **p < 0.01, ***p < 0.01, ****p < 0.0001). The data from cauda epididymis (f) was already reported in the previous study. The experiment group in caput epididymis (e) corresponds to the experiment group of “low K+” shown in Supplementary Fig. 4. For (cf), n = 5,5,5 and 6 biologically independent mice in each genotype are used, respectively. Data are represented as mean ± s.e.m. The exact p-value is shown in the Data Source file.
Fig. 2
Fig. 2. mVSP shows voltage-sensing phosphatase activity in the range of the resting membrane potentials of immature spermatozoa.
a Recording of the resting membrane potential from immature spermatozoa. n = 15 cells examined over 7 independent mice. Data are represented as mean ± s.e.m. b The structural comparison of VSD between mVSP (light blue) and Ci-VSP (orange). The VSD structure of mVSP was predicted with ColabFold, an opensource software for protein structure prediction. The VSD of Ci-VSP was solved in the previous study. Some important residues are shown with the numbering of mVSP amino acids residues. c Schematic diagram of the modified mVSP (mVSP*). The voltage-sensing domain, linker region for electrochemical coupling, and phosphatase domain remained intact. The sequence alignment of the VSD between mVSP and Ci-VSP is also presented with amino acids from the experiment shaded in blue and orange, respectively. d The structure of the mVSP* was predicted with AlphaFold2. mVSP and Ci-VSP regions are shown in cyan and orange, respectively. The N terminus region is omitted. e, f Immunoblots against the surface proteins and total protein were detected by HA-antibody. The signals (e) and statistics (f) are shown. (*p < 0.05, unpaired two-sided t-test). N = 5 independent samples in (f). Data are represented as mean ± s.e.m. The exact p-value is shown in the Data Source file. g Voltage-dependent regulation of KCNQ2/3 activities by mVSP*. KCNQ2/3 was co-expressed with either the original mVSP, mVSP* WT or mVSP* C458S, an enzyme dead mutant. A +50 mV depolarization pulse was applied to activate both the VSPs and KCNQ2/3. The holding potential is −60mV. In mVSP* WT, the KCNQ2/3 current gradually decreased. In contrast, the current decrease was not observed in KCNQ2/3 co-expressed with either the mVSP or mVSP* C458S. h Statistical analysis for percent reduction of KCNQ2/3 currents. There was significant difference between WT and C458S (Tukey’s multiple comparison test. p-value is adjusted for multiple comparison. ***p < 0.001, ****p < 0.0001). N = 7, 8 and 8 independent experiments for mVSP, mVSP* and mVSP* C458S, respectively. Data are represented as mean ± s.e.m. The exact p-value is shown in the Data Source file. Voltage-dependency of mVSP* was analyzed using GIRK current. i Representative traces and the time course of GIRK current amplitudes with repetitive mVSP* activation. 1 s depolarization pulses (to activate mVSP*) were applied 21 times in the intervals of test pulses (−120mV, 100 ms). The red trace indicates the 21st trace. j Time course of the percent current reduction across repeated pulses. N = 11 independent experiments. Data are represented as mean ± s.e.m. k The voltage-dependency of mVSP* was estimated from the percent current reduction at the 21st pulse in (j). N = 11 and 3 independent experiments for mVSP* and mVSP* C458S, respectively. Data are represented as mean ± s.e.m.
Fig. 3
Fig. 3. Voltage-dependency analysis of mVSP mutants using PLCδ1PH-GFP combined with TEVC.
a Schematic illustration of VCF experiments. b Left, Representative traces of fluorescence changes in mVSP*. 10 s pulses with different voltages were applied to observe fluorescence changes. The traces at various voltages are shown with different colors: black, cyan, blue, green, and red; to represent −50 mV, −25 mV, 0 mV, +50 mV and +100 mV, respectively. Right, The voltage-dependent activity of mVSP* WT as examined by fluorescence change. N = 10 independent experiments. Data are represented as mean ± s.e.m. c Schematic diagram showing the mutated residues targeted in the VCF experiment. Representative traces of fluorescence changes in mVSP* mutants. d Effect of mutations on VSD. D225R, R309Q and V312R were examined based on previous studies. N = 5, 6 and 7 independent experiments for D225R, R309Q and V312R, respectively. Because V312R showed significant difference from WT at −25 mV, it is also shown in the separate bar graph (Unpaired two-sided t-test, ****p < 0.0001). Data are represented as mean ± s.e.m. The exact p-value is shown in the Data Source file. e Effect of VSD-PD linker mutation. K347Q did not show any fluorescence change. N = 5. f Effect of PD mutation. C458S did not show any fluorescence change. N = 4 independent experiments. Data are represented as mean ± s.e.m. Surface protein expression of mVSP and its mutants (g, K347Q and D225R; h, V312R and C458S; i, R309Q) in Xenopus oocytes. Images (i) and statistics (ii) are shown. Unpaired two-sided t-test or Dunnett’s multiple comparisons were performed for comparison with WT, but there was no significant difference. N = 5 independent samples in (e) and (f), while n = 6 independent samples in (g). Data are represented as mean ± s.e.m. The exact p-value with adjustment for multiple comparison is shown in the Data Source file.
Fig. 4
Fig. 4. mVSP V312R shows moderate but significant change in sperm motility only after capacitation.
a Schematic diagram shows the mutated residues targeted in the knock-in mouse experiment. b Western blotting results show the protein expression of mVSP and Basigin (positive control) in native spermatozoa of WT (VspWT/WT), Vsp KO, V312R mutants (VspVR/VR), D225R mutants (VspDR/DR) and K347Q mutants (VspKQ/KQ). In VspDR/DR and VspKQ/KQ, the mVSP signal disappeared as well as Vsp KO. Unpaired two-sided t-tests were performed between the WT and homozygous mutants. **p < 0.01. For V312R, n = 4, 5 and 1 independent mice for VspWT/WT, V312R mutants (VspVR/VR), and Vsp KO, respectively. For D225R, n = 3 independent mice for each genotype. For K347Q, n = 3 independent mice for each genotype. Data are represented as mean ± s.e.m. The exact p-value is shown in the Data Source file. c, d Analysis of sperm motility before (c) and after (d) capacitation in WT and VspVR/VR. Left, Trajectories of spermatozoa isolated from WT and VspVR/VR mice. Spermatozoa were incubated for only 10 min in TYH in (c), while 2 h in (d). Right, Statistical analysis was performed on the percentage of cells showing circular motion using unpaired two-sided t-test (*p < 0.05). N = 5 independent mice for all experiment groups. Data are represented as mean ± s.e.m. The exact p-value is shown in the Data Source file. e Illustration of the parameters in sperm motility analysis. f, g Quantitation of sperm motility parameters of non-capacitated (f) and capacitated (g) spermatozoa. The individual parameters are described in (e). Unpaired two-sided t-test *p < 0.05. N = 5 independent mice for all experiment groups. Data are represented as mean ± s.e.m. The exact p-value is shown in the Data Source file.
Fig. 5
Fig. 5. Spermatozoa of mVSP V312R show moderate phenotype in PI(4)P/PI(4,5)P2 ratio especially in LC-PUFA containing acyl chains.
a Schematic diagram showing the V312R mutation residue and different maturation stages of spermatozoa. b Total PI(4)P/PI(4,5)P2 analysis of spermatozoa in caput and cauda epididymis from WT (VspWT/WT) and V312R mutants (VspVR/VR). There was no difference between the two genotypes, although the PI(4)P/PI(4,5)P2 ratio significantly increased during maturation in both genotypes. (Tukey’s multiple comparison test. p-value is adjusted for multiple comparison. ****p < 0.0001, n = 10 for each group). N = 10 independent mice for each genotype. Data are represented as mean ± s.e.m. The exact p-value is shown in the Data Source file. c, d PI(4)P/PI(4,5)P2 ratio profiles are identified based on sn-1 and sn-2 acyl chains in VspWT/WT and VspVR/VR spermatozoa from caput (c) and cauda (d) epididymis. n.a. indicates that the calculation cannot be performed due to no PI(4,5)P2 detection. N = 10 independent mice for each genotype, but the outlier is removed as appropriate. See also Source Data file. Data are represented as mean ± s.e.m. e Two-sided multiple-t test with no adjustments for multiple comparisons is performed and the p-value is shown in the table. The increases or decreases in VspVR/VR with a p-value < 0.05 were highlighted in red and blue, respectively. f, g The comparison of for (40:6) acyl chain in caput and cauda epididymis. (two-sided t-test., *p < 0.05 and **p < 0.01, respectively. N = 10 independent mice for each genotype. Data are represented as mean ± s.e.m. The exact p-value is shown in the Data Source file.
Fig. 6
Fig. 6. Schematic illustration showing the model for mVSP activation in spermatozoa.
a mVSP activation during sperm maturation. Proper PI(4,5)P2 environment of sperm flagellum, which is important for sperm function, is gradually formed during this process. b Voltage-dependency of mVSP in spermatozoa. We hypothesize that both V312R and WT are activated with resting membrane potential of maturing spermatozoa. D225R and K347Q shows protein degradation, because the basal phosphatase activity is required for VSP expression in spermatozoa.

References

    1. Hille B. Ion channels of excitable membranes. Sinauer Associates Inc, Sunderland (2001).
    1. Murata, Y., Iwasaki, H., Sasaki, M., Inaba, K. & Okamura, Y. Phosphoinositide phosphatase activity coupled to an intrinsic voltage sensor. Nature435, 1239–1243 (2005). 10.1038/nature03650 - DOI - PubMed
    1. Okamura, Y., Kawanabe, A. & Kawai, T. Voltage-sensing phosphatases: biophysics, physiology, and molecular engineering. Physiol. Rev.98, 2097–2131 (2018). 10.1152/physrev.00056.2017 - DOI - PubMed
    1. Okamura, Y. Biodiversity of voltage sensor domain proteins. Pflug. Arch.: Eur. J. Physiol.454, 361–371 (2007).10.1007/s00424-007-0222-6 - DOI - PubMed
    1. Okamura, Y. & Dixon, J. E. Voltage-sensing phosphatase: its molecular relationship with PTEN. Physiology26, 6–13 (2011). 10.1152/physiol.00035.2010 - DOI - PubMed

Substances

LinkOut - more resources