. 2024 Oct:69:101439.
doi: 10.1016/j.dcn.2024.101439. Epub 2024 Aug 22.

Identifying developmental changes in functional brain connectivity associated with cognitive functioning in children and adolescents with ADHD

Affiliations

Identifying developmental changes in functional brain connectivity associated with cognitive functioning in children and adolescents with ADHD

Brian Pho et al. Dev Cogn Neurosci. 2024 Oct.

Abstract

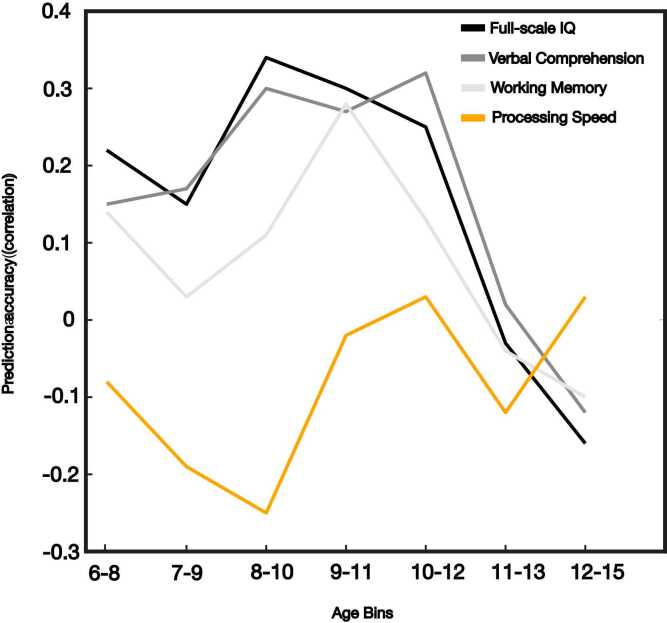
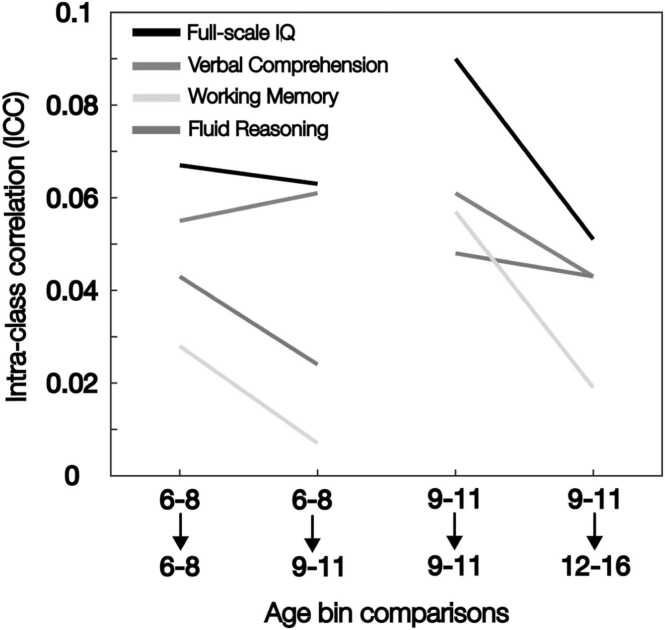
Youth diagnosed with Attention-Deficit/Hyperactivity Disorder (ADHD) often show deficits in various measures of higher-level cognition, such as, executive functioning. Poorer cognitive functioning in children with ADHD has been associated with differences in functional connectivity across the brain. However, little is known about the developmental changes to the brain's functional properties linked to different cognitive abilities in this cohort. To characterize these changes, we analyzed fMRI data (ADHD = 373, NT = 106) collected while youth between the ages of 6 and 16 watched a short movie-clip. We applied machine learning models to identify patterns of network connectivity in response to movie-watching that differentially predict cognitive abilities in our cohort. Using out-of-sample cross validation, our models successfully predicted IQ, visual spatial, verbal comprehension, and fluid reasoning in children (ages 6 - 11), but not in adolescents with ADHD (ages 12-16). Connections with the default mode, memory retrieval, and dorsal attention were driving prediction during early and middle childhood, but connections with the somatomotor, cingulo-opercular, and frontoparietal networks were more important in middle childhood. This work demonstrated that machine learning approaches can identify distinct functional connectivity profiles associated with cognitive abilities at different developmental stages in children and adolescents with ADHD.

Keywords: ADHD; Cognition; Development; FMRI; Movie-watching.


Conflict of interest statement

Declaration of Competing Interest The authors declare the following financial interests/personal relationships which may be considered as potential competing interests Bobby Stojanoski reports financial support was provided by Natural Sciences and Engineering Research Council of Canada. If there are other authors, they declare that they have no known competing financial interests or personal relationships that could have appeared to influence the work reported in this paper.

Figures

Fig. 1
Fig. 1
: Processing stages for the neuroimaging data. There are three overall stages to the data pipeline: preprocessing, modeling, and analysis. Preprocessing involved correcting the raw MRI and fMRI data for motion, coregistering the structural and functional images, normalizing to a standard template, generating a functional connectivity matrix, and splitting the participants by age or diagnosis. Next is modelling and it starts with searching for the optimal parameters for the model, then training and validating the model using the functional connectivity matrices, randomly permutating the data, and ends with extracting the model’s feature weights. Lastly, the feature weights were analyzed by calculating the intraclass correlation coefficient, using the weights to cross-predict cognition in a different age bin, and visualizing the feature weights.
Fig. 2
Fig. 2
: Feature weights used to predict five cognitive abilities in the entire ADHD group, Bin 1, and Bin 2. Each row represents one of five WISC measures: FSIQ, VSI, VCI, FRI, and WMI. Each column represents one of three ADHD groups: All (ages 6–16), Bin 1 (ages 6–8), and Bin 2 (ages 9–11). Each scale applies to the feature weight matrices in the row. A feature weight matrix represents the average feature weight for all connections between two networks shown for all networks. Darker cells in the feature weight matrix represent more extreme values, while lighter cells represent values closer to zero. Red cells represent positive values (increases in value for that network connection increased the predicted cognitive score), while blue cells represent negative values (increases in value for that network connection decreased the predicted cognitive score). Diagonal cells represent intranetwork connections, while off-diagonal cells represent internetwork connections. The networks are visual (VIS), frontoparietal task control (FPN), default mode (DMN), sensory/somatomotor (hand; SMH), sensory/somatomotor (mouth; SMM), cingulo-opercular task control (CON), auditory (AUD), salience (SAL), memory retrieval (MEM), ventral attention (VAN), cerebellar (CER), subcortical (SUB), and dorsal attention (DAN). Row four represents a summary of connections weights across the networks based by taking the average feature-weights for each group (ADHD: All, Bin 1 and Bin 2) across the different cognitive measures.
Fig. 3
Fig. 3
: Scores for cross-predicting six cognitive ability between Bin 1 and Bin 2. For each matrix, rows represent the age bin (Bin 1 or Bin 2) the model was trained on, while columns represent the age bin (Bin 1 or Bin 2) the model was tested on. The top-left to bottom-right diagonal represents training and testing the model within the same age bin (same scores as in Table 3), while the bottom-left to top-right diagonal represents the training the model on Bin 2 and testing on Bin 1 and training the model on Bin 1 and testing on Bin 2 respectively. Values within each cell are the Pearson r correlation test score and represent the linear correlation between the model’s predicted values of the cognitive ability and the true values. Purple cells indicate statistically significant at p<.05 after being corrected for multiple comparisons using the max-statistic method, while grey cells indicate not statistically significant.
Fig. 4
Fig. 4
: Difference in feature weights between Bin 1 and Bin 2 for five cognitive abilities. Each row represents one of five WISC measures: FSIQ, VSI, VCI, FRI, and WMI. The left column (grey) represents all feature weight differences between Bin 1 and 2, the center column (pink) represents network connections with the most dissimilar values for Bin 1 and 2 (“distinct” networks), and the right column (green) represents network connections with the most similar values between Bin 1 and 2 (“shared” networks). The distinct network profiles were obtained by thresholding all feature weight differences between Bins 1 and 2 by the ten largest differences. The shared network profiles were obtained by thresholding all feature weight differences between Bins 1 and 2 by the ten smallest differences. For the left and center columns, darker cells represent a larger difference between the feature weights assigned to Bin 1 and 2 when predicting cognition, while lighter cells represent a smaller difference. Diagonal cells represent intra-network connections, while off-diagonal cells represent internetwork connections.
Fig. 5
Fig. 5
: Prediction accuracy across age bins using a sliding window approach. Y-axis represent prediction accuracy (correlation between predicted score across four cognitive tests) and actual individual performance on each test. X-axis represent smaller age bins (increased resolution) organized in a sliding window 6–8 (N=69), 7–9 (N=75), 8–10 (N=75), 9–11 (N=75),10–12 (N=75), 11–13 (N=75) and 12–15 (N=75). Prediction accuracy across all age bins for four cognitive abilities: 1) Full-scale IQ (black), Verbal comprehension (dark gray), Working memory (light gray) and Processing Speed (orange).
Fig. 6
Fig. 6
: Interclass correlations across age bins. Y-axis represents interclass correlations (ICC) values (p<.05) for within and between age-bin comparisons for four cognitive measures; full scale IQ (black), verbal comprehension (dark grey), working memory (light grey) and fluid reasoning (steel grey). Each within age-bin values represent the mean of five random iterations, and between age-bin values represent the mean of the two halves, across five iterations.

References

    1. A review of the biological bases of ADHD: What have we learned from imaging studies? - Durston - 2003 - Mental Retardation and Developmental Disabilities Research Reviews - Wiley Online Library. https://onlinelibrary.wiley.com/doi/10.1002/mrdd.10079. - PubMed
    1. ADHD and academic performance: why does ADHD impact on academic performance and what can be done to support ADHD children in the classroom? - Daley - 2010 - Child: Care, Health and Development - Wiley Online Library. 〈https://onlinelibrary.wiley.com/doi/abs/10.1111/j.1365-2214.2009.01046.x〉. - DOI - PubMed
    1. Alexander L.M., et al. An open resource for transdiagnostic research in pediatric mental health and learning disorders. Sci. Data. 2017;4 - PMC - PubMed
    1. Alloway T.P., Gathercole S.E., Pickering S.J. Verbal and visuospatial short-term and working memory in children: are they separable? Child Dev. 2006;77:1698–1716. - PubMed
    1. Association Between Childhood Specific Learning Difficulties and School Performance in Adolescents With And Without ADHD Symptoms: A 16-Year Follow-Up - Anja Taanila, Hanna Ebeling, Marjo Tiihala, Marika Kaakinen, Irma Moilanen, Tuula Hurtig, Anneli Yliherva, 2014. 〈https://journals.sagepub.com/doi/abs/10.1177/1087054712446813〉. - DOI - PubMed

Publication types