. 2024 Aug 25;15(1):7324.
doi: 10.1038/s41467-024-51624-y.

Multi-omics profiling of retinal pigment epithelium reveals enhancer-driven activation of RANK-NFATc1 signaling in traumatic proliferative vitreoretinopathy

Affiliations

Multi-omics profiling of retinal pigment epithelium reveals enhancer-driven activation of RANK-NFATc1 signaling in traumatic proliferative vitreoretinopathy

Mengyu Liao et al. Nat Commun. .

Abstract

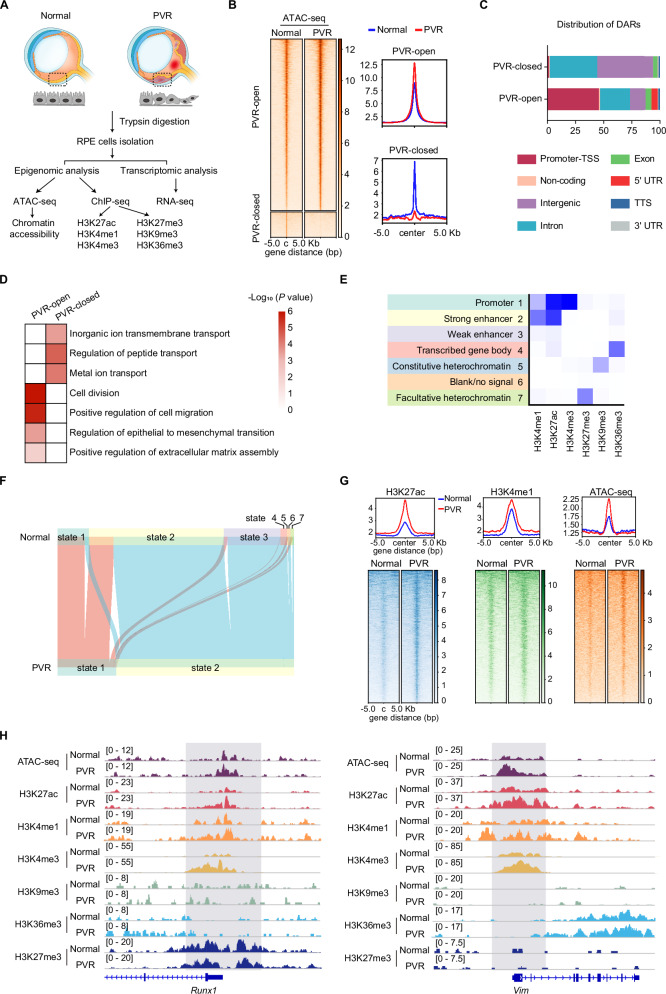
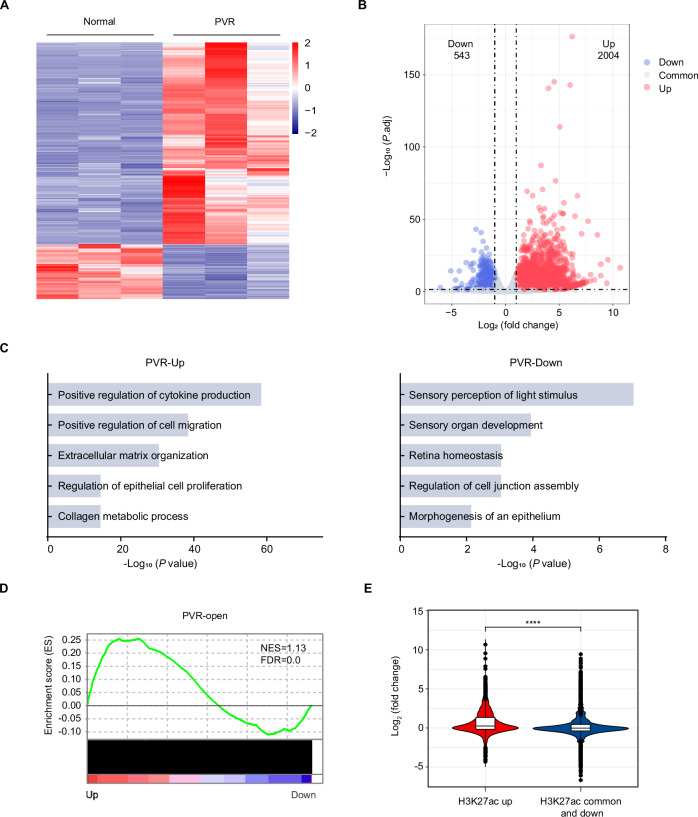
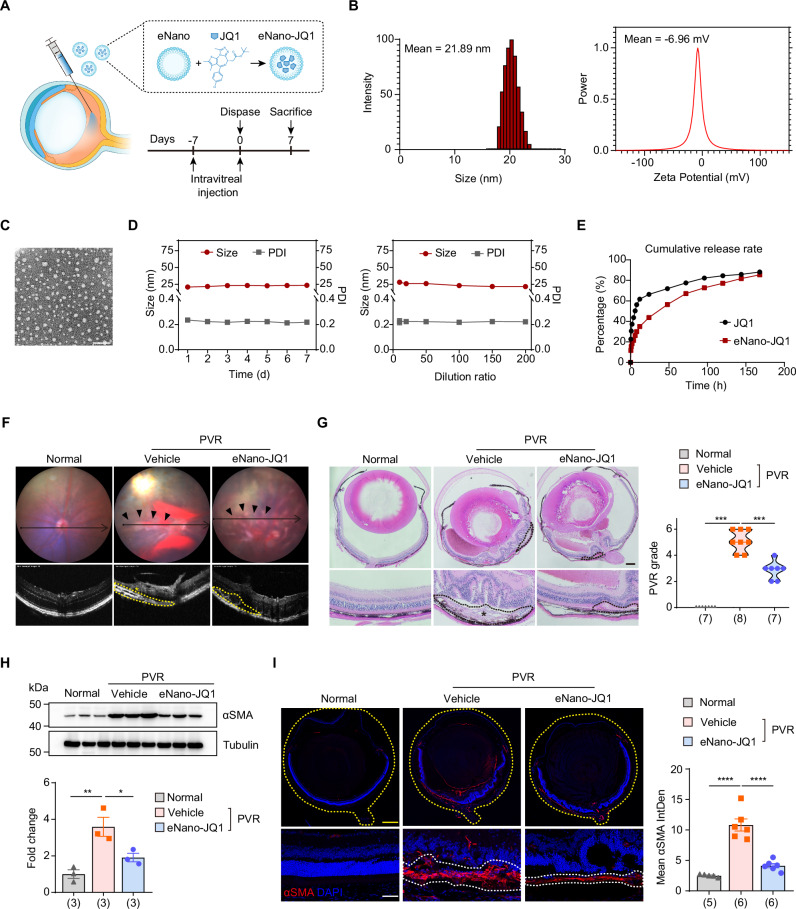
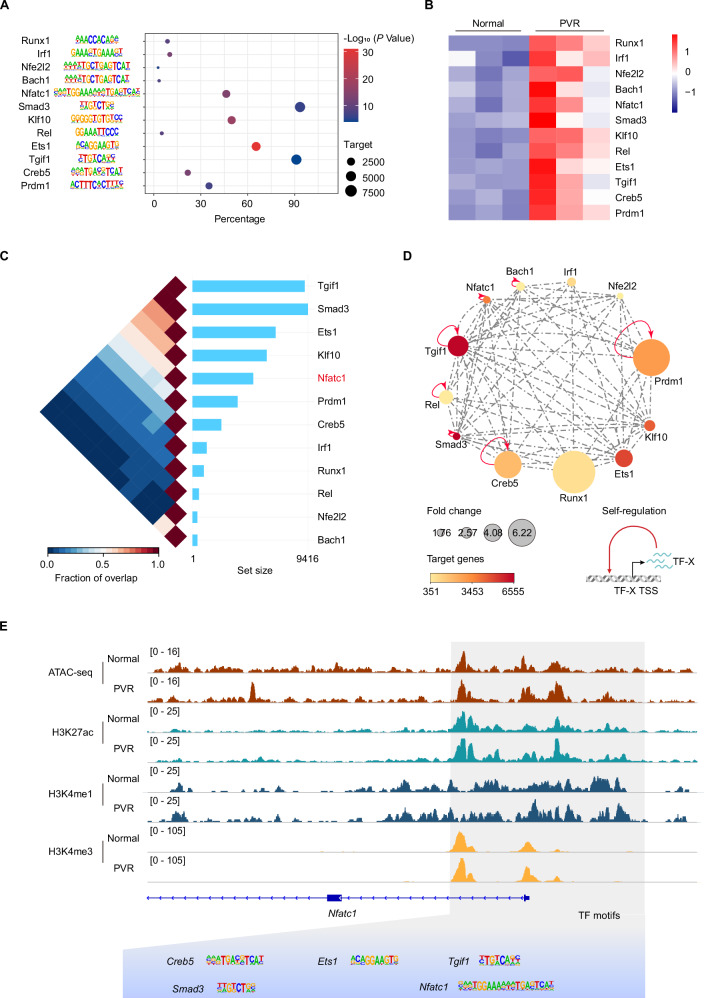
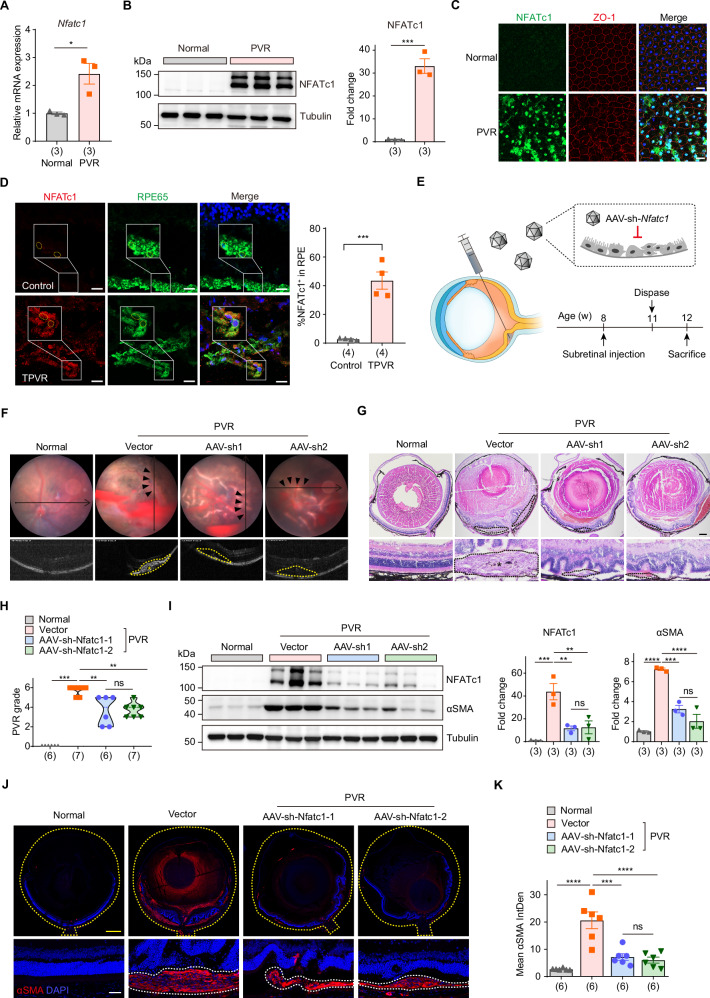
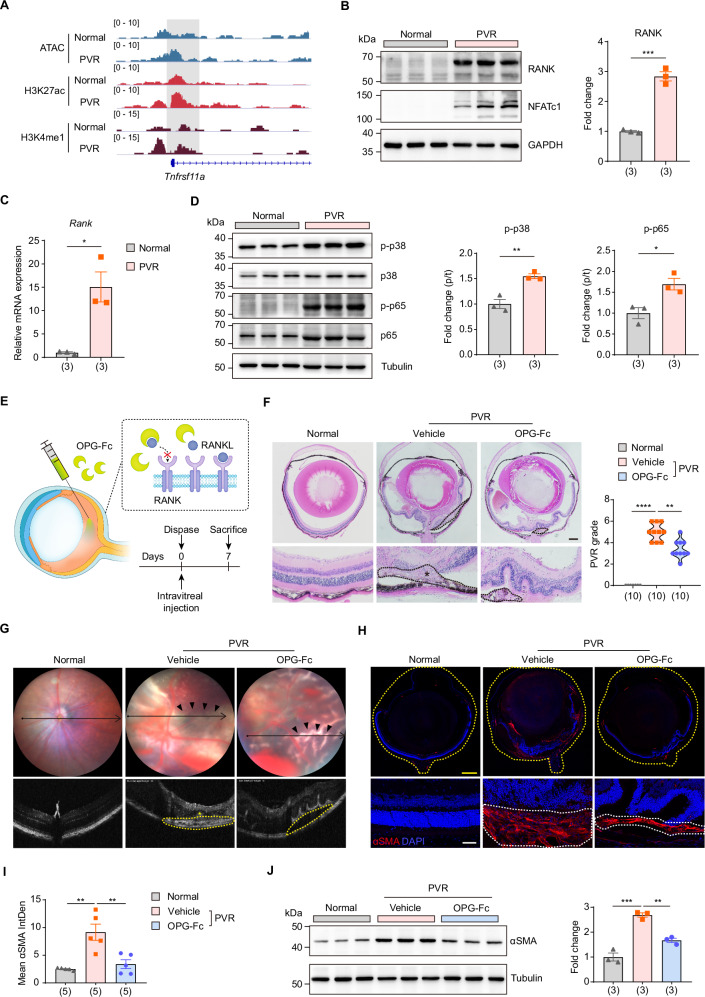
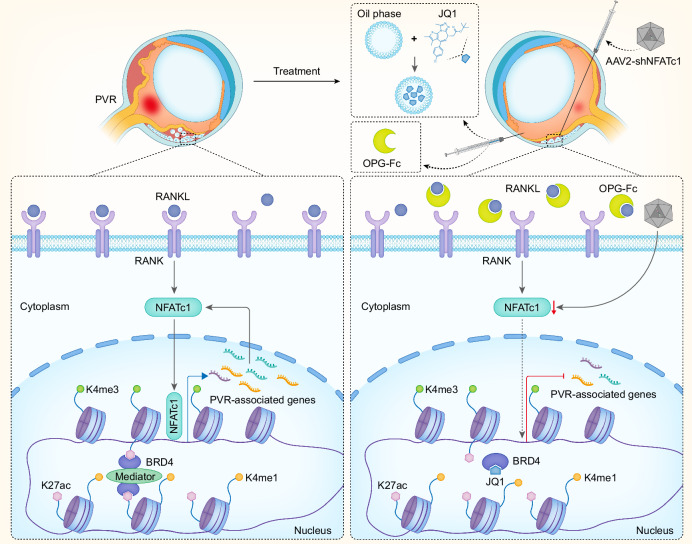
During the progression of proliferative vitreoretinopathy (PVR) following ocular trauma, previously quiescent retinal pigment epithelial (RPE) cells transition into a state of rapid proliferation, migration, and secretion. The elusive molecular mechanisms behind these changes have hindered the development of effective pharmacological treatments, presenting a pressing clinical challenge. In this study, by monitoring the dynamic changes in chromatin accessibility and various histone modifications, we chart the comprehensive epigenetic landscape of RPE cells in male mice subjected to traumatic PVR. Coupled with transcriptomic analysis, we reveal a robust correlation between enhancer activation and the upregulation of the PVR-associated gene programs. Furthermore, by constructing transcription factor regulatory networks, we identify the aberrant activation of enhancer-driven RANK-NFATc1 pathway as PVR advanced. Importantly, we demonstrate that intraocular interventions, including nanomedicines inhibiting enhancer activity, gene therapies targeting NFATc1 and antibody therapeutics against RANK pathway, effectively mitigate PVR progression. Together, our findings elucidate the epigenetic basis underlying the activation of PVR-associated genes during RPE cell fate transitions and offer promising therapeutic avenues targeting epigenetic modulation and the RANK-NFATc1 axis for PVR management.


Conflict of interest statement

The authors declare the following competing interests: A patent application (P.R.C application number: 202410504090.1) was filed by Tianjin Medical University General Hospital. H.Y., Y.C., M.L., Y.L., Y.Z., and Z.Y. from Tianjin Medical University, Z.Z. and Y.H. from Xuzhou Medical University are inventors. The patent application covered the preparation methods for eNano-JQ1 and their intraocular application. The other authors declare no competing interests.

Figures

Fig. 1
Fig. 1. Profiling of dynamic epigenetic changes in RPE post-PVR.
A Experimental strategy of epigenomic and transcriptomic analysis of RPE cells isolated from normal and PVR mice. The ATAC-seq, ChIP-seq, and RNA-seq experiments were each conducted in triplicate. B Heatmap showing the chromatin accessibility in RPE cells from normal and PVR mice. C Bar charts showing the genome-wide distribution of differentially accessible regions (DARs) in RPE cells. D Gene ontology (GO) analysis (performed using Metascape) of DARs in RPE cells. Statistical analysis was conducted with Metascape (https://metascape.org/gp/index.html), using the two-sided cumulative hypergeometric distribution. E Seven chromatin states inference based on the ChromHMM algorithm. F Alluvial plot showing the dynamics of chromatin states. G Average ATAC-seq and ChIP-seq signals of H3K4me1 around pronounced H3K27ac signal regions (upper), and heatmaps visualization of histone marks and ATAC-seq signals (lower). H Representative ChIP-seq tracks of H3K27ac, H3K4me1, H3K4me3, H3K9me3, H3K36me3, H3K27me3 and ATAC-seq signals on representative genes. Source data are provided as a Source Data file.
Fig. 2
Fig. 2. Active chromatin states are associated with the elevated expression of PVR-related genes.
A Heatmap of differentially gene expression in RPE cells. B Volcano plots showing differentially expressed genes (normal versus PVR). P values were calculated by two-sided Wald test in DESeq2 package. C Gene ontology (GO) analysis of differentially genes. Statistical analysis was conducted with Metascape (https://metascape.org/gp/index.html), using the two-sided cumulative hypergeometric distribution. D Gene set enrichment analysis (GSEA) displaying PVR-open chromatin regions enriched for genes upregulated in PVR RPE cells. FDR: false discovery rate; NES: normalized enrichment score. E Violin plots show that genes marked with higher levels of H3K27ac are significantly associated with gene activation. n = 3 biologically independent experiments. The black horizontal lines within the boxes indicate the median values, the edges of the boxes represent the first and third quartiles of the dataset. The whiskers extend to 1.5 times the interquartile range. P < 2.22 × 10−16 was determined by two-sided Wilcoxon test. ****P < 0.0001. Source data are provided as a Source Data file.
Fig. 3
Fig. 3. Inhibition of the BET bromodomain mitigates the progression of PVR.
A Schematic view of experimental strategy in the PVR mouse model. B The size and zeta potential of eNano-JQ1. C Transmission electron microscopy image of eNano-JQ1. Scale bar: 100 nm. This was repeated at least three times independently with similar results. D The stability was evaluated by measuring changes in size and polydispersity index (PDI) at different time (left) and dilution ratio (right). n = 3 independent experiments. Data were represented as means ± SEMs. E Release profile of JQ1 from eNano-JQ1. F Representative fundus imaging and OCT image of mice. The pathological changes were indicated with black arrows. The retinal folds or tractional area was circled with yellow dotted lines, and PVR membrane was marked with an asterisk (*). G Representative H&E staining of eye sections from mice with indicated treatment (left). The black dotted lines indicated pathological changes, and PVR membrane was marked with an asterisk (*). Scale bar: 250 μm. Quantification of PVR severity (right). n = 7, 8, 7 samples, respectively. P = 0.0002, 0.0009 were determined by two-tailed Mann–Whitney test. ***P < 0.001. H Western blot analysis (up) and quantification (down) of αSMA in eyecup tissues from normal and PVR mice treated with vehicle or eNano-JQ1. n = 3 samples. Data are represented as means ± SEMs. P values = 0.005, 0.0356 were determined by one-way ANOVA multiple comparisons test. *P < 0.05, **P < 0.01. I Representative immunofluorescent staining of αSMA in mouse eye sections (left). The yellow dotted lines indicated the whole eye. The white dotted lines indicated PVR membrane. Scale bars: yellow 100 μm, white 20 μm. Quantification of mean fluorescence integrated density of αSMA (right). n = 5, 6, 6 samples, respectively. Data are represented as means ± SEMs. P values < 0.0001 were determined by one-way ANOVA multiple comparisons test. ****P < 0.0001. Source data are provided as a Source Data file.
Fig. 4
Fig. 4. Unraveling the transcriptional regulatory networks underlying PVR.
A Bubble chart showing the enrichment of transcription factor (TF) binding motifs in PVR-open region. P values were calculated by HOMER based on binomial distribution. B Heatmap depicting the FPKM values of TFs. C The triangular heatmap displays the co-localization of TFs. Fraction of overlap refers to the proportion of shared elements between two TF, where 0 indicates no overlap and 1 means full overlap. The set size shows the number of genomic regions in each TF. D The TF regulatory network for PVR. Node color represents number of TF target genes and node size represents changes in TF expression. E IGV track profiles of ATAC-seq and ChIP-seq for H3K27ac, H3K4me1 and H3K4me3 on a representative TF gene. Source data are provided as a Source Data file.
Fig. 5
Fig. 5. Suppressing NFATc1 in RPE slows PVR progression.
A RT-qPCR analysis of Nfatc1 expression in primary RPE cells. n = 3 biologically independent experiments. Data are represented as means ± SEMs. P = 0.0188 was determined by two-tailed unpaired T test. *P < 0.05. B Western blot analysis (left) and quantification (right) of NFATc1 in eyecup tissues from normal and PVR mice. n = 3 samples. Data are represented as means ± SEMs. P = 0.0005 was determined by two-tailed unpaired T test. ***P < 0.001. C Immunofluorescence staining of NFATc1 in RPE flat from normal and PVR mice. Scale bar: 20 μm. This was repeated at least three times independently with similar results. D Immunofluorescence staining of NFATc1 and RPE65 in human PVR membrane and donor eye sections. Scale bars: 20 μm. n = 4 samples. Data are represented as means ± SEMs. P = 0.0005 was determined by two-tailed unpaired T test. ***P < 0.001. E Schematic view of experimental strategy in the PVR mouse model. F Representative fundus imaging and OCT image of normal and PVR mice treated with vector, rAAV2/2-sh-Nfatc1-1 (AAV-sh1) or rAAV2/2-sh-Nfatc1-2 (AAV-sh2). The pathological changes were indicated with black arrows. The retinal folds or tractional area was circled with yellow dotted lines, and PVR membrane was marked with an asterisk (*). G Representative H&E staining of eye sections from mice with indicated treatment. The black dotted lines indicated pathological changes, and PVR membrane was marked with an asterisk (*). Scale bar: 250 μm. H Quantification of PVR severity. n = 6, 7, 6, 7 samples, respectively. P = 0.0006, 0.0087, 0.0017 were determined by two-tailed Mann–Whitney test. **P < 0.01, ***P < 0.001. I Western blot analysis (left) and quantification (right) of NFATc1, αSMA in eyecup tissues from normal and PVR mice treated with vectors, AAV-sh1 or AAV-sh2. n = 3 samples. Data are represented as means ± SEMs. For NFATc1, P = 0.0009, 0.0055, 0.0066 were determined by one-way ANOVA multiple comparisons test. For αSMA, P < 0.0001, P = 0.0005, P < 0.0001 were determined by one-way ANOVA multiple comparisons test. **P < 0.01, ***P < 0.001, ****P < 0.0001. J Representative immunofluorescent staining of αSMA in mouse eye sections. The yellow dotted lines indicated the whole eye. The white dotted lines indicated PVR membrane. Scale bars: yellow 100 μm, white 20 μm. K Quantification of mean fluorescence integrated density of αSMA. n = 6 samples. Data are represented as means ± SEMs. P < 0.0001, P = 0.0001, P < 0.0001 were determined by one-way ANOVA multiple comparisons test. ***P < 0.001, ****P < 0.0001. Source data are provided as a Source Data file.
Fig. 6
Fig. 6. Suppression of the RANK-NFATc1 axis delays PVR progression.
A IGV track profiles of ATAC-seq, ChIP-seq of H3K27ac and H3K4me1 on Tnfrsf11a (Rank) gene. B Western blot analysis (left) and quantification (right) of RANK in eyecup tissues from normal and PVR mice. n = 3 samples. Data are represented as means ± SEMs. P = 0.0003 was determined by two-tailed unpaired T test. ***P < 0.001. C RT-qPCR analysis of Rank expression in primary RPE cells from normal and PVR mice. n = 3 biologically independent experiments. Data are represented as means ± SEMs. P = 0.0118 was determined by two-tailed unpaired T test. *P < 0.05. D Western blot analysis (left) and quantification (right) of phosphorylated p38 and p65 in eyecup tissues from normal and PVR mice. n = 3 samples. Data are represented as means ± SEMs. P = 0.0059 for p-p38, P = 0.0221 for p-p65 were determined by two-tailed unpaired T test. *P < 0.05, **P < 0.01. E Schematic view of experimental strategy in the PVR mouse model. F Representative H&E staining of eye sections from mice with indicated treatment (left). The black dotted lines indicated pathological changes, and PVR membrane was marked with an asterisk (*). Scale bar: 250 μm. Quantification of PVR severity (right). n = 10 samples. P < 0.0001, P = 0.0016 were determined by two-tailed Mann–Whitney test. **P < 0.01, ****P < 0.0001. G Representative fundus imaging and OCT image of mice. The pathological changes were indicated with black arrows. The retinal folds or tractional area was circled with yellow dotted lines, and PVR membrane was marked with an asterisk (*). (H) Representative immunofluorescent staining of αSMA in mouse eye sections. The yellow dotted lines indicated the whole eye. The white dotted lines indicated PVR membrane. Scale bars: yellow 100 μm, white 20 μm. I Quantification of mean fluorescence integrated density of αSMA. n = 5 samples. Data are represented as means ± SEMs. P = 0.001, 0.003 were determined by one-way ANOVA multiple comparisons test. **P < 0.01. J Western blot analysis (left) and quantification (right) of αSMA in eyecup tissues from normal and PVR mice treated with vehicle or OPG-Fc. n = 3 samples. Data are represented as means ± SEMs. P = 0.0001, 0.002 were determined by one-way ANOVA multiple comparisons test. **P < 0.01, ***P < 0.001. Source data are provided as a Source Data file.
Fig. 7
Fig. 7. Working model.
A schematic illustration presents the epigenetic mechanisms activating RANK-NFATc1 signaling during the progression of PVR and outlines the strategies for targeted intervention.

References

    1. Knyazer, B. et al. Prognostic factors in posterior open globe injuries (zone-III injuries). Clin. Exp. Ophthalmol.36, 836–841 (2008). 10.1111/j.1442-9071.2009.01922.x - DOI - PubMed
    1. Colyer, M. H., Chun, D. W., Bower, K. S., Dick, J. S. & Weichel, E. D. Perforating globe injuries during operation Iraqi Freedom. Ophthalmology115, 2087–2093 (2008). 10.1016/j.ophtha.2008.05.013 - DOI - PubMed
    1. Jin, Y. et al. TRAUMATIC PROLIFERATIVE VITREORETINOPATHY: Clinical and Histopathological Observations. Retina37, 1236–1245 (2017). 10.1097/IAE.0000000000001350 - DOI - PubMed
    1. Cardillo, J. A. et al. Post-traumatic proliferative vitreoretinopathy. The epidemiologic profile, onset, risk factors, and visual outcome. Ophthalmology104, 1166–1173 (1997). 10.1016/S0161-6420(97)30167-5 - DOI - PubMed
    1. Pennock, S., Haddock, L. J., Eliott, D., Mukai, S. & Kazlauskas, A. Is neutralizing vitreal growth factors a viable strategy to prevent proliferative vitreoretinopathy? Prog. Retin Eye Res.40, 16–34 (2014). 10.1016/j.preteyeres.2013.12.006 - DOI - PubMed

MeSH terms

Substances