. 2024 Aug;14(8):e1815.
doi: 10.1002/ctm2.1815.

Multi-omics integration reveals the oncogenic role of eccDNAs in diffuse large B-cell lymphoma through STING signalling

Affiliations

Multi-omics integration reveals the oncogenic role of eccDNAs in diffuse large B-cell lymphoma through STING signalling

Zijuan Wu et al. Clin Transl Med. 2024 Aug.

Erratum in

Abstract

Background: Extrachromosomal circular DNAs (eccDNAs), a type of double-stranded DNAs (dsDNAs) that facilitate the activation of the DNA sensing machinery, have been implicated in the progression and prognosis of various diseases. While the roles of eccDNAs remain contentious, their significance in diffuse large B-cell lymphoma (DLBCL) has not been reported.

Methods: Circular DNA sequencing (circle-seq) was used to demonstrate the expression profile of eccDNAs in DLBCL, and atomic force microscopy to validate the presence of eccDNAs. CCK-8 and scRNA-seq techniques were employed to uncover the activation of eccDNA in the STING pathway, leading to enhanced cell proliferation. Chemotherapeutic drugs were used to test the hypothesis that DNA damage induces the production of eccDNA, thereby activating the STING pathway independent of cGAS. GEO databases were used for verification of the prognosis of the eccDNA-related genes, and animal models were used to investigate the synergistic effects of DNA damage therapy in combination with STING inhibitors on anti-tumour responses.

Results: EccDNAs were widely expressed in DLBCL and associated with the prognosis of patients. Elevated abundance of eccDNAs promoted the progression of DLBCL. Chemotherapeutic drugs-induced DNA damage triggered the generation of eccDNAs, resulting in the activation of the STING signalling in a cGAS-independent manner. Moreover, inhibition of STING exerted a synergistic anti-tumour effect with cisplatin.

Conclusions: EccDNAs induced by DNA damage exert an oncogenic role in DLBCL via activating the STING signalling independently of cGAS. This finding offers a rational therapeutic strategy combining chemotherapy with targeting STING.

Highlights: EccDNAs induced by DNA damage exert an oncogenic role in DLBCL via activating the STING signalling independently of cGAS. The combined treatment of chemotherapeutic drugs with STING inhibitor significantly delayed the tumor progression, providing new insights into the therapeutic strategy for patients with DLBCL, particularly the relapsed and/or refractory (R/R) ones.

Keywords: DNA damage; Diffuse large B‐cell lymphoma; EccDNAs; STING signalling.


Conflict of interest statement

The authors declare no conflict of interest.

Figures
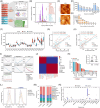
FIGURE 1
FIGURE 1
Identification and characterization of eccDNAs in 18 DLBCL cell lines. (A) Multi‐omics sequencing of 18 DLBCL cell lines. (B) The size distribution of eccDNAs in DLBCL cells. (C) AFM images of extracted eccDNAs in DLBCL cell lines. Scale bar, 200 nm. All imaging experiments were repeated at least three times. (D) Number of genes derived from different types of eccDNAs. (E) Number of eccDNA types amplifying 1 to 10 different genes. (F) Percentage of eccDNAs per Mb from different chromosomes in GCB and non‐GCB DLBCL groups. (G, H) Positive correlation between percentage of eccDNAs per Mb against protein‐coding genes per Mb and Alu elements per Mb in GCB and non‐GCB group cells. (I, J) Nonnegative matrix factorization (NMF) divides the DLBCL cell lines into H and L groups. (K) Abundance of eccDNAs in in GCB and non‐GCB DLBCL groups. (L) GC contents of eccDNA locus and regions immediately upstream and downstream from the eccDNAs compared with the genomic average in H/L groups, and GCB/non‐GCB groups. upstream, upper panel; downstream, lower panel; Orange, 1000 stretches upstream eccDNA locus (from eccDNA_start‐1000 to eccDNA_start); Red, eccDNA (from eccDNA_start to eccDNA_end); Green, 1000 stretches downstream eccDNA locus (from eccDNA_end to eccDNA_end+1000); Purple, 1000 random stretches of the genome of equivalent length as the eccDNA. (M) Frequency of eccDNAs in different classes of genomic regions from H/L groups, and GCB/non‐GCB groups. (N) Normalized mapping ratio of eccDNA reads in different types of elements from H and L groups.
FIGURE 2
FIGURE 2
The results of scRNA‐seq analysis demonstrated the potential roles of eccDNAs in DLBCL. (A) t‐SNE plot of DLBCL cells derived from 18 cell lines. (B) Representative inferred copy number variation of the H and L group cells based on scRNA‐seq data. (C) The copy number variation score of normal B cells and DLBCL cells from different groups. (D) The heatmap shows the differentially expressed genes in H and L groups. (E) GSEA shows the enriched pathways in H group compared with L group. NES, the normalized enrichment score. (F) Survival analysis of DLBCL patients with high or low expression of genes that are highly expressed in the H group from three collected independent cohorts. (G) Single‐cell trajectory analysis of H and L group cells. (H) States of cells in different developmental trajectories based on scRNA‐seq data. (I, J) GSEA shows the enriched pathways in state 1 compared with state 2 and 3. (K) Survival analysis of relatively highly expressed genes in different states. (L) The expression of 9 overlapped genes that are upregulated in H groups detected by scRNA‐seq as well as involved in the pathways of E2F targets and MYC targets detected by qRT‐PCR (n = 18). (M, N) Correlation between the relative levels of PCNA, NOP56, and eccDNA abundance in DLBCL cell lines (n = 18). (O) The receiver operating characteristic (ROC) curve of PCNA is built to differentiate H and L groups. All results are expressed as the mean ± SD of three independent experiments. p‐values were calculated by two‐way ANOVA (C, L) and log rank test (F, K). ns, not significant; *p < 0.05, **p < 0.01, ***p < 0.001.
FIGURE 3
FIGURE 3
EccDNAs promote cell proliferation by activating the STING pathway. (A) The workflow of eccDNA extraction, purification, and transfection. (B) EccDNAs extracted from the KIS1 cell line in H group are transfected into L group cells U2932. (C) The quantified abundance of eccDNAs in the eccDNA+ (cells with eccDNA transfection) and ctrl groups (cells without eccDNA transfection). (D) Analysis of the proliferative ability of cells from eccDNA+ and ctrl groups. (E) tSNE visualization of cells with or without eccDNA transfection based on scRNA‐seq data. (F) Differentially expressed genes in cells with or without eccDNA transfection. (G) GSEA shows the enriched pathways in eccDNA+ cells compared with ctrl cells. (H, I) The top 5 upregulated genes related to proliferation in the eccDNA+ group were observed by scRNA‐seq (H), and validated by qRT‐PCR analysis (I). (J, K) The top five upregulated genes related to interferon in eccDNA+ group observed by scRNA‐seq (J), and validated by qRT‐PCR analysis (K). (L) The expression of proteins in the cGAS‐STING pathway in U2932 cells with or without eccDNA transfection. (M, N) IF assay shows the levels of p‐STING in eccDNA+ and ctrl cells. Scale bar = 50 µm. (O) The expression of cGAS, STING, and p‐STING qualified by western blotting (WB) and compared between H and L groups. (P) Relative levels of STING after STING knockdown in U2932 cells. (Q) Proliferation ability of cells with different levels of STING in U2932 cells. (R) Growth curves of U2932 cells with STING silencing and/or eccDNA transfection. (S) Gene set variation analysis (GSVA) shows the enriched pathways in cells with STING silencing and/or eccDNA transfection. All results are expressed as the mean ± SD of three independent experiments. p‐values were calculated by two‐tailed Student's t‐test (C, D, P, Q), and two‐way ANOVA (H–K, O, R). ns, not significant; *p < 0.05, **p < 0.01, ***p < 0.001.
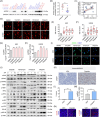
FIGURE 4
FIGURE 4
DNA‐damaging chemotherapeutic agents promote the generation of eccDNAs and activation of STING signalling. (A) WB detects the expression of γH2AX, a marker of DNA double‐strand breaks, in 18 DLBCL cell lines. (B) The quantification and comparison of the levels of γH2AX in H and L group cells. (C) Correlation between γH2AX protein levels and eccDNA abundance in different DLBCL cell lines. (D) Representative images of DLBCL cells treated with DNA‐damaging agents (5 µM) in the comet assay. Scale bar = 50 µm. (E, F) Quantification of tail‐moment in the comet assays. n = 10 cells per cell line and condition. (G, H) Quantification of eccDNA abundance of cells treated with DNA‐damaging agents (1 µM). (I) Representative IF assay for dsDNA. Scale bar = 50 µm. (J) Western blot analysis of the levels of STING pathway in DLBCL cells treated with DNA‐damaging agents. Representative images of three independent experiments. (K–N) Representative images of immunohistochemistry (IHC) staining for γH2AX, scale bar, 50 µm, (K), IHC score of γH2AX (L), eccDNA abundance (M), and IF staining for dsDNA and p‐STING (N) in tumours from immunodeficient mice treated with vehicle (VEH) or cisplatin, scale bar, 20 µm. All results are expressed as the mean ± SD of three independent experiments. p‐values were calculated by two‐tailed Student's t‐test (B, E–H, L, M). *p < 0.05, **p < 0.01, ***p < 0.001.
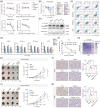
FIGURE 5
FIGURE 5
Chemotherapeutic drugs exert synergistic anti‐tumour effects with the inhibitors of STING. (A) The effects of inhibitors and agonists targeting the cGAS‐STING pathway on five representative DLBCL cell lines. (B) CCK8 assays detect the proliferation ability of 18 DLBCL cell lines treated with a STING inhibitor, H‐151, at different concentrations for 48 h. The dashed line represents 0.5. (C) Apoptotic analysis of four representative DLBCL cell lines treated with different concentrations of H‐151 for 48 h. (D) The expression levels of the apoptotic proteins caspase 3, PARP, and their cleaved forms were detected by WB after treatment with different concentrations of H‐151 for 48 h. Representative images of three independent experiments. (E) CCK8 analysis of proliferation activity in U2932, SU‐DHL‐4, SU‐DHL‐2, and KIS1 cell lines treated with H‐151 in combination with DNA‐damaging agents with different concentrations. (F) The inhibitory effect of STING inhibitor C‐176 in A20 cells. (G) The synergistic effect of C‐176 and cisplatin with different concentrations for 24 h. (H) Tumour volume in immunodeficient mice treated with vehicle only (blue), cisplatin (black), H‐151 (red), and H‐151 in combination with cisplatin (green). Three mice in each group. (I) Tumour tissue sections are subjected to IHC for PCNA expression. Scale bar, 20 µm. (J) Tumour volume in immunocompetent mice treated with vehicle only (blue), cisplatin (black), C‐176 (red), and C‐176 in combination with cisplatin (green). Three mice in each group. (K) Tumour tissue sections are subjected to IHC for PCNA expression. Scale bar = 20 µm. All results are expressed as the mean ± SD of three independent experiments. p‐values were calculated using two‐way ANOVA (H–K). *p < 0.05, **p < 0.01, ***p < 0.001.
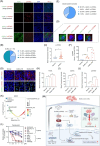
FIGURE 6
FIGURE 6
The cGAS/STING expression exhibits heterogeneity and eccDNA abundance is associated with drug sensitivity. (A) The representative IF images of DLBCL patients with or without cGAS and p‐STING expression. Scale bar, 50 µm. (B) The proportion of patients with or without cGAS and p‐STING expression. (C) IF staining shows the levels of p‐STING between normal and DLBCL patients. (D) The representative IF images of cells with or without cGAS and p‐STING expression from double‐positive patients. (E) The proportion of cells with or without cGAS and p‐STING expression in double‐positive patients. (F) Quantification and comparison of eccDNA abundance in tissues from normal patients, treatment‐naïve (TN), and relapsed/refractory (R/R) DLBCL patients. (G) IF assay detects the levels of PCNA, dsDNA, and p‐STING in tissues from normal patients, TN, and R/R DLBCL patients. Scale bar = 20 µm. (H–J) Quantification and comparison of the levels of PCNA (H), dsDNA (I), and p‐STING (J) in three groups. (K) The volcano plot shows the correlation between the IC50 values of drugs from GDSC database and eccDNA abundance in DLBCL cells. (L) CCK8 detects the proliferation ability of five cell lines from H group and five cell lines from L group with the treatment of panobinostat. (M) Schematic representation of eccDNAs induced by DNA damage promoting cell proliferation by activating the STING pathway in a cGAS‐independent manner. All results are expressed as the mean ± SD of three independent experiments. p‐values were calculated by two‐tailed Student's t‐test (C, F, H–J). *p < 0.05, **p < 0.01, ***p < 0.001.

References

    1. Sehn LH, Salles G. Diffuse large B‐cell lymphoma. N Engl J Med. 2021;384(9):842‐858. doi: 10.1056/NEJMra2027612 - DOI - PMC - PubMed
    1. Wästerlid T, Harrysson S, Andersson TM, et al. Outcome and determinants of failure to complete primary R‐CHOP treatment for reasons other than non‐response among patients with diffuse large B‐cell lymphoma. Am J Hematol. 2020;95(7):740‐748. doi: 10.1002/ajh.25789 - DOI - PubMed
    1. Friedberg JW. Relapsed/refractory diffuse large B‐cell lymphoma. Hematology (Am Soc Hematol Educ Program). 2011;2011:498‐505. doi: 10.1182/asheducation-2011.1.498 - DOI - PubMed
    1. Shao R, Liu C, Xue R, et al. Tumor‐derived exosomal ENO2 modulates polarization of tumor‐associated macrophages through reprogramming glycolysis to promote progression of diffuse large B‐cell lymphoma. Int J Biol Sci. 2024;20(3):848‐863. doi: 10.7150/ijbs.91154 - DOI - PMC - PubMed
    1. Wang H, Shao R, Liu W, Tang H, Lu Y. Identification of a prognostic metabolic gene signature in diffuse large B‐cell lymphoma. J Cell Mol Med. 2021;25(14):7066‐7077. doi: 10.1111/jcmm.16720 - DOI - PMC - PubMed

MeSH terms

LinkOut - more resources