. 2024 Jan-Dec:28:23312165241266316.
doi: 10.1177/23312165241266316.

Neural Decoding of the Speech Envelope: Effects of Intelligibility and Spectral Degradation

Affiliations

Neural Decoding of the Speech Envelope: Effects of Intelligibility and Spectral Degradation

Alexis Deighton MacIntyre et al. Trends Hear. 2024 Jan-Dec.

Abstract

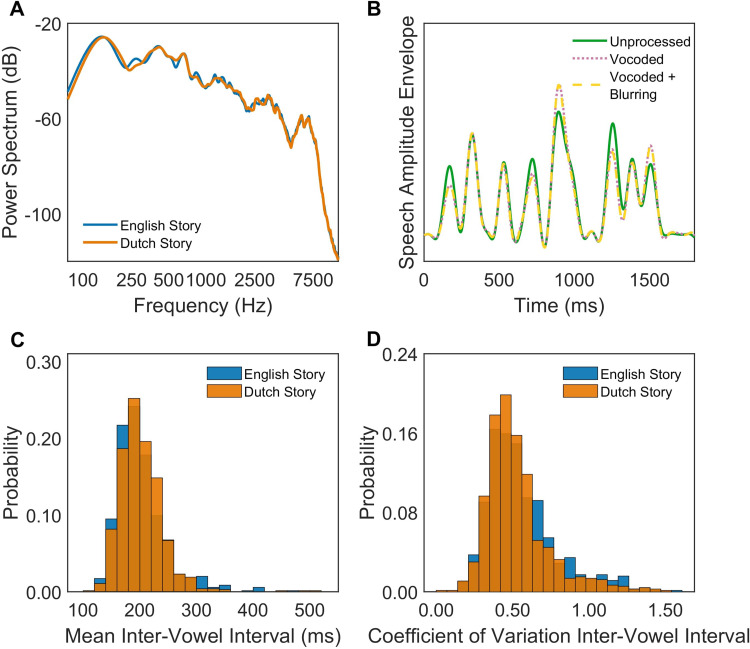
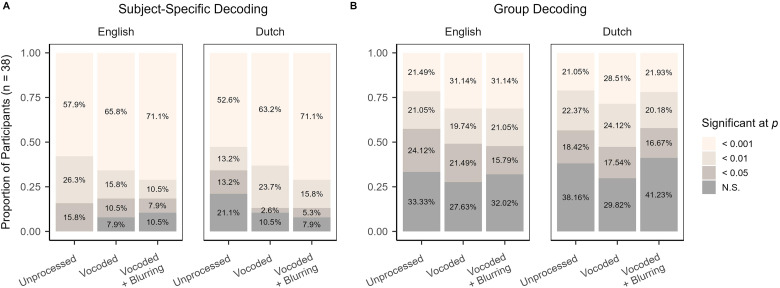
During continuous speech perception, endogenous neural activity becomes time-locked to acoustic stimulus features, such as the speech amplitude envelope. This speech-brain coupling can be decoded using non-invasive brain imaging techniques, including electroencephalography (EEG). Neural decoding may provide clinical use as an objective measure of stimulus encoding by the brain-for example during cochlear implant listening, wherein the speech signal is severely spectrally degraded. Yet, interplay between acoustic and linguistic factors may lead to top-down modulation of perception, thereby complicating audiological applications. To address this ambiguity, we assess neural decoding of the speech envelope under spectral degradation with EEG in acoustically hearing listeners (n = 38; 18-35 years old) using vocoded speech. We dissociate sensory encoding from higher-order processing by employing intelligible (English) and non-intelligible (Dutch) stimuli, with auditory attention sustained using a repeated-phrase detection task. Subject-specific and group decoders were trained to reconstruct the speech envelope from held-out EEG data, with decoder significance determined via random permutation testing. Whereas speech envelope reconstruction did not vary by spectral resolution, intelligible speech was associated with better decoding accuracy in general. Results were similar across subject-specific and group analyses, with less consistent effects of spectral degradation in group decoding. Permutation tests revealed possible differences in decoder statistical significance by experimental condition. In general, while robust neural decoding was observed at the individual and group level, variability within participants would most likely prevent the clinical use of such a measure to differentiate levels of spectral degradation and intelligibility on an individual basis.

Keywords: cochlear implants; cortical tracking; electroencephalography; objective measures; speech perception.


Conflict of interest statement

Declaration of Conflicting InterestsThe authors declared no potential conflicts of interest with respect to the research, authorship, and/or publication of this article.

Figures

Figure 1.
Figure 1.
Comparisons of English and Dutch speech stimuli. Panel A: Spectral power analysis of the English and Dutch versions of the story. Panel B: Speech amplitude envelopes extracted from unprocessed, vocoded, and vocoded + blurring listening conditions. Panel C: Histograms depicting the distributions of mean inter-vowel intervals (calculated over a 2 s-duration window) in the English and Dutch versions of the story. Panel D: Histograms depicting the distributions of coefficient of variation of inter-vowel intervals (calculated over a 2 s-duration window) in the English and Dutch versions of the story.
Figure 2.
Figure 2.
Panel A: Box plots and group mean with bootstrap 95% confidence intervals depicting self-reported ability to follow the story. Panel B: Box plots and group mean with bootstrap 95% confidence intervals depicting self-reported engagement with the story. Panel C: Dot-and-whisker plot depicting standardized estimates (regression coefficients) with 95% confidence intervals from the linear mixed effects model of mean median reaction times in the repeated-phrase target detection task. The model reference levels were English unprocessed. Panel D: Box plots and group mean with bootstrap 95% confidence intervals depicting mean median reaction time by listening condition. Significance values reflect the outcome of pairwise tests of estimated marginal means between levels of spectral degradation with Bonferroni correction.
Figure 3.
Figure 3.
Subject-specific speech decoding accuracy. Panel A: Dot-and-whisker plot depicting standardized estimates (regression coefficients) with 95% confidence intervals from the linear mixed effects model of subject-specific speech decoding accuracy. The model reference levels were English unprocessed (trained and test), with red colors depicting negative estimates, and blue, positive estimates. Panel B: Box plots and group mean with bootstrap 95% confidence intervals depicting speech decoding accuracy by trained: spectral degradation and test: spectral degradation. Data are collapsed across language conditions. Panel C: Box plots and group mean with bootstrap 95% confidence intervals depicting speech decoding accuracy by trained: language and test: language. Data are collapsed across spectral degradation conditions. Significance values reflect the outcome of pairwise tests of estimated marginal means with Bonferroni correction.
Figure 4.
Figure 4.
Same as Figure 3 but for group speech decoding accuracy.
Figure 5.
Figure 5.
Histograms depicting the scaled difference in neural decoding accuracy when subtracting group-level from subject-specific values (panel A), or when subtracting non-matched from matched training and testing listening conditions (panels B and C). Scaling is performed by dividing the resulting differences by the subject-specific (panel A) or matched training and testing (panels B and C) decoding accuracy values.
Figure 6.
Figure 6.
Bar plots indicating the significance level, determined via random permutation testing with n = 1000 iterations, at which neural decoding was decoded across listening conditions by subject-specific decoders (panel A) and group decoders (panel B). Trained and test data were from matching listening conditions.

References

    1. Aiken S. J., Picton T. W. (2008). Human cortical responses to the speech envelope. Ear and Hearing, 29(2), 139–157. 10.1097/AUD.0b013e31816453dc - DOI - PubMed
    1. Alikovic E., Ng E. H. N., Fiedler L., Santurette S., Innes-Brown H., Graversen C. (2021). Effects of hearing aid noise reduction on early and late cortical representations of competing talkers in noise. Frontiers in Neuroscience, 15, 636060. 10.3389/fnins.2021.636060 - DOI - PMC - PubMed
    1. Aljarboa G. S., Bell S. L., Simpson D. M. (2023). Detecting cortical responses to continuous running speech using EEG data from only one channel. International Journal of Audiology, 62(3), 199–208. 10.1080/14992027.2022.2035832 - DOI - PubMed
    1. Asilador A., Llano D. A. (2021). Top-down inference in the auditory system: Potential roles for corticofugal projections. Frontiers in Neural Circuits, 14, 615259. 10.3389/fncir.2020.615259 - DOI - PMC - PubMed
    1. Baltzell L. S., Horton C., Shen Y., Richards V. M., D’Zmura M., Srinivasan R. (2016). Attention selectively modulates cortical entrainment in different regions of the speech spectrum. Brain Research, 1644, 203–212. 10.1016/j.brainres.2016.05.029 - DOI - PMC - PubMed

Publication types

LinkOut - more resources