

A General Bayesian Functional Spatial Partitioning Method for Multiple Region Discovery Applied to Prostate Cancer MRI
- PMID: 39183822
- PMCID: PMC11343089
- DOI: 10.1214/23-ba1366
A General Bayesian Functional Spatial Partitioning Method for Multiple Region Discovery Applied to Prostate Cancer MRI
Abstract
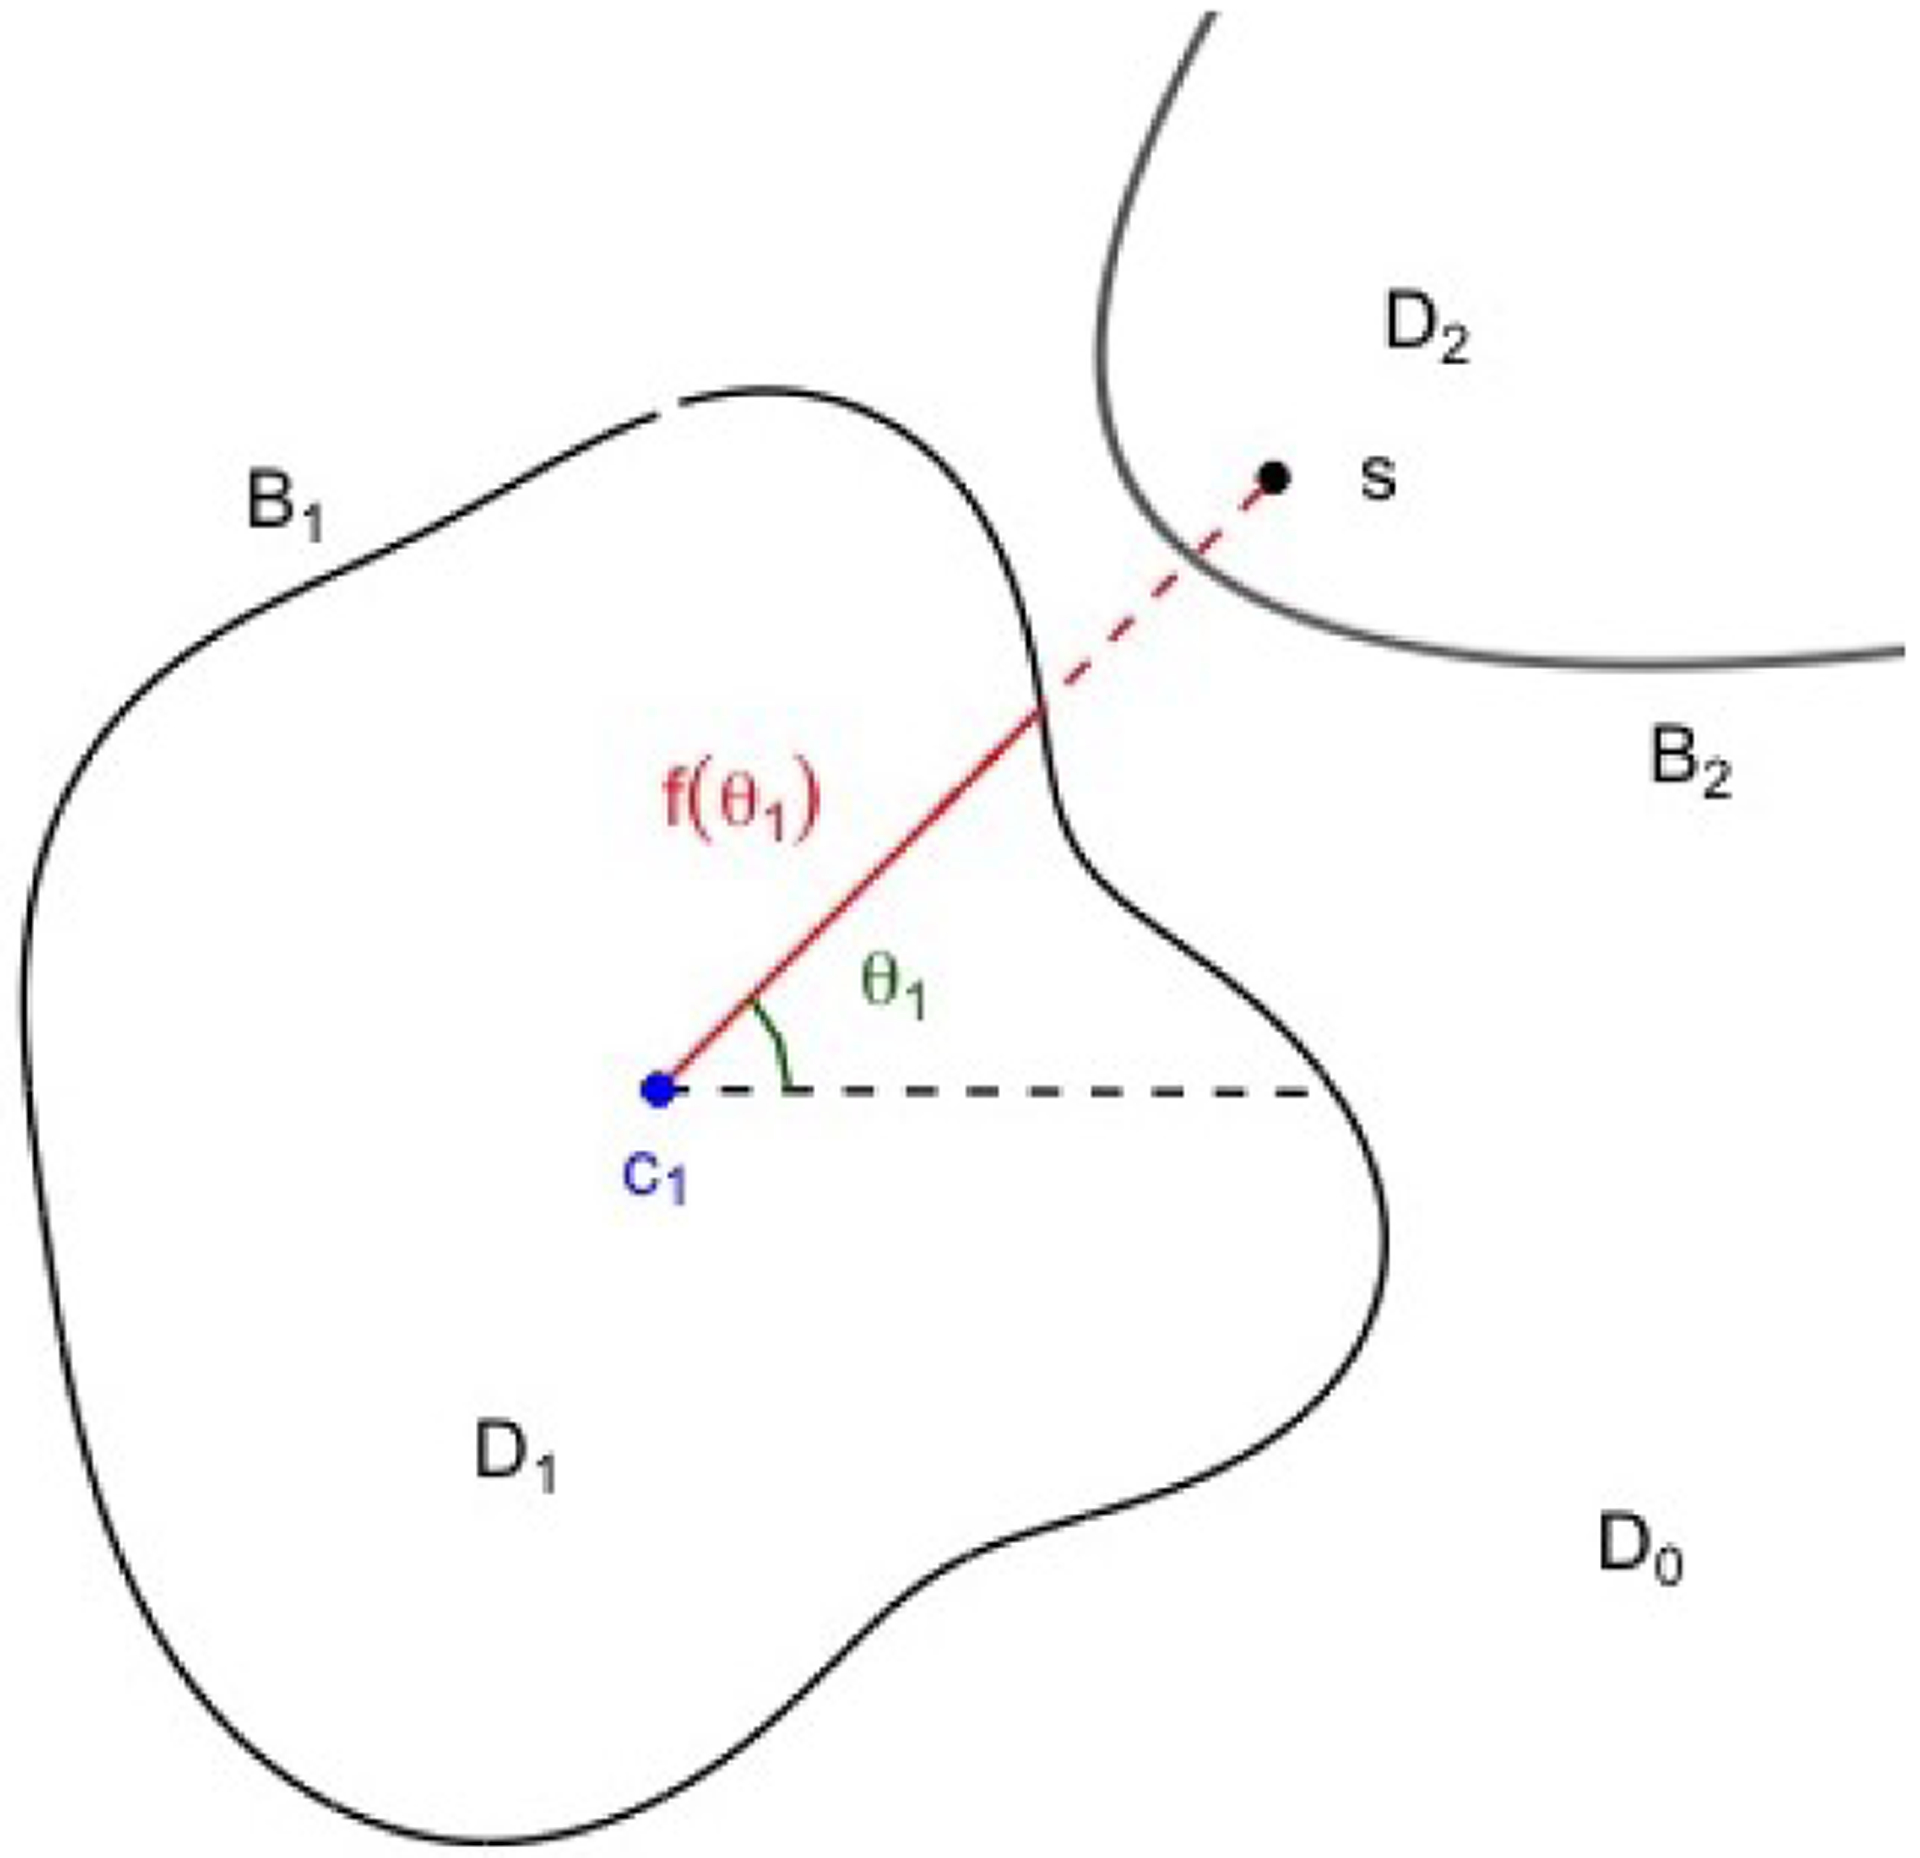
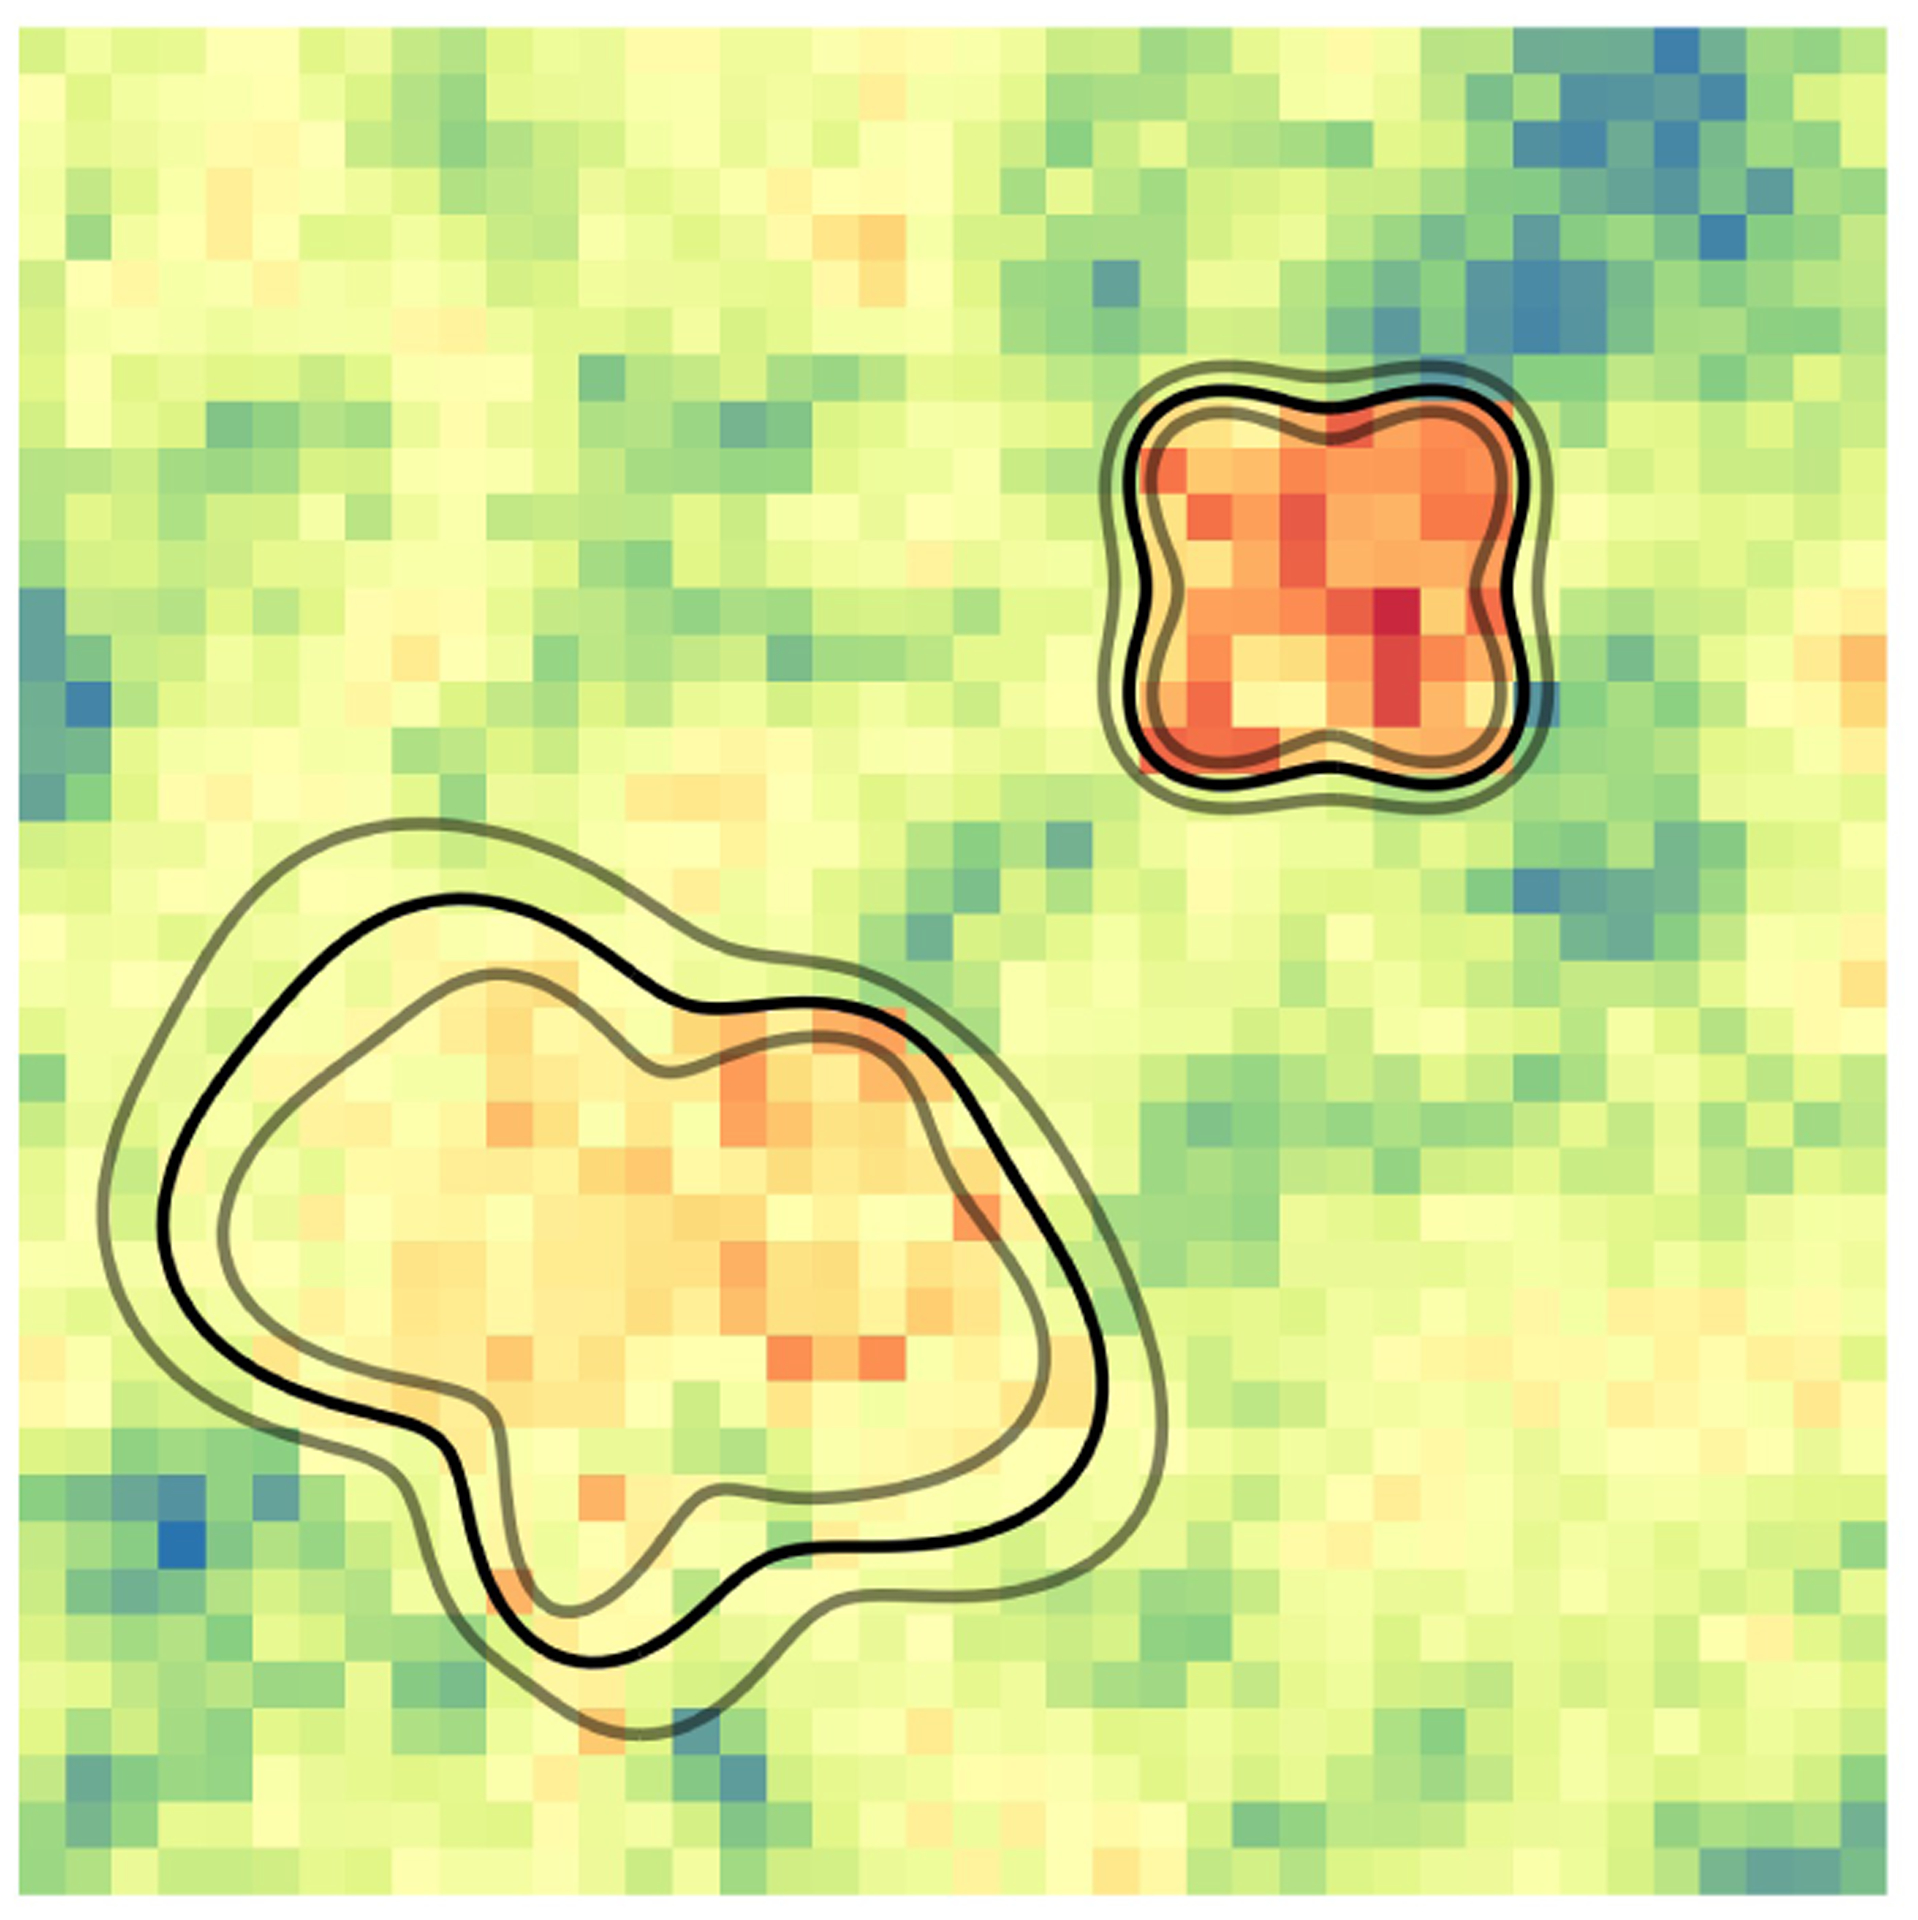
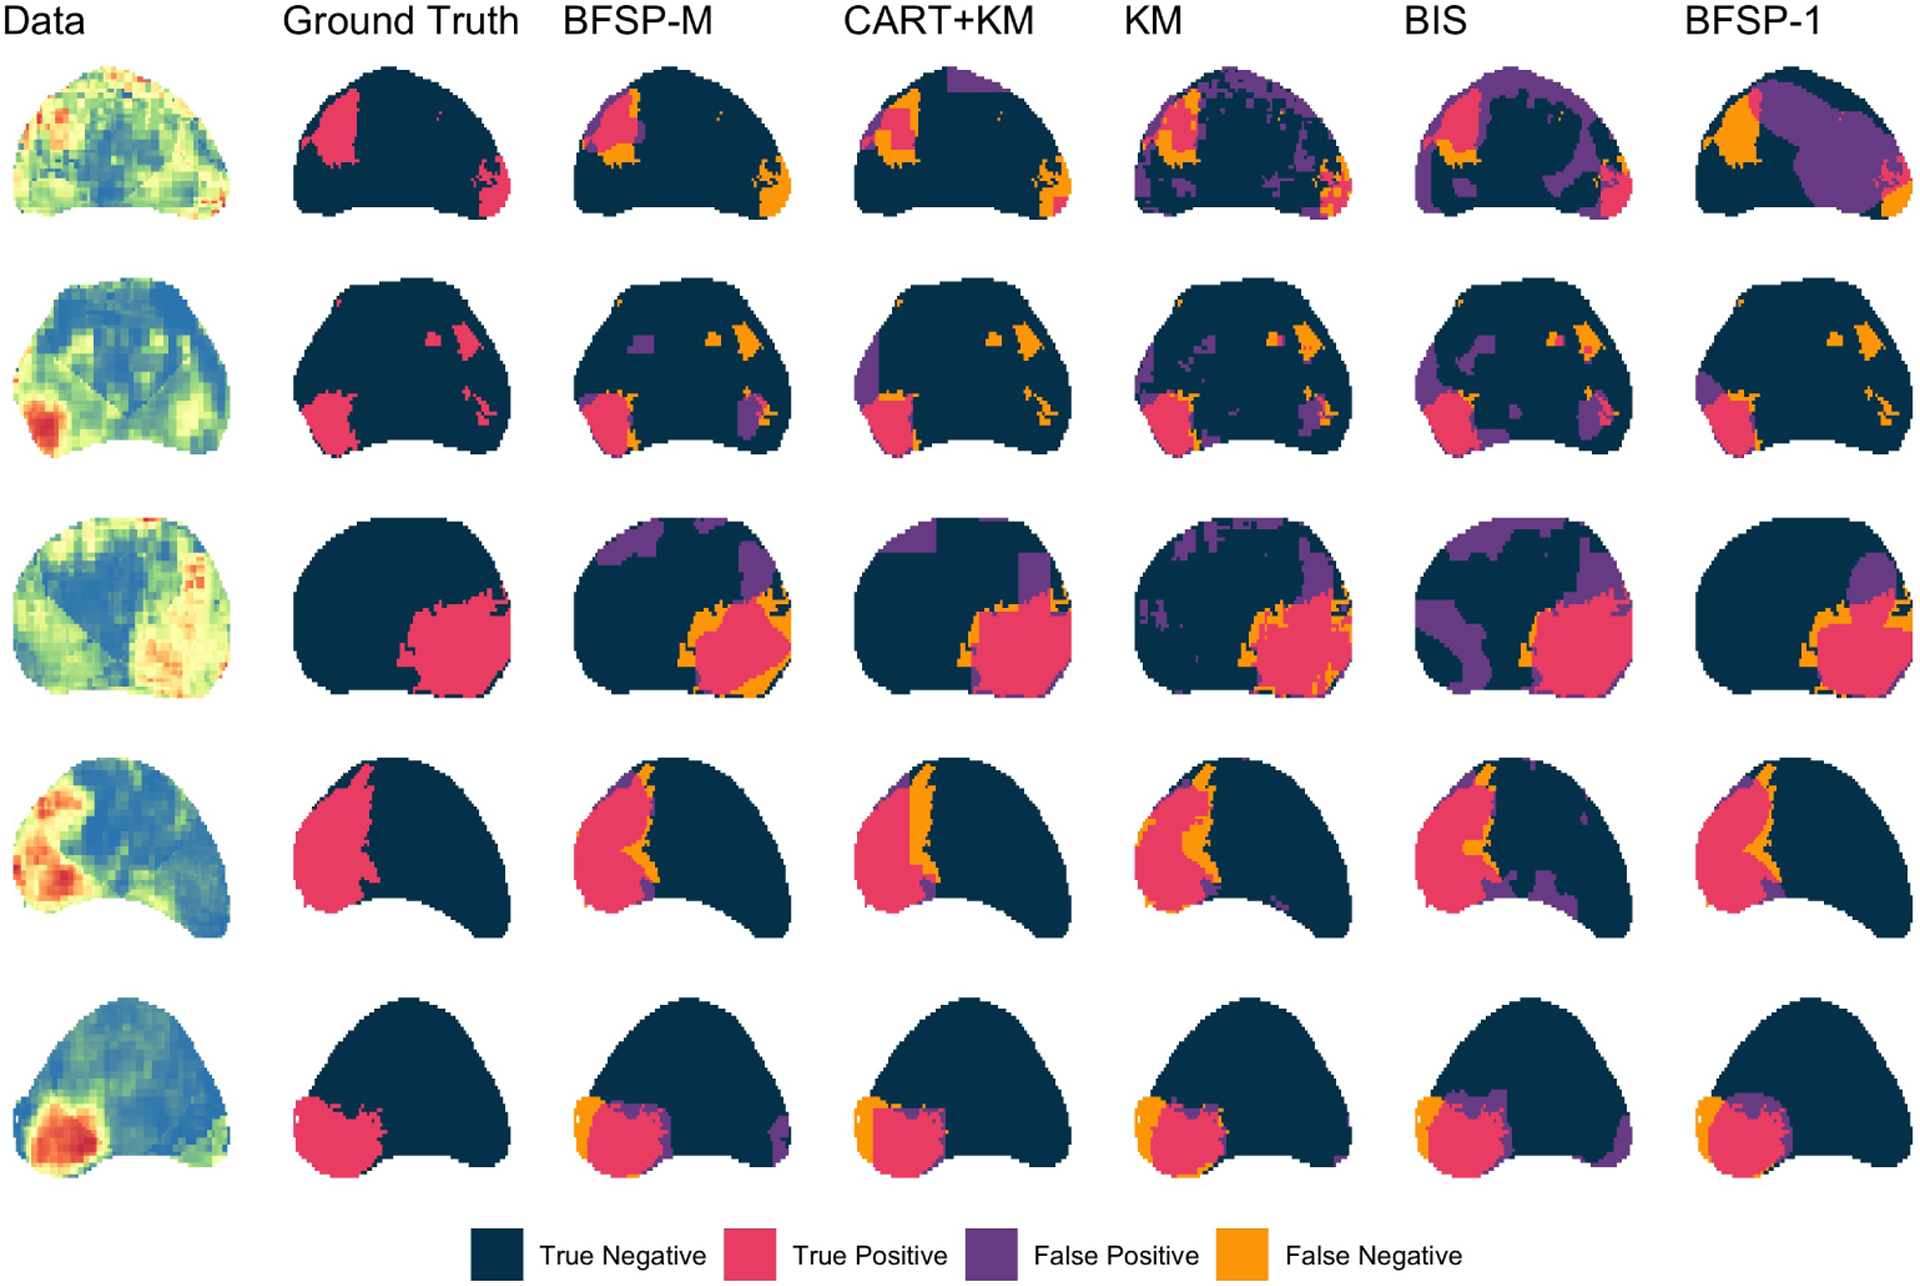
Current protocols to estimate the number, size, and location of cancerous lesions in the prostate using multiparametric magnetic resonance imaging (mpMRI) are highly dependent on reader experience and expertise. Automatic voxel-wise cancer classifiers do not directly provide estimates of number, location, and size of cancerous lesions that are clinically important. Existing spatial partitioning methods estimate linear or piecewise-linear boundaries separating regions of local stationarity in spatially registered data and are inadequate for the application of lesion detection. Frequentist segmentation and clustering methods often require pre-specification of the number of clusters and do not quantify uncertainty. Previously, we developed a novel Bayesian functional spatial partitioning method to estimate the boundary surrounding a single cancerous lesion using data derived from mpMRI. We propose a Bayesian functional spatial partitioning method for multiple lesion detection with an unknown number of lesions. Our method utilizes functional estimation to model the smooth boundary curves surrounding each cancerous lesion. In a Reversible Jump Markov Chain Monte Carlo (RJ-MCMC) framework, we develop novel jump steps to jointly estimate and quantify uncertainty in the number of lesions, their boundaries, and the spatial parameters in each lesion. Through simulation we show that our method is robust to the shape of the lesions, number of lesions, and region-specific spatial processes. We illustrate our method through the detection of prostate cancer lesions using MRI.
Keywords: Biomedical imaging; Functional estimation; Reversible Jump MCMC; Spatial partitioning; Spatial statistics.
Figures


References
-
- Ahmed HU, El-Shater Bosaily A, Brown LC, Gabe R, Kaplan R, Parmar MK, Collaco-Moraes Y, Ward K, Hindley RG, Freeman A, Kirkham AP, Oldroyd R, Parker C, and Emberton M (2017). “Diagnostic accuracy of multi-parametric MRI and TRUS biopsy in prostate cancer (PROMIS): a paired validating confirmatory study.” The Lancet, 389(10071): 815–822. URL 10.1016/S0140-6736(16)32401-1 - DOI - PubMed
-
- Argiento R and De Iorio M (2022). “Is infinity that far? A Bayesian nonparametric perspective of finite mixture models.” The Annals of Statistics, 50(5).
-
- Banerjee S, Carlin BP, and Gelfand AE (2014). Hierarchical modeling and analysis for spatial data. Boca Raton, Florida: CRC press.
-
- Breiman L, Friedman J, Stone CJ, and Olshen RA (1984). Classification and regression trees. Boca Raton, Florida: Chapman & Hall/CRC.
-
- Chipman HA, George EI, and McCulloch RE (2002). “Bayesian Treed Models.” Machine Learning, 48(1/3): 299–320.
Grants and funding
LinkOut - more resources
Full Text Sources