

Exploring the association between ambient air pollution and COVID-19 risk: A comprehensive meta-analysis with meta-regression modelling
- PMID: 39183866
- PMCID: PMC11341291
- DOI: 10.1016/j.heliyon.2024.e32385
Exploring the association between ambient air pollution and COVID-19 risk: A comprehensive meta-analysis with meta-regression modelling
Abstract
Introduction: Air pollution is speculated to increase the risk of Coronavirus disease-2019 (COVID-19). Nevertheless, the results remain inconsistent and inconclusive. This study aimed to explore the association between ambient air pollution (AAP) and COVID-19 risks using a meta-analysis with meta-regression modelling.
Methods: The inclusion criteria were: original studies quantifying the association using effect sizes and 95 % confidence intervals (CIs); time-series, cohort, ecological or case-crossover peer-reviewed studies in English. Exclusion criteria encompassed non-original studies, animal studies, and data with common errors. PubMed, Web of Science, Embase and Google Scholar electronic databases were systemically searched for eligible literature, up to 31, March 2023. The risk of bias (ROB) was assessed following the Agency for Healthcare Research and Quality parameters. A random-effects model was used to calculate pooled risk ratios (RRs) and their 95 % CIs.
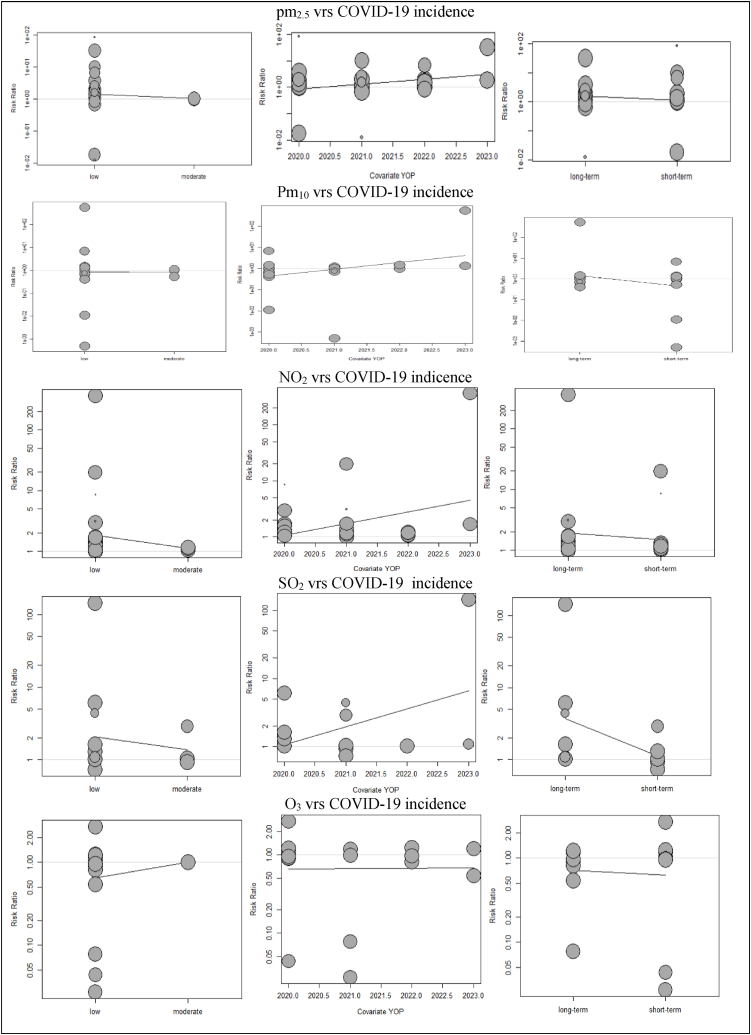
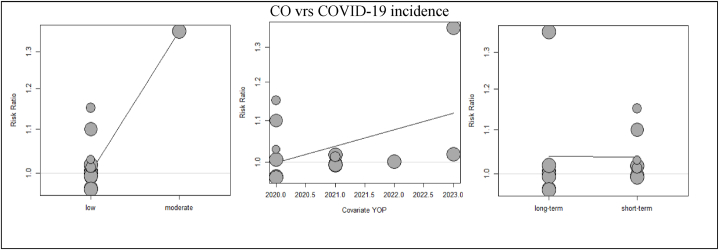
Results: A total of 58 studies, between 2020 and 2023, met the inclusion criteria. The global representation was skewed, with major contributions from the USA (24.1 %) and China (22.4 %). The distribution included studies on short-term (43.1 %) and long-term (56.9 %) air pollution exposure. Ecological studies constituted 51.7 %, time-series-27.6 %, cohorts-17.2 %, and case crossover-3.4 %. ROB assessment showed low (86.2 %) and moderate (13.8 %) risk. The COVID-19 incidences increased with a 10 μg/m3 increase in PM2.5 [RR = 4.9045; 95 % CI (4.1548-5.7895)], PM10 [RR = 2.9427: (2.2290-3.8850)], NO2 [RR = 3.2750: (3.1420-3.4136)], SO2 [RR = 3.3400: (2.7931-3.9940)], CO [RR = 2.6244: (2.5208-2.7322)] and O3 [RR = 2.4008: (2.1859-2.6368)] concentrations. A 10 μg/m3 increase in concentrations of PM2.5 [RR = 3.0418: (2.7344-3.3838)], PM10 [RR = 2.6202: (2.1602-3.1781)], NO2 [RR = 3.2226: (2.1411-4.8504)], CO [RR = 1.8021 (0.8045-4.0370)] and O3 [RR = 2.3270 (1.5906-3.4045)] was significantly associated with COVID-19 mortality. Stratified analysis showed that study design, exposure period, and country influenced exposure-response associations. Meta-regression model indicated significant predictors for air pollution-COVID-19 incidence associations.
Conclusion: The study, while robust, lacks causality demonstration and focuses only on the USA and China, limiting its generalizability. Regardless, the study provides a strong evidence base for air pollution-COVID-19-risks associations, offering valuable insights for intervention measures for COVID-19.
Keywords: Air pollution; COVID-19; Effect estimates; Meta-analysis; Meta-regression.
© 2024 Published by Elsevier Ltd.
Conflict of interest statement
The authors declare that they have no known competing financial interests or personal relationships that could have appeared to influence the work reported in this paper.
Figures


References
-
- Das K., Behera R.L., Paital B. COVID-19 in the Environment. Elsevier; 2022. Socio-economic impact of COVID-19; pp. 153–190.
LinkOut - more resources
Full Text Sources
Miscellaneous
