. 2024 Mar;3(3):343-355.
doi: 10.1038/s44161-024-00441-z. Epub 2024 Mar 8.

Disruption of the Uty epigenetic regulator locus in hematopoietic cells phenocopies the profibrotic attributes of Y chromosome loss in heart failure

Affiliations

Disruption of the Uty epigenetic regulator locus in hematopoietic cells phenocopies the profibrotic attributes of Y chromosome loss in heart failure

Keita Horitani et al. Nat Cardiovasc Res. 2024 Mar.

Abstract

Heart failure affects millions of people worldwide, with men exhibiting a higher incidence than women. Our previous work has shown that mosaic loss of the Y chromosome (LOY) in leukocytes is causally associated with an increased risk for heart failure. Here, we show that LOY macrophages from the failing hearts of humans with dilated cardiomyopathy exhibit widespread changes in gene expression that correlate with cardiac fibroblast activation. Moreover, we identify the ubiquitously transcribed t et ratricopeptide Y-linked (Uty) gene in leukocytes as a causal locus for an accelerated progression of heart failure in male mice with LOY. We demonstrate that Uty disruption leads to epigenetic alterations in both monocytes and macrophages, increasing the propensity of differentiation into profibrotic macrophages. Treatment with a transforming growth factor-β-neutralizing antibody prevented the cardiac pathology associated with Uty deficiency in leukocytes. These findings shed light on the mechanisms that contribute to the higher incidence of heart failure in men.


Conflict of interest statement

Competing interests The authors declare no competing interests.

Figures

Extended Data Fig. 1 |
Extended Data Fig. 1 |. Hematopoietic LOY in human dilated cardiomyopathy scRNA-Seq datasets.
a. UMAP dimensionality reduction of annotated cardiac cells from integrated scRNA-Seq datasets (Koenig NCVR 2022, Rao BRC 2021, Chaffin Nature 2022). b. Expression of cell type-specific genes used for annotation. c. UMAP of annotated cardiac leukocytes. d. Expression of cell type-specific genes used for annotation. e. Total number of control and LOY leukocytes within each leukocyte subtype (gray = control, red = LOY). f. UMAP of annotated cardiac fibroblasts with expression of cell type-specific genes used for myofibroblast annotation. g. Linear correlation of myofibroblast percentage within each patient and LOY percentage within each patient, presented by disease.
Extended Data Fig. 2 |
Extended Data Fig. 2 |. Hematopoietic cells with Y chromosome gene deficiency do not display fitness advantage in vivo.
Mice underwent partial (50%) bone marrow reconstitution with XY* and XY*X cells following lethal irradiation. After 4 weeks and 8 weeks of recovery, flow cytometric analysis of peripheral blood was performed. (XY* n = 7, XY*X n = 7). Data are presented as mean values +/− SEM. WBC; white blood cells.
Extended Data Fig. 3 |
Extended Data Fig. 3 |. Hematopoietic LOY in human healthy cardiac scRNA-Seq datasets.
a. UMAP dimensionality reduction of annotated cardiac cells from integrated scRNA-Seq datasets of healthy male patients. b-c. Expression of markers for immune cells (PTPRC), monocytes/macrophages (CD68, CD14), and Y chromosome genes (UTY, DDX3Y, KDM5D), visualized on (B) UMAP dimensionality reduction plots, and (C) relative expression between cell types.
Extended Data Fig. 4 |
Extended Data Fig. 4 |. CRISPR/Cas9-mediated gene disruption of Y chromosome genes in bone marrow lineage-negative cells.
a. Gating strategy used for the Fluorescence-Activated Cell Sorting (FACS) of peripheral blood cells. Cells transduced with lentivirus transduced cells are designed to express turbo red fluorescent protein (tRFP). b-e. The results of Tracking of Indels by Decomposition (TIDE) analysis of sorted cells revealed the presence of multiple insertions and deletions in Ddx3y (b), Uty (c), Kdm5d (d), Eif2s3y (e) genes. f. Percentage of tRFP-positive cells in blood following BMT in the different gene-editing screens (n = 10 for all conditions, statistical analysis by Student’s t test). Data are presented as mean values +/− SEM.
Extended Data Fig. 5 |
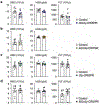
Extended Data Fig. 5 |. Hematopoietic parameters remain unaffected by CRISPR/Cas9-mediated disruption of hematopoietic Y chromosome genes (Ddx3y, Kdm5d, Uty, Eif2s3y).
White blood cell count, hemoglobin concentration, and platelet count were assessed at 4 months (a, b, d) and 1 month (c) post-bone marrow transplant (n$=$10 for all conditions). Data are presented as mean values +/− SEM. WBC; white blood cell, HGB; hemoglobin, PLT; platelet.
Extended Data Fig. 6 |
Extended Data Fig. 6 |. CRISPR/Cas9-mediated disruption of hematopoietic Eif2s3y, Ddx3y, or Kdm5d genes do not promote cardiac dysfunction after TAC.
a, c and e. Sequential echocardiographic analysis of KO mice and control mice after TAC at the indicated time points (a: control, n = 6; Eif2s3y-KO, n = 6, c: control n = 10, Ddx3y-KO n = 8, e: control n = 25, Kdm5d-KO n = 23). b, d and f. Heart weight (HW) and lung weight (LW) relative to tibia length (TL) at 28 days after TAC procedure (b-HW/TL; control, n = 5; Eif2s3y-KO, n = 6, b-LW/TL; control, n = 5; Eif2s3y-KO, n = 6, d-HW/TL: control n = 9, Ddx3y-KO n = 8, d-LW/TL: control n = 8, Ddx3y-KO n = 8, f-HW/TL: control n = 24, Kdm5d-KO n = 21, f-LW/TL: control n = 7, Kdm5d-KO n = 7). Data are presented as mean values +/− SEM.
Extended Data Fig. 7 |
Extended Data Fig. 7 |. Uty expression and X chromosome paralogs in hematopoietic cells of UtyGT mice.
a. Transcript levels of Uty in total bone marrow cells (BM, wild-type n = 3, UtyGT n = 3, Student’s t test) and whole peripheral blood cells (PB, wild-type n = 5, UtyGT n = 5, Student’s t test). b. Transcript levels of Utx, Ddx3x, Eif2s3x, and Kdm5c in BM cells (n = 3 for all conditions). After TAC, lung weight, body weight and blood cell counts in wild-type mice and UtyGT mice were determined. c. Lung weight relative to tibial length at 0 and 28 days after TAC procedure. (Day 0: wild-type n = 5, UtyGT n = 5, Day 28: wild-type n = 10, UtyGT n = 10). d. Body weight over the time course after TAC (wild-type n = 10, UtyGT n = 10). LW; lung weight, TL: tibial length, BW; body weight. e. Flow cytometry was performed at baseline and 1 month post-TAC to determine cell counts in peripheral blood (Pre: Control n = 9, UtyGT n = 9, 1 M after TAC: Control n = 8, UtyGT n = 6, statistical analysis by two-way ANOVA post hoc Tukey). Data are presented as mean values +/− SEM, p-values: N.S.=not significant, *<0.05, **<0.01. BM; bone marrow, PB; peripheral blood; WBC; white blood cells.
Extended Data Fig. 8 |
Extended Data Fig. 8 |. Transgenic-mediated Ddx3y-KO of hematopoietic cells does not promote cardiac dysfunction after TAC.
a. Schematic of experimental procedure. b. Transcript levels of the Y chromosome genes (Eif2s3y, Ddx3y, Kdm5d, Uty) in bone marrow cells (wild-type n = 3, Ddx3y-KO n = 3). c. Transcript levels of the X chromosome gene homologues (Eif2s3x, Ddx3x, Kdm5c, Utx) in white blood cells isolated from bone marrow from either group of mice (wild-type n = 3, Ddx3y-KO n = 3). d. Sequential echocardiographic analysis of mice transplanted with wild-type or Ddx3y-KO cells. Repeated measurement was performed at the indicated time points after TAC operation (wild-type, n = 10; Ddx3y-KO, n = 8). e. Heart weight (HW) and lung weight (LW) relative to tibial length (TL) at 4 weeks after TAC procedure (HW/TL; control, n = 10; Ddx3y-KO, n = 8, LW/TL; wild-type, n = 10; Ddx3y-KO, n = 8). f. Transcript levels of heart failure markers in heart tissue at four weeks after TAC operation (wild-type, n = 10; Ddx3y-KO, n = 8). Statistical analyses were performed using 2-way ANOVA with Sidak’s multiple comparison tests d. and two-sided unpaired Student’s t test (b, c, e, f). TAC; transverse aortic constriction, FS; fractional shortening, LVPWTd; left ventricular posterior wall thickness at end-diastole, LVDs; left ventricular diameter at end-systole, LVDd; left ventricular diameter at end-diastole. Dots in all panels represent individual samples. Data are shown as mean ± SEM.
Extended Data Fig. 9 |
Extended Data Fig. 9 |. Multi-modal single-cell omics of recruited UtyGT cardiac leukocytes.
a. Quality control metrics for single cell muiltiomics dataset: RNA reads per cell (nCount_RNA), ATAC reads per cell (nCount_ATAC), quantified peaks per cell (nCount_peaks), enrichment of ATAC reads near transcriptional start sites (TSS Enrichment), nucleosome banding pattern (nucleosome_signal) (box plots: min 25%, max 75%, middle median, whiskers 5%−95%, Control n = 8156, UtyGT n = 9169). b. DNA accessibility coverage plot for the Uty locus in Control and UTYGT samples showing ATAC reads and calculated peaks. c. Expression of known genes that are enriched in specific leukocyte cell types used to annotate clusters of single cells within the single-cell multiomics dataset. d. UMAP dimensionality reduction of wild-type and UtyGT cardiac leukocytes based on differential chromatin availability around genes. e. Scoring of each cell on increased chromatin availability around genes associated with fibrotic macrophages (Fibrotic Score) or inflammatory macrophages (Inflammatory Score), plotted by UMAP position.
Extended Data Fig. 10 |
Extended Data Fig. 10 |. Abundance of monocytes and macrophages in the hearts from control and UtyGT mice after TAC.
a. Relative abundance of monocytes and macrophages in datasets from control and UtyGT hearts quantified by percentage of total cell number. b. Flow cytometric analysis of macrophage counts in heart tissue 28 days after TAC. The absolute numbers of cells were normalized by tissue weight (Sham: wild-type n = 5, UtyGT n = 5; TAC: wild-type n = 5, UtyGT n = 5, data are presented as mean values +/− SEM, two-way ANOVA post hoc Tukey, p-value: **<0.01, ***<0.001, ****<0.0001). c. Variation in expression of each gene between Control and UtyGT monocytes and macrophages plotted as -Log10(p-value) versus Log2(Fold Change) (Wilcoxon Rank Sum statistical test). d, e. Gene Ontology terms significantly enriched in significant differentially expressed genes monocytes and macrophages (d: enriched in UtyGT cells, e: enriched in Control cells).
Fig. 1 |
Fig. 1 |. Hematopoietic LOY in human DCM scRNA-Seq datasets.
a, UMAP dimensionality reduction of annotated cardiac leukocytes from integrated scRNA-Seq datasets from male patients with DCM. b, Distribution of LOY cells within cardiac leukocyte cell types. c, Percentages of significant autosomal genes (9.45%, green), significant Y genes (0.05%, blue), significant X genes (0.28%, pink) and nonsignificant genes (90.22%, gray) over the total expressed genes. d, Variation in the expression of each gene between control and LOY cardiac macrophages plotted as −log10(P value) versus log2(fold change) (Wilcoxon rank-sum statistical test). e, Comparison of the fibroblast activation genes POSTN, ACTA2, COL1A1 and COL3A1 in fibroblasts between healthy patients and patients with DCM (data show the mean normalized RNA expression, with error bars representing the s.d.; two-way ANOVA post hoc Sidak: *P < 0.05, ****P < 0.0001). f, Linear correlation of the average expression of fibroblast activation genes and the LOY percentage within each patient (simple linear regression statistical test). g, Gene Ontology terms significantly enriched in significant differentially expressed genes in control versus LOY macrophages of patients with DCM (Fisher’s exact statistical test).
Fig. 2 |
Fig. 2 |. Deficiency of Y chromosome genes in hematopoietic cells exacerbates cardiac dysfunction in response to pressure overload.
a, Illustration of structural differences in the Y chromosome among normal male Y mice, XY* mice and XY*X mice. The ABC portions of the chromosomes are in the PAR. b, Transcript levels of the Y chromosome genes Eif2s3y, Ddx3y, Kdm5d and Uty in white blood cells isolated from the bone marrow of either group of mice (XY* n = 4, XY*X n = 4; Student’s t test). c, Transcript levels of the X chromosome gene homologs (Eif2s3x, Ddx3x, Kdm5c, Utx) in white blood cells isolated from the bone marrow of either group of mice (XY* n = 4, XY*X n = 4). d, Schematic illustration of the phenotypic study of Y*X mice in a pressure overload model: lethally irradiated wild-type mice were transplanted with bone marrow cells from either Y* or Y*X mice and subjected to TAC surgery at 6 weeks after BMT. e, Sequential echocardiographic analysis of Y* and Y*X mice before and after TAC surgery at the indicated time points (XY* n = 14, XY*X n = 11; two-way ANOVA post hoc Tukey). f, Heart weight and lung weight relative to tibia length at 4 weeks after the TAC procedure (XY* n = 13, XY*X n = 11; statistical tests: Student’s t test (heart weight/tibia length), Mann–Whitney U test (lung weight/tibia length)). g, Transcript levels of heart failure markers (Nppa and Mhc b/a) in heart tissues at 28 days after TAC surgery (XY* n = 9, XY*X n = 7; Mann–Whitney U statistical test). h, Quantitative analysis of the fibrotic area in heart sections at 4 weeks after TAC surgery (scale bars, 500 μm; XY* n = 9, XY*X n = 7; Student’s t test). Data are presented as mean values ± s.e.m. *P < 0.05, **P < 0.01, ****P < 0.0001. FS, fractional shortening; LVPWTd, left ventricular posterior wall thickness at end-diastole; LVDs, left ventricular diameter at end-systole; LVDd, left ventricular diameter at end-diastole; HW, heart weight; LW, lung weight; TL, tibia length; X-cen, X centromere; Y-cen, Y centromere; NPY, non-PAR of the Y chromosome.
Fig. 3 |
Fig. 3 |. Hematopoietic Uty is a potential gene candidate that contributes to LOY-mediated deterioration of cardiac function.
a, Study schematic: lethally irradiated male C57BL/6J mice were reconstituted with hematopoietic lineage-negative cells transduced with a lentivirus encoding the Y chromosome gene-targeting Uty gRNA or control gRNA, with analysis of cardiac phenotypes between knockout mice and control mice after TAC surgery. b, Heart weight and lung weight relative to tibia length at 28 days after the TAC procedure (heart weight/tibia length and lung weight/tibia length: control n = 10, UtyGT n = 10; Student’s t test). c, Sequential echocardiographic analysis of knockout mice and control mice after TAC at the indicated time points (control n = 10, UtyGT n = 10; two-way repeated-measures ANOVA post hoc Sidak). d, Generation of CRISPR/Cas9-free hematopoietic Uty-disrupted mice with preserved cardiac microenvironment: male C57BL/6 CD45.1 (Pepboy) mice were lethally irradiated (with chest shielding) and reconstituted with bone marrow cells collected from UtyGT transgenic (CD45.2) or wild-type (CD45.2) mice. e, Transcript levels of Uty in bone marrow-derived macrophages (wild-type n = 5, UtyGT n = 4). f, Heart weight relative to tibia length at 0 and 28 days after the TAC procedure (day 0: wild-type n = 5, UtyGT n = 5, day 28: wild-type n = 8, UtyGT n = 9; two-way ANOVA post hoc Tukey). g, Sequential echocardiographic analysis of mice transplanted with wild-type or UtyGT cells. Repeated measurement was performed at the indicated time points after TAC (wild-type n = 9, UtyGT n = 7; two-way repeated-measures ANOVA post hoc Sidak). Data are presented as mean values ± s.e.m. *P < 0.05, **P < 0.01, ***P < 0.001, ****P < 0.0001. Lin, lineage; KO, knockout; BMDM, bone marrow-derived macrophage.
Fig. 4 |
Fig. 4 |. Uty disruption in hematopoietic cells accelerates cardiac dysfunction in response to pressure overload.
a, Transcript levels of heart failure markers in heart tissue at 28 days after TAC surgery (wild-type n = 9, UtyGT n = 8; Student’s t test). b, Transcript levels of fibrosis markers in heart tissue at 28 days after TAC surgery (wild-type n = 9, UtyGT n = 8; Student’s t test). c, Flow cytometric analysis of fibroblast counts in heart tissue at 0 and 28 days after TAC. The absolute numbers of cells were normalized by tissue weight (day 0: wild-type n = 5, UtyGT n = 5, day 28: wild-type n = 7, UtyGT n = 8; two-way ANOVA post hoc Tukey). d, Quantitative analysis of the fibrotic area in heart sections at 28 days after the TAC operation (scale bars, 1,000 μm; wild-type n = 6, UtyGT n = 8; Mann–Whitney U test). e, Flow cytometric analysis of endothelial cell counts in heart tissue at 0 and 28 days after the TAC operation. The absolute numbers of cells were normalized by tissue weight (day 0: wild-type n = 5, UtyGT n = 5, day 28: wild-type n = 5, UtyGT n = 5; two-way ANOVA post hoc Tukey). Data are presented as mean values ± s.e.m. *P < 0.05, **P < 0.01, ****P < 0.0001.
Fig. 5 |
Fig. 5 |. Multimodal single-cell analysis reveals the profibrotic chromatin accessibility signatures of recruited UtyGT cardiac monocytes and macrophages.
a, Schematic of the experimental procedure. b, UMAP dimensionality reduction based on differential chromatin availability around genes, with all analyzed single cells grouped by annotated cell type. c, Chromatin availability around genes associated with fibrotic and inflammatory macrophage transcriptional signatures during myocardial remodeling, quantified in monocytes and macrophages and compared between control (gray) and UtyGT (red) hearts (center line, median; box limits, first and third quartiles; whiskers, 10–90% of data; n = 580 control monocytes versus 865 UtyGT monocytes and 1,404 control macrophages versus 4,716 UtyGT macrophages; one-way ANOVA post hoc Tukey: NS, not significant, *P < 0.05, ****P < 0.0001). d, Analysis of differential gene availability by chromatin accessibility near genes in monocytes and macrophages, with significantly enriched genes in control (gray) and UtyGT (red) cardiac monocytes and macrophages presented as a volcano plot. e, Fold enrichment of Gene Ontology terms within gene sets enriched in UtyGT (red) and control (gray) cardiac monocytes and macrophages. f, Analysis of the differential localization of chromatin peaks in monocytes and macrophages enriched in control (gray) and UtyGT (red) hearts, presented as a volcano plot (Wilcoxon rank-sum statistical test). g, Motif analysis of the transcription factor-binding sequences of significantly enriched peaks in control (gray) or UtyGT (red) hearts, with the transcription factors associated with fibrotic and inflammatory macrophages presented with the DNA-binding motif and as the fold enrichment of the DNA-binding motifs, with the P values listed (Fisher’s exact statistical test). Mono, monocyte; DC, dendritic cell; B, B cell; Neut, neutrophil; Mac, macrophage; Baso, basophil; T, T cell; NK, natural killer cell; CT, control.
Fig. 6 |
Fig. 6 |. Inhibition of TGFβ reverses cardiac dysfunction after TAC in mice with hematopoietic Uty deficiency.
a, Schematic of the experimental procedure. b, Sequential echocardiographic analysis of UtyGT and control mice after TAC at the indicated time points. At 8 weeks after BMT, mice were subjected to TAC. An anti-TGFβ antibody or isotype control was intraperitoneally injected every 3 days over the experimental time of 28 days after TAC (n = 10 per experimental group). c, Serum BNP levels at 28 days after TAC (n = 5 per experimental group). d, Heart weight and lung weight relative to tibia length at 28 days after TAC (n = 10 per experimental group). e, Quantitative analysis of flow cytometric data of fibroblast (left) and endothelial cell (right) counts in heart tissue at 28 days after TAC. The absolute numbers of cells were normalized by tissue weight (n = 10 per experimental group). Data are presented as mean values ± s.e.m. Statistical analysis was performed by two-way ANOVA with post hoc Tukey’s test. *P < 0.05, **P < 0.01, ***P < 0.001, ****P < 0.0001. ab, antibody.

References

    1. Thompson DJ et al. Genetic predisposition to mosaic Y chromosome loss in blood. Nature 575, 652–657 (2019). - PMC - PubMed
    1. Jacobs PA et al. Change of human chromosome count distributions with age: evidence for a sex difference. Nature 197, 1080–1081 (1963). - PubMed
    1. Pierre RV & Hoagland HC Age-associated aneuploidy: loss of Y chromosome from human bone marrow cells with aging. Cancer 30, 889–894 (1972). - PubMed
    1. Colaco S. & Modi D. Genetics of the human Y chromosome and its association with male infertility. Reprod. Biol. Endocrinol. 16, 14 (2018). - PMC - PubMed
    1. Forsberg LA et al. Mosaic loss of chromosome Y in peripheral blood is associated with shorter survival and higher risk of cancer. Nat. Genet. 46, 624–628 (2014). - PMC - PubMed

Publication types

Substances