. 2024 Mar;3(3):372-388.
doi: 10.1038/s44161-024-00450-y. Epub 2024 Mar 11.

Identification of FDA-approved drugs that induce heart regeneration in mammals

Affiliations

Identification of FDA-approved drugs that induce heart regeneration in mammals

Mahmoud Salama Ahmed et al. Nat Cardiovasc Res. 2024 Mar.

Abstract

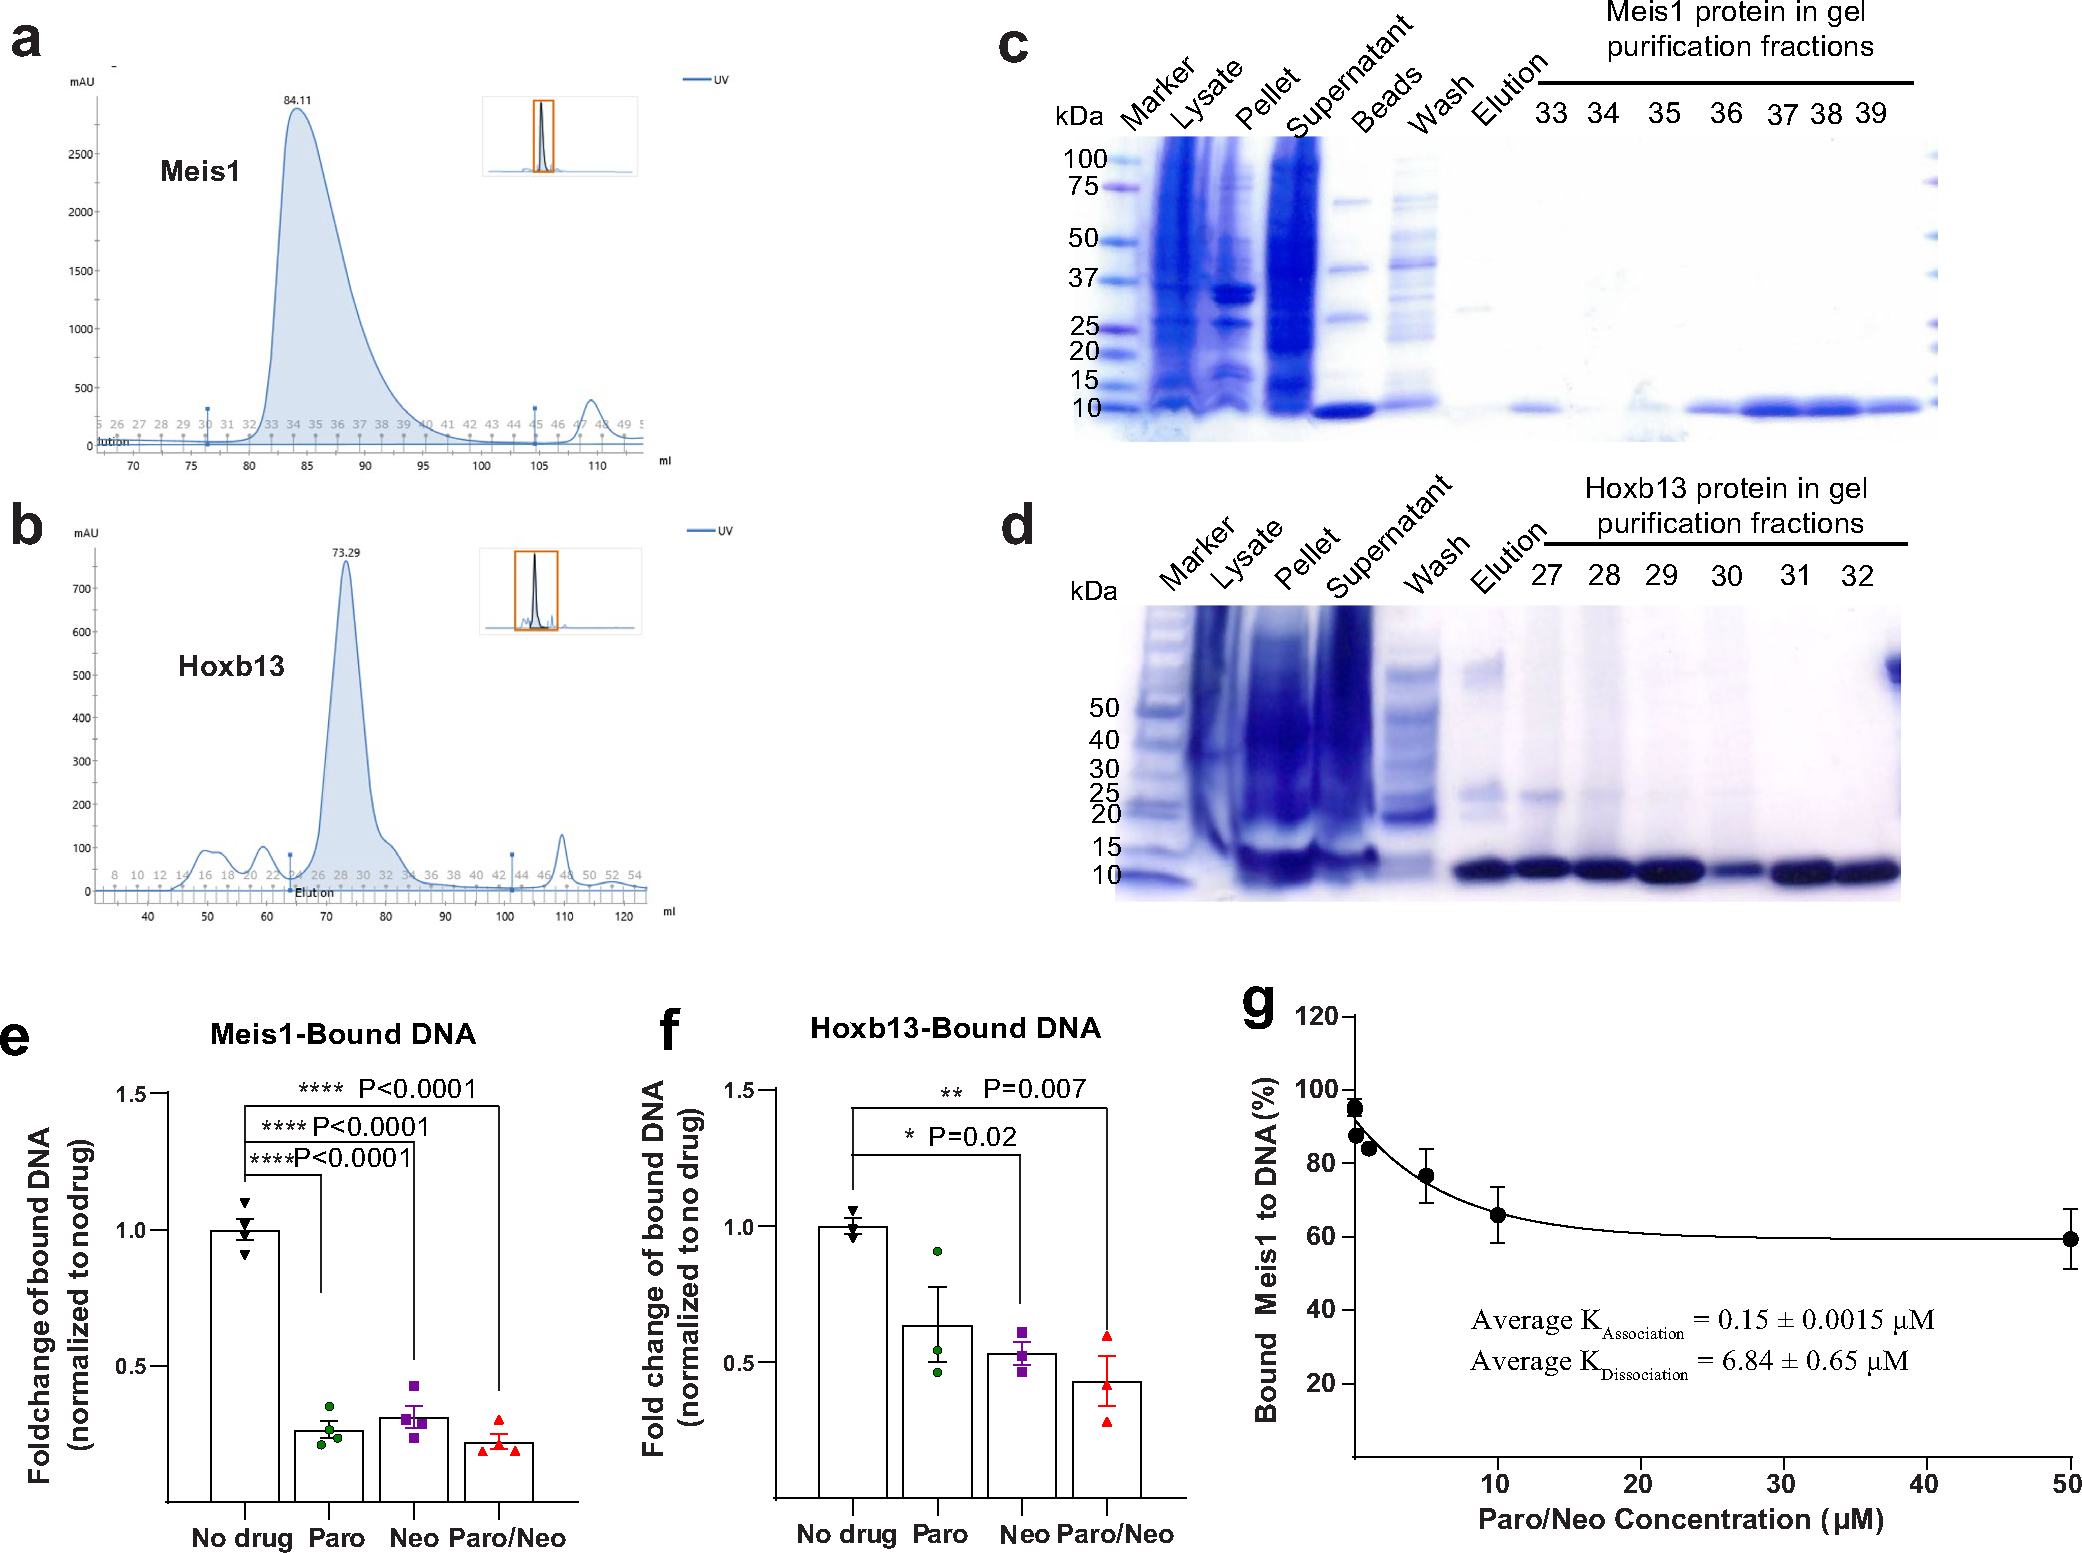
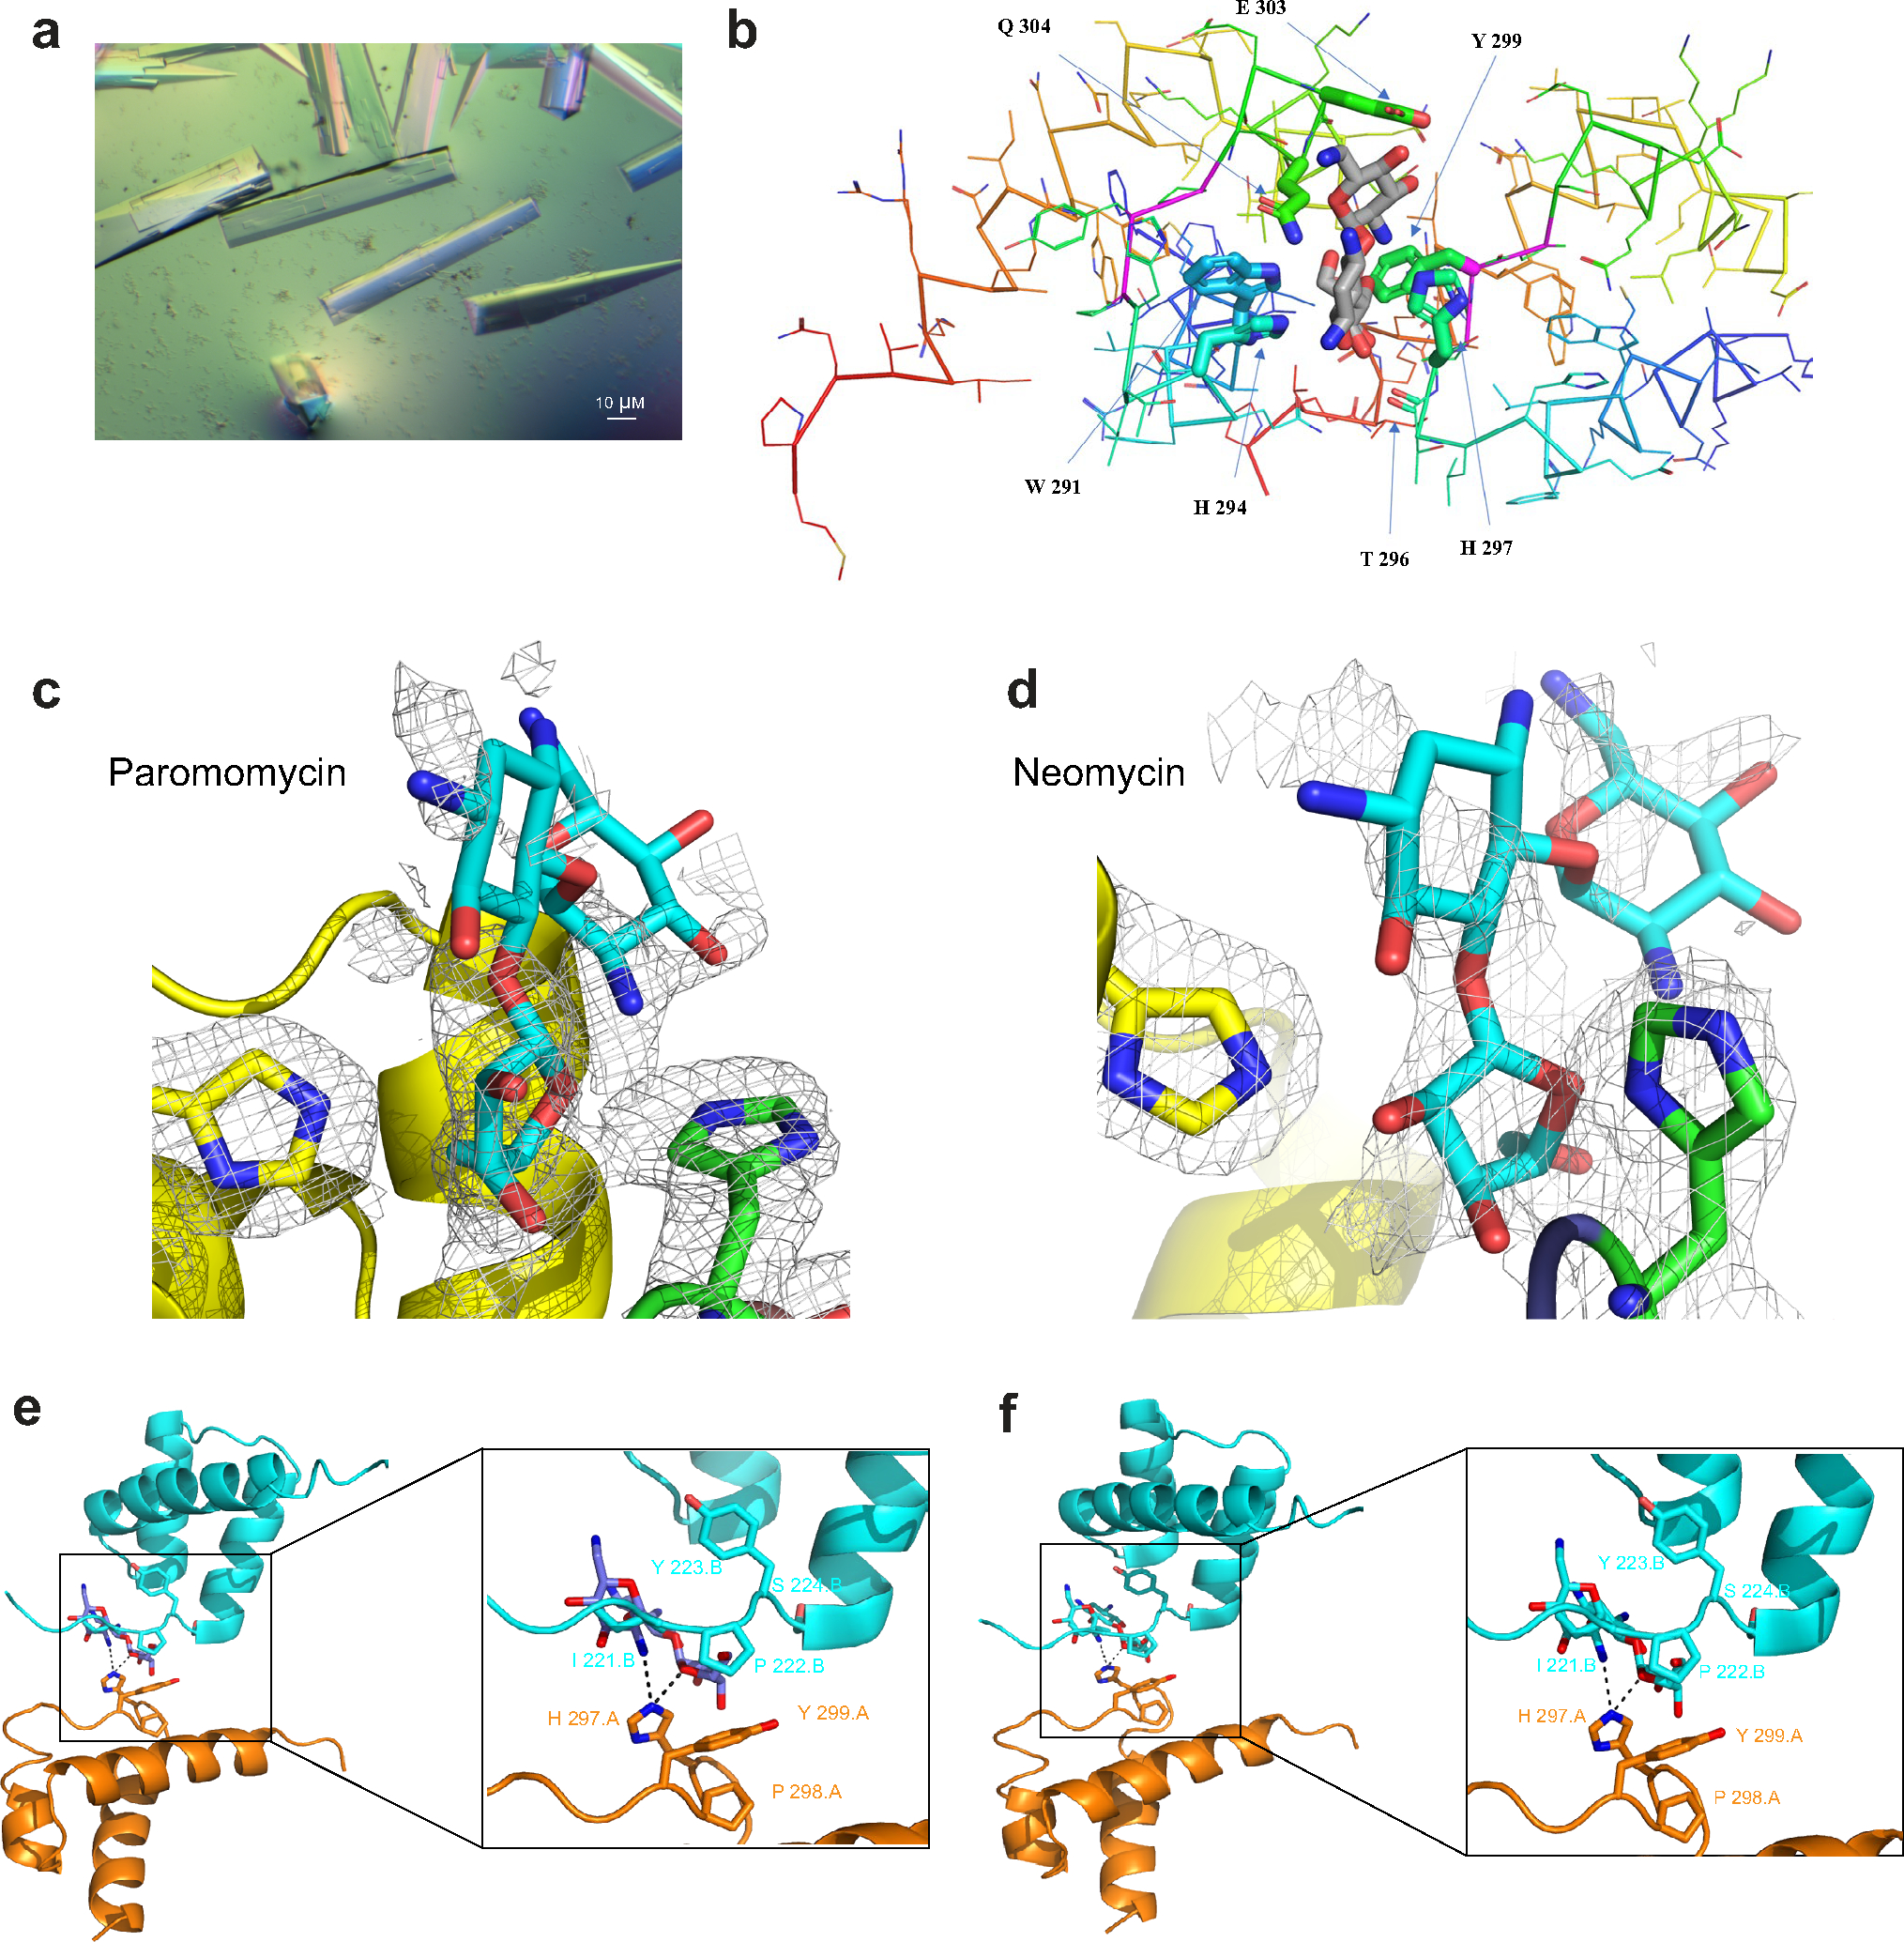
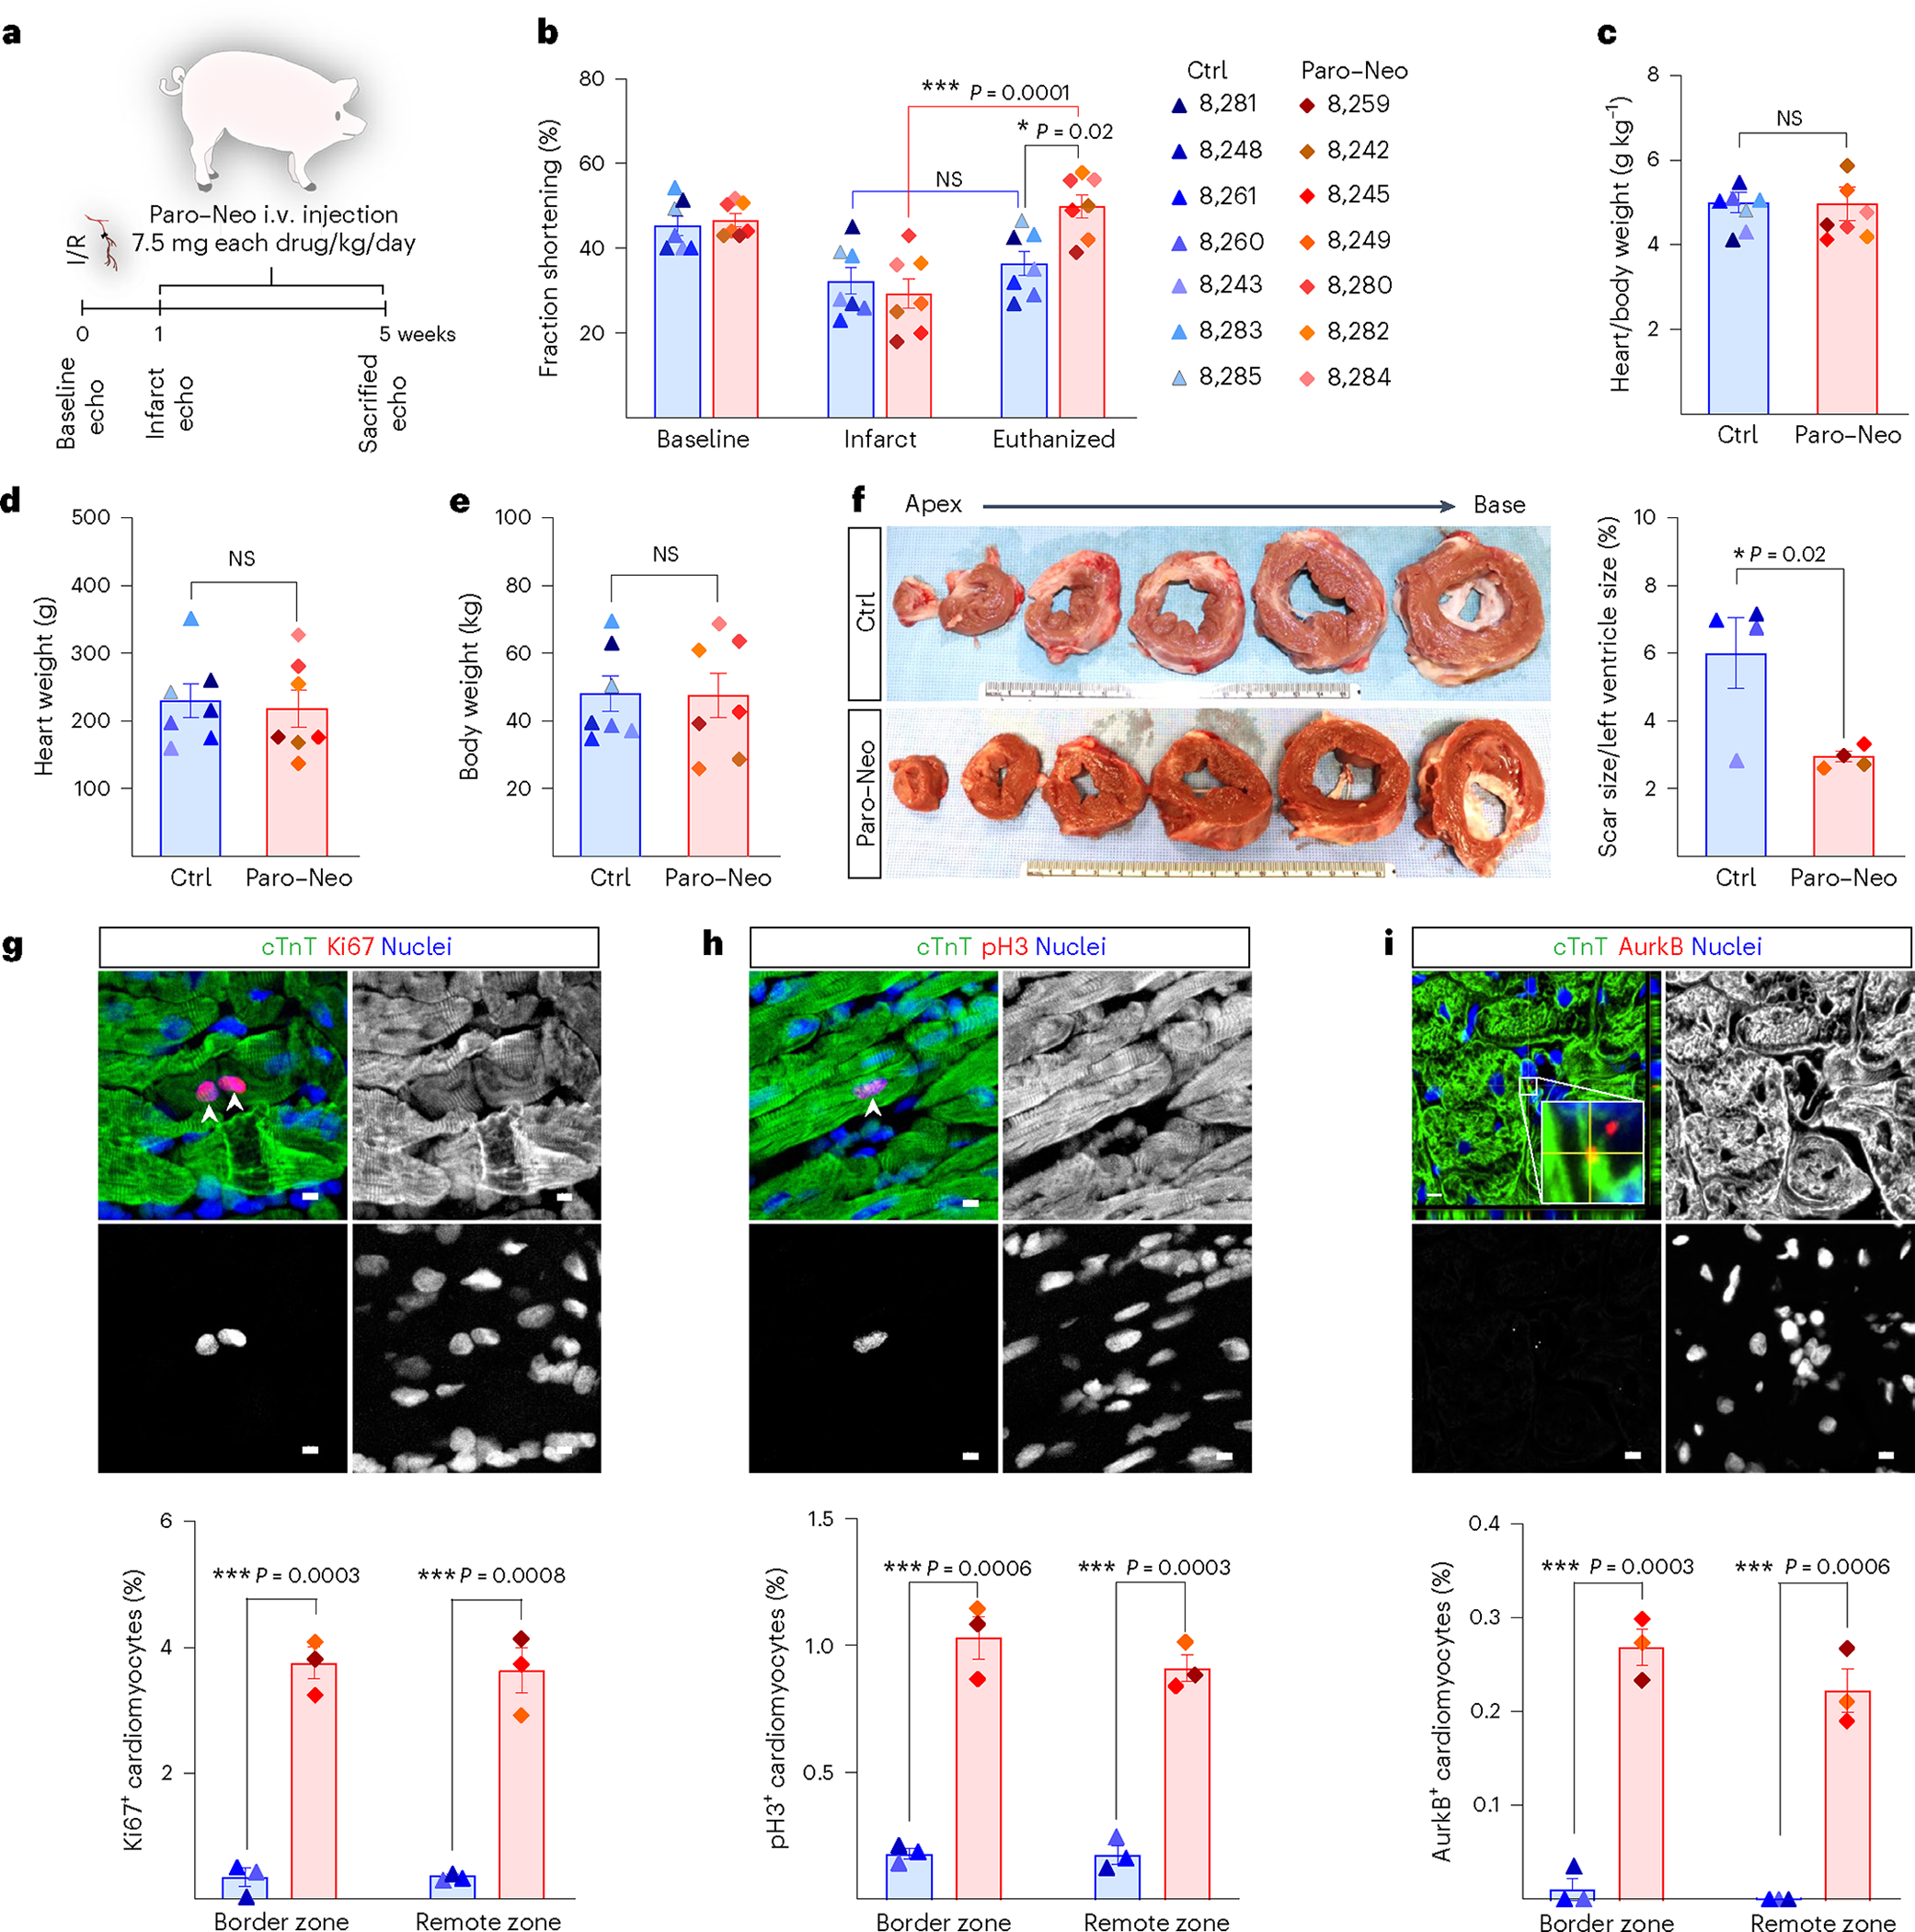
Targeting Meis1 and Hoxb13 transcriptional activity could be a viable therapeutic strategy for heart regeneration. In this study, we performd an in silico screening to identify FDA-approved drugs that can inhibit Meis1 and Hoxb13 transcriptional activity based on the resolved crystal structure of Meis1 and Hoxb13 bound to DNA. Paromomycin (Paro) and neomycin (Neo) induced proliferation of neonatal rat ventricular myocytes in vitro and displayed dose-dependent inhibition of Meis1 and Hoxb13 transcriptional activity by luciferase assay and disruption of DNA binding by electromobility shift assay. X-ray crystal structure revealed that both Paro and Neo bind to Meis1 near the Hoxb13-interacting domain. Administration of Paro-Neo combination in adult mice and in pigs after cardiac ischemia/reperfusion injury induced cardiomyocyte proliferation, improved left ventricular systolic function and decreased scar formation. Collectively, we identified FDA-approved drugs with therapeutic potential for induction of heart regeneration in mammals.


Conflict of interest statement

Competing interests M.G. is founder, consultant, member of the board and equity holder in Forcefield Therapeutics, Heqet Therapeutics and Purespring Therapeutics. All other authors declare no competing interests.

Figures

Extended Data Fig. 1 |
Extended Data Fig. 1 |. Identification of Paro and Neo via a structure-based drug repurposing.
a, Chemical structures of Neo and Paro. b, Docked poses for Neo (magenta) and Paro (green) against S1-S3 sites for MEIS1-HOXB13 crystal structure. Luciferase transcriptional activity assay for p15 with c, Meis1 and d, Hoxb13 against hesperidin and rutin, compared to DMSO (Ctrl). Statistical analyses: two way ANOVA with Tukey’s post-hoc test (c,d); *P < 0.05, **P < 0.01, ***P < 0.001, ****P < 0.0001.
Extended Data Fig. 2 |
Extended Data Fig. 2 |. Purification and crystallization of Meis1 and Hoxb13.
a-b, Size-exclusion chromatography (Superdex 200) of DBD Meis1 and Hoxb13 purified proteins, respectively. The Y axis shows the absorbance at 280 nm and the X axis shows the elution volume in ml. c-d, Purified and peak fractions of (c) Meis1 and (d) Hoxb13 were analysed by SDS-PAGE and visualised with Coomassie Blue staining. e-f, Quantification for (e) Meis1 and (f) Hoxb13 EMSA showing that Paro, Neo, and Paro–Neo combination disrupt their DNA binding capacities. g, Paro–Neo dissociation constant for Meis1-DNA binding in EMSA assays across 0.001–50 μM drug concentrations. Data are presented as mean ± s.e.m. Statistical analyses: one way ANOVA with Tukey’s post-hoc test (e, f); *P < 0.05, **P < 0.01, ***P < 0.001, ****P < 0.0001.
Extended Data Fig. 3 |
Extended Data Fig. 3 |. Electron density for Paro and Neo bound Meis1.
a, Crystals of Meis1 grown with 10 mM Neo in hanging drop. b, Close-up of Ribostamycin (grey) bound to Meis1 interacting domains showing the contacts of H 297, P 298, and Y 299 as well as the role of E 303 to form hydrogen-bond interactions. c, Electron density for Paro-bound Meis1: Shown in grey mesh is the ½2mFo-DFc½ electron density, contoured at 0.5 s. Shown in stick representation are H 297 (green) in chain A, H 294 (yellow) in chain D and the Ribostamycin fragment of Paro (cyan). d, Electron density for Neo-bound Meis1: shown in Grey mesh is the ½2mFo-DFc½ electron density, contoured at 0.7 s. Shown in stick representation are H 297 (green) in chain G, H 294 (yellow) in the symmetry-related chain D and the Ribostamycin fragment of neomycin (cyan). e, Ribbon cartoon representation for Hoxb13 (Cyan) and Meis1 (Orange) along with Ribostamycin (Purple) and close-up for the contributing amino acid residues from Hoxb13 and Meis1 along with Ribostamycin. This was modelled using alignment of PDB_ID; 5EGO and Paro bound to Meis1 at RMSD 0.373 A°. f, Ribbon cartoon representation for Hoxb13 (Cyan) and Meis1 (Orange) along with Ribostamycin (Purple) and close-up for the contributing amino acid residues from Hoxb13 and Meis1 along with Ribostamycin. This was modelled using alignment of PDB_ID: 5EGO and Neo bound to Meis1 at RMSD 0.373 A°.
Extended Data Fig. 4 |
Extended Data Fig. 4 |. Paro treatment promotes adult cardiomyocyte division.
a-c, (a) BW, (b) HW, and (c) HW/BW in control and Paro-treated 10-weeks CD-1 mice. Ctrl, n = 5; Paro-treated groups, n = 5. d, Representative images of immunostaining for pH3 (green), cTnT (red) and nucleus (blue), showing additional examples of mitotic cardiomyocytes in Paro-treated mice. e, Representative images of immunostaining for AurkB (green), cTnT (red) and nucleus (blue), showing additional examples of cytokinesis cardiomyocytes in Paro-treated mice. f, Representative images and quantification for pH3 and cTnT staining in Paro-treated isolated cardiomyocytes. Scale bars, 10 μm (d-f). Data are presented as mean ± s.e.m.; Student’s unpaired two-sided t-test. Data in a-c were done for n = 5 for each group. Data in f were done for n = 4 for each group. *P < 0.05, **P < 0.01, ***P < 0.001.
Extended Data Fig. 5 |
Extended Data Fig. 5 |. Paro–Neo treatment prolongs neonatal cardiomyocyte proliferation.
a, Schematic for Paro–Neo administration to neonates CD-1 pups at 300 mg kg−1, i.p from p1 to p14. Hearts were collected for histological analysis. b, (Left, upper and right) Representative images of immunostaining for pH3 (green), cTnT (red) and nucleus (blue) showing mitotic cardiomyocytes (arrowheads) in Paro–Neo-treated mice; and (left, lower) the quantification. Ctrl, n = 6; Paro–Neo-treated groups, n = 3. c, (Left, upper and right) Representative images of immunostaining for aurora B kinase (green), cTnT (red) and nucleus (blue) showing cytokinesis cardiomyocytes (arrowheads) in Paro–Neo-treated mice; and (left, lower) the quantification. Ctrl, n = 6; Paro–Neo-treated groups, n = 3. d, Representative images and quantification for CSA cardiomyocyte size from WGA (green) and nucleus (blue) staining show no difference in cell size between Paro–Neo and vehicle-treated hearts. Ctrl, n = 3; Paro–Neo-treated groups, n = 4. Data are presented as mean ± s.e.m.; Student’s unpaired two-sided t-test (b,c). Data in b-d were done for at least n = 3 for each group. *P < 0.05, **P < 0.01, ***P < 0.001. Scale bars, 10 μm (b,c) d-f and 100 μm (d).
Extended Data Fig. 6 |
Extended Data Fig. 6 |. Paro–Neo treatment promotes adult cardiomyocyte division.
a, Schematic for Paro–Neo administration to adult CD-1 mice at 300 mg kg−1, i.p. for 2 weeks. Hearts were collected for histological analysis. b-d, (b) BW, (c) HW, and (d) HW/BW in control and Paro–Neo-treated mice. e, Representative images of immunostaining for pH3 (green), cTnT (red) and nucleus (blue), showing additional examples of mitotic cardiomyocytes in Paro–Neo-treated mice. f, Representative images of immunostaining for AurkB (green), cTnT (red) and nucleus (blue), showing additional examples of cytokinesis cardiomyocytes (arrowheads) in Paro–Neo-treated mice. g, (Upper) Representative images and (lower) quantification for pH3 and cTnT staining in Paro–Neo-treated isolated cardiomyocytes. Data are presented as mean ± s.e.m.; Student’s unpaired two-sided t-test (b-d, g). Data in b-d were done for n = 5 for control group and n = 8 for Paro–Neo-treated group. Data in g were done for n = 4 for each group. *P < 0.05, **P < 0.01, ***P < 0.001. Scale bars, 10 μm (e-g).
Extended Data Fig. 7 |
Extended Data Fig. 7 |. RNA-seq with ChIP-seq guided targets.
a, Representative sequencing tracks showing Meis1 ChIP-seq peaks in vehicle-treated (blue) and Paro–Neo-treated (red) hearts at Myh6 locus demonstrating the absence of the peaks in Paro–Neo-treated samples. b, Unbiased RNA-seq (with a fold change of 1.5). Venn diagrams show the common genes of two cohorts (DiKO vs Paro–Neo-treated hearts, normalised to Ctrl). c-d, GO terms of (c) dKO and (d) Paro–Neo treated hearts.
Extended Data Fig. 8 |
Extended Data Fig. 8 |. In vivo pharmacological effect of aminoglycosides on the expression of cell cycle inhibitors, Meis1, Hoxb13, and HSCs.
a, Neonatal CD-1 mice received twice daily injections, i.p. of PBS, Paro (100 mg kg−1), Neo (100 mg kg−1), and Paro–Neo (150 mg kg−1) starting from p14 till p28. b-d, (b) Representative WB and densitometry quantification of (c) p15/p16 and (d) p21 protein expression, n = 4 for each group. Gapdh serves as loading controls. e-f, mRNA expression of (e) Meis1 and (f) Hoxb13 following drug treatment, n = 3 for each group. g-i, (g) Representative WB and densitometry quantification of (h) Meis1 and (i) Hoxb13 protein expression, n = 3 for each group. Gapdh serves as loading controls. j-l, Paro–Neo administration increases HSC number. 10-week-old mice received daily injections of Ctrl or Paro–Neo for 14 days. k, Representative flow cytometry for Ctrl and Paro–Neo-treated samples. l, Histograms of the means of LT-HSCs. Ctrl, n = 8; Paro/Neo-treated groups, n = 7. Data are presented as mean ± s.e.m. Statistical analyses: one-way ANOVA with Tukey’s post-hoc test (c-f, h, i), Student’s unpaired two-sided t-test (l); *P < 0.05, **P < 0.01, ***P < 0.001, ****P < 0.0001.
Extended Data Fig. 9 |
Extended Data Fig. 9 |. Aminoglycosides prevent cardiac remodelling in MI mouse model.
a, Schematic of MI model in drug(s)-treated mice b, Serial echocardiography assessment of LVEF showing maintained LVEF post-MI in Paro- and Paro–Neo-treated mice, compared with controls. However, higher LVEF post-MI in Paro–Neo-treated mice was observed. c, Representative echocardiography images for Ctrl, Paro-, and Paro–Neo-treated hearts at 1 week (pre-injection) and 8 weeks post-MI. d-k, Serial echocardiographic measurement of Ctrl, Paro-, and Paro–Neo-treated mice. l, Masson’s trichrome staining of hearts post-MI shows a marked decrease in LV dilatation and remodelling of Paro–Neo-treated hearts, compared with Ctrl hearts. m, Paro-treated hearts show a non-significant decline in the infarcted size, while Paro–Neo-treated hearts show a significant decrease in the infarcted size midline length, compared with controls. Ctrl, n = 6; Paro, n = 5, and Paro–Neo-treated groups, n = 8. n-p, (n) BW, (o) HW, and (p) HW/BW in Ctrl, Paro-, and Paro–Neo-treated mice. Ctrl, n = 6; Paro, n = 5, and Paro–Neo-treated groups, n = 5. q, Wet to dry lung ratio shows a significant decrease in the Paro and Paro–Neo-treated mice, compared with controls. Ctrl, n = 6; Paro, n = 5, and Paro–Neo-treated groups, n = 5. Data are presented as mean ± s.e.m. Statistical analyses: two-way ANOVA with Tukey’s post-hoc test (b); one-way ANOVA with Tukey’s post-hoc test (m-q); *P < 0.05, **P < 0.01, ***P < 0.001, ****P < 0.0001.
Extended Data Fig. 10|
Extended Data Fig. 10|. Schematic of Paro and Neo inhibiting Meis1 and Hoxb13 transcriptional activity.
In-silico screening identifies the FDA-approved drugs Paromomycin and Neomycin as inhibitors of Meis1 and Hoxb13 DNA binding, thereby promoting heart regeneration.
Fig. 1 |
Fig. 1 |. Identification of Paro and Neo as FDA-approved drugs targeting MEIS1–HOXB13.
a, Structural insights for potential druggable sites for MEIS1–HOXB13. S1: HOXB13 DBD, S2: MEIS1 DBD and S3: interacting interface between MEIS1 and HOXB13 (PDB ID: 5EGO). b, In silico screening platform identification top FDA-approved drugs that may target S1, S2 and S3. c, Interacting energies (ΔG) for the top candidates targeting S1, S2 and S3 of MEIS1–HOXB13 crystal structure. d, Immunostaining for pH3 (green) and cardiac troponin T (red) (left), showing the percentage of mitotic NRVMs (arrowheads) (right). e,f, Luciferase reporter results after transfection of p15 promoter reporter construct plus Meis1A (e) or Hoxb13-GFP (f) constructs with Paro and Neo in 293T cells. Data in df were independently repeated at least three times with similar results. Data are presented as mean ± s.e.m. Statistical analyses: one-way ANOVA with Dunnett’s post hoc test (d); two-way ANOVA with Tukey’s post hoc test (e,f); *P < 0.05, **P < 0.01, ***P < 0.001 and ****P < 0.0001. Scale bars, 100 μm (d).
Fig. 2 |
Fig. 2 |. Paro and Neo interfere with Meis1, Hoxb13 and DNA interactions.
a,b, Left, representative image of EMSA showing Paro–Neo combination disrupts of Meis1-DNA or Hoxb13-DNA binding. Each drug (1 μM) was added to an incubation mixture containing the unlabeled DNA (0.5 μM) and Meis1 (0.5 μM) (a) or Hoxb13 (0.25 μM) (b). DNA–protein mixture was used as a normalized value. Right, quantification of EMSA. c,d, Close-up for ribostamycin along with Meis1 originated from Paro co-crystallization (c) and Neo co-crystallization (d), highlighting the contributing amino acids H297.A, P298.A and Y299.A. e, Structure of ribostamycin bound to Meis1 C-terminal domain at loop carries an insertion (‘PYP’, magenta) characteristic of the TALE homeodomain family; the second and third α-helix form the HTH motif; and the third α-helix is mainly responsible for DNA binding. f, Superimposition of the resolved crystal structures of Meis1 bound to Paro (magenta) and Neo (orange). The green helical structure corresponds to chain G of Meis1 co-crystallized with Neo, and the cyan helical structure corresponds to chains A–H of Meis1 co-crystallized with Paro. g, Superimposition of the resolved crystal structures of Meis1 bound to Paro (magenta), Meis1 bound to Neo (orange) and Meis1–Hoxb13 (PDB ID: 5EGO). The green helical structure corresponds to chain G of Meis1 co-crystallized with Neo; the cyan helical structure corresponds to chain A of Meis1 co-crystallized with Paro; the magenta helical structure corresponds to Meis1; and the blue helix corresponds to Hoxb13 (PDB ID: 5EGO). h, Mice received twice-daily injections of PBS (Ctrl), Paro (100 mg kg−1) and Paro–Neo (150 mg kg−1) starting from P14 until P28. i, Co-IP using Hoxb13 antibody from total heart extracts (n = 3) in h. j, Quantification of Meis1 densitometry; co-IP using IgG serves as a negative control. Gapdh serves as a loading control. Data in a and b were independently repeated at least three times with similar results. Data are presented as mean ± s.e.m. Statistical analyses: one-way ANOVA with Tukey’s post hoc test (a,b,j); *P < 0.05, **P < 0.01, ***P < 0.001 and ****P < 0.0001. Ctrl, control; NS, not significant.
Fig. 3 |
Fig. 3 |. Paro increases proliferation indices in adult mice.
a, Schematic for Paro administration to 10-week-old CD-1 male mice at 200 mg kg−1 i.p for 2 weeks. Hearts were collected for histological analysis. b, pH3 and cTnT co-immunostaining shows a significant increase in the cardiomyocyte mitosis (arrowhead) marker for Paro-treated mice compared to controls. Ctrl, n = 6; Paro-treated groups, n = 3. c, AurkB and cTnT co-immunostaining shows a significant increase in the cardiomyocyte cytokinesis (inset) marker for Paro-treated mice compared to controls. Ctrl, n = 4; Paro-treated groups, n = 3. d, WGA staining shows a shift to smaller CSA cardiomyocyte cell size in Paro-treated mice compared to controls. Ctrl, n = 4; Paro-treated groups, n = 3. e, Paro-treated mice show a significant increase in the cardiomyocyte cell count compared to controls. Ctrl, n = 8; Paro-treated groups, n = 8. f, Cnx43 (red) and nuclear staining (blue) co-immunostaining (left) shows a significant decrease in the binucleation and multinucleation and a significant increase in the mononucleation in Paro-treated mice compared to controls (right). Ctrl, n = 3; Paro-treated groups, n = 3. g, Representative immunofluorescence images (upper) and quantification of single-labeled (red or green, arrowheads) cardiomyocytes showing a significant increase in Paro-treated mice compared to controls after injection of tamoxifen (lower). Ctrl, n = 3; Paro-treated groups, n = 3. Data are presented as mean ± s.e.m.; Student’s unpaired two-sided t-test. *P < 0.05, **P < 0.01 and ***P < 0.001. Scale bars, 10 μm (b,c,f) and 50 μm (d,g). CM, cardiomyocyte; Ctrl, control; WT, wild-type.
Fig. 4 |
Fig. 4 |. Administration of Paro–Neo combination increases proliferation indices in adult mice.
a, pH3 and cTnT co-immunostaining shows a significant increase in the cardiomyocyte mitosis (arrowhead) marker for Paro–Neo-treated 10-week-old CD-1 male mice compared to controls. Ctrl, n = 6; Paro–Neo-treated groups, n = 3. b, AurkB and cTnT co-immunostaining shows a significant increase in the cardiomyocyte cytokinesis (inset) marker for Paro–Neo-treated mice compared to controls. Ctrl, n = 4; Paro–Neo-treated groups, n = 3. c, WGA staining shows a significant shift to smaller CSA cardiomyocyte cell size in Paro–Neo-treated mice compared to controls. Ctrl, n = 4; Paro–Neo-treated groups, n = 3. d, Paro–Neo-treated mice show a significant increase in the cardiomyocyte cell count compared to controls. Ctrl, n = 8; Paro–Neo-treated groups, n = 7. e, Quantification for nucleation to show a significant increase in the mononucleation Paro–Neo-treated mice compared to controls. Ctrl, n = 3; Paro–Neo-treated groups, n = 3. f, Representative immunofluorescence images (left) and quantification of single-labeled (red or green, arrowheads) cardiomyocytes showing a significant increase in Paro–Neo-treated mice compared to controls, after injection of 4-hydroxytamoxifen (right). Ctrl, n = 3; Paro–Neo-treated groups, n = 3. gj, S-phase labeling of cardiomyocytes using BrdU. Ctrl, n = 3; Paro–Neo-treated groups, n = 3. g, Schematic diagram of BrdU labeling. Ten-week-old CD-1 wild-type (WT) mice were injected with Paro–Neo combination (150 mg kg−1, twice daily, i.p.) and concurrent administration of BrdU in the drinking water for 14 d. h, Whole-section staining for Ctrl and Paro–Neo-treated hearts. BrdU (red), cardiac troponin T (cTnT, green), cardiomyocyte cell membrane (WGA, white) and nuclei (blue). i, Representative images of BrdU+ cardiomyocytes. Ctrl, n = 3; Paro–Neo-treated groups, n = 3. j, Quantification of BrdU+ cardiomyocyte nuclei. kn, Paro–Neo co-administration induces cardiomyocytes undergoing G2/M transition. k, Ten-week-old CD1 male mice were injected intravenously with AAV9 dual reporter (mCherry–LoxP–EGFP) and either AAV9 control (empty vector) or AAV9–CyB–Cre (1.67 × 10¹³ vg/kg each). After 1 week, mice were injected with an equimolar ratio of Paro and Neo (150 mg kg−1 of each in PBS up to day 9 and 75 mg kg−1 of each from day 10 to day 14, i.p.) or control (PBS). Ctrl, n = 4; Paro–Neo-treated groups, n = 4. l, Whole-section staining for Ctrl and Paro–Neo-treated hearts. mCherry (red), EGFP (green) and nuclei (blue). m, Representative images of Ctrl and Paro–Neo-treated hearts of mice harboring AAV9–CyB–Cre. mCherry (red), EGFP (green), cardiomyocyte cell membrane (WGA, white) and nuclei (blue). n, Quantification of G2/M+ cardiomyocytes from Ctrl and Paro–Neo-treated cell CycleTrack reporter mice. Data are presented as mean ± s.e.m.; Student’s unpaired two-sided t-test. *P < 0.05, **P < 0.01 and ***P < 0.001. Scale bars, 10 μm (a,b), 20 μm (i), 50 μm (c,f,m) and 1 mm (h,l). CM, cardiomyocyte; Ctrl, control.
Fig. 5 |
Fig. 5 |. Paro–Neo alters binding patterns of Meis1–Hoxb13 to their target genes in cardiomyocytes.
ac, Genome-wide identification of Meis1 and Hoxb13 loci using ChIP-seq for Ctrl and Paro–Neo-treated groups. Venn diagrams show the targets from Meis1 ChIP-seq (a) and Hoxb13 ChIP-seq (b) of vehicle-treated and Paro–Neo-treated hearts. c, GO terms of the genes after Paro–Neo treatment demonstrating loss of Meis1 and HoxB13 in loci enriched pathways related to cell cycle, cardiac development and growth and metabolism. d, pH3 and cTnT co-immunostaining shows no statistically significant difference between DiKO and control (F/F) mice treated with Paro–Neo in the cardiomyocyte mitosis (arrowhead) marker. Ctrl (F/F), n = 3; DiKO groups, n = 3. b, AurkB and anti-cTnT co-immunostaining shows no statistically significant difference between DiKO and control (F/F) mice treated with Paro–Neo in the cardiomyocyte cytokinesis (arrowhead) marker. Ctrl (F/F), n = 3; DiKO groups, n = 3. Data are presented as mean ± s.e.m.; Student’s unpaired two-sided t-test (d,e). *P < 0.05, **P < 0.01 and ***P < 0.001. Scale bars, 10 μm (d,e). Ctrl, control; NS, not significant.
Fig. 6 |
Fig. 6 |. Paro–Neo improves LVEF after I/R.
a, Serial echocardiography measurements of Ctrl, Paro and Paro–Neo-treated I/R mice. Drug(s) treatment started 10 d after I/R. b, Representative images of echocardiography at 10 d, 30 d and 50 d after I/R. c, Quantification (left) and representative images (right) of myocardial interstitial fibrosis (red, insets) in Ctrl, Paro and Paro–Neo-treated I/R mice. Heart sections were stained with picrosirius red at 50 d after I/R. d, Representative image of pH3+ cardiomyocyte (arrowheads) and quantification at BZ (e) and RZ (f). g, Representative image of AurkB+ cardiomyocyte (arrowhead) and quantification at BZ (h) and RZ (i). j, Ratio of heart weight/body weight suggests that both treatments reduced MI-induced cardiac hypertrophy. k, Ratio of wet lung weight/dried lung weight showed no difference among groups. Ctrl, n = 6; Paro, n = 7, Paro–Neo-treated groups, n = 7. Data are presented as mean ± s.e.m. Statistical analyses: two-way ANOVA with Dunnett’s post hoc test (a); one-way ANOVA with Tukey’s post hoc test (c,e,f,h,i,j,k); *P < 0.05, **P < 0.01, ***P < 0.001 and ****P < 0.0001. Scale bar, 10 μm (d,g) and 1 mm (c). NS, not significant.
Fig. 7 |
Fig. 7 |. Paro–Neo prevents cardiac remodeling in I/R pig model.
a, One week after I/R induced by LAD coronary artery ligation, 45-day-old Yorkshire pigs were infused with PBS (control) and Paro–Neo combination (15 mg kg−1 d−1, i.v.) for 5 weeks. The cardiac function was assessed by echocardiography. Hearts were collected after 5 weeks post-I/R for histological analysis. b, Serial echocardiography assessment showed higher FS (FS%) after MI in Paro–Neo-treated pigs compared to control-treated pigs. Ctrl, n = 7; Paro/Neo-treated groups, n = 7. ce, No change was detected in the heart weight/body weight ratio (c), heart weight (d) and body weight (e) and between Paro–Neo-treated and control-treated pigs. Ctrl, n = 7; Paro–Neo-treated groups, n = 7. f, Representative transverse rings of hearts 5 weeks after MI show a significant decrease in scar size of Paro–Neo-treated hearts compared to vehicle-treated hearts. Ctrl, n = 4; Paro–Neo-treated groups, n = 4. Ki67 (g) or pH3 and cTnT co-immunostaining (h) shows a significant increase in the cardiomyocyte mitosis marker for Paro–Neo-treated pigs compared to vehicle-treated pigs. i, AurkB and cTnT co-immunostaining shows a significant increase in the cardiomyocyte cytokinesis marker for Paro–Neo-treated pigs compared to vehicle-treated pigs. Ctrl, n = 3; Paro–Neo-treated groups, n = 3. Data are presented as mean ± s.e.m. Statistical analyses: two-way ANOVA with Tukey’s post hoc test (b); Student’s unpaired two-sided t-test (ci); *P < 0.05, **P < 0.01, ***P < 0.001 and ****P < 0.0001. Scale bar, 5 μm (gi). echo, echocardiography; NS, not significant.

Comment in

  • Toward drug-induced heart regeneration.
    Yuan X, Braun T. Yuan X, et al. Nat Cardiovasc Res. 2024 Mar;3(3):260-261. doi: 10.1038/s44161-024-00446-8. Nat Cardiovasc Res. 2024. PMID: 39196122 No abstract available.

References

    1. Bui AL, Horwich TB & Fonarow GC Epidemiology and risk profile of heart failure. Nat. Rev. Cardiol. 8, 30–41 (2011). - PMC - PubMed
    1. Senyo SE et al. Mammalian heart renewal by pre-existing cardiomyocytes. Nature 493, 433–436 (2013). - PMC - PubMed
    1. Bergmann O et al. Evidence for cardiomyocyte renewal in humans. Science 324, 98–102 (2009). - PMC - PubMed
    1. Poss KD Getting to the heart of regeneration in zebrafish. Semin. Cell Dev. Biol. 18, 36–45 (2007). - PubMed
    1. Walsh S, Ponten A, Fleischmann BK & Jovinge S Cardiomyocyte cell cycle control and growth estimation in vivo—an analysis based on cardiomyocyte nuclei. Cardiovasc. Res. 86, 365–373 (2010). - PubMed

Publication types

MeSH terms

Substances