. 2024 Aug 22;14(37):26694-26702.
doi: 10.1039/d4ra04148h.

Polydopamine functionalized FeTiO3 nanohexagons for selective and simultaneous electrochemical determination of dopamine and uric acid

Affiliations

Polydopamine functionalized FeTiO3 nanohexagons for selective and simultaneous electrochemical determination of dopamine and uric acid

T K Aparna et al. RSC Adv. .

Abstract

Herein we report the simultaneous detection of dopamine (DA) and uric acid (UA) using polydopamine (PDA) functionalized FeTiO3 nanohexagons. The nanohexagons were hydrothermally synthesized and subsequently functionalized with PDA in a Tris-buffer solution. The PDA functionalized nanostructure was characterized using X-ray diffraction (XRD), scanning electron microscopy (SEM), transmission electron microscopy (TEM), X-ray photoelectron spectroscopy (XPS), and Fourier transform infrared (FTIR), respectively. The SEM and TEM investigations revealed the presence of FeTiO3 nanohexagons along with a peripheral coating of PDA over the nanostructures. The XRD pattern confirmed the formation of the ilmenite structure, while the chemical structure was investigated through XPS and FTIR respectively. Using cyclic voltammetry (CV) the efficacy of FeTiO3-PDA electrode was evaluated toward DA oxidation. The enhanced activity of the functionalized electrode in DA oxidation, as compared to the untreated FeTiO3, may be attributed to the significant presence of hydroxyl, amine, and imine functional groups over the polymer layer. Differential pulse voltammetry (DPV) was utilized for the detection of DA and UA. With a linear range of 50 μM to 250 μM, the detection limits of 0.30 μM and 4.61 μM were determined for DA and UA, respectively. The peak separation of 263 mV between DA and UA demonstrates the sensor's remarkable selectivity. In addition, the study displayed the ability to detect both DA and UA simultaneously, and the validity of the sensor was evaluated in serum samples, respectively.


Conflict of interest statement

There are no conflicts to declare.

Figures

Fig. 1
Fig. 1. Represents FESEM images of FeTiO3 recorded at different magnifications (a and b) and FESEM images of PDA-FeTiO3 captured at various magnifications (c and d).
Fig. 2
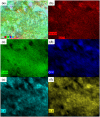
Fig. 2. (a) Elemental map showing the distribution of different elements in PDA-FeTiO3 nanocomposite; (b–f) elemental maps showing individual elements Fe, Ti, N, C and O, respectively.
Fig. 3
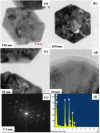
Fig. 3. Displays TEM micrographs of PDA-FeTiO3 at various magnifications (a–d). The associated SAED pattern (e), and the energy-dispersive X-ray spectroscopy (EDX) image (f).
Fig. 4
Fig. 4. (a and b) XRD pattern and FTIR spectrum of FeTiO3 and PDA-FeTiO3 nanocomposite, respectively.
Fig. 5
Fig. 5. Illustrates the XPS spectrum of PDA-FeTiO3, including (a) survey spectrum and detailed spectra for (b) Fe 2p, (c) Ti 2P, (d) O 1s, (e) C 1s and (f) N 1s, respectively.
Fig. 6
Fig. 6. Shows the Nyquist plot for FeTiO3/GCE and PDA-FeTiO3/GCE. The data was collected from a solution consisting of 0.1 M PBS and 5 mM K4[Fe(CN)6]. The frequency range used was from 105 Hz to 0.01 Hz.
Fig. 7
Fig. 7. Depicts the cyclic voltammogram, which demonstrates the effect of dopamine on FeTiO3/GCE and PDA-FeTiO3/GCE. The image was acquired at a scan rate of 100 mV s−1 from a solution consisting of 0.1 M PBS and 0.1 mM DA. The CV response of PDA-FeTiO3/GCE without addition of DA (blank) is shown in blue colour.
Fig. 8
Fig. 8. (a) Illustrated the cyclic voltammetry response of PDA-FeTiO3/GCE for 0.1 mM DA at various scan rates, while the image presented in (b) represented the calibration graph.
Fig. 9
Fig. 9. Illustrates (a) cyclic voltammetry curves for 0.1 mM dopamine on PDA-FeTiO3/GCE with a pH range of 3 to 11, obtained from a 0.1 M PBS solution and (b) the corresponding variation of peak potential (Epa) and peak current (Ipa) with respect to pH.
Fig. 10
Fig. 10. Presents the differential pulse voltammetry (DPV) curves for (a) dopamine (50 μM to 250 μM) and (c) uric acid (50 μM to 250 μM) on PDA-FeTiO3/GCE from a solution of 0.1 M PBS, with (b) and (d) displaying the associated calibration plot, respectively.
Fig. 11
Fig. 11. (a) DPV responses on PDA-FeTiO3/GCE in 0.1 M PBS at different concentrations of (a) DA (100 μM to 500 μM), (c) UA (100 μM to 500 μM) and (b and d) their corresponding calibration curves.
Fig. 12
Fig. 12. Displays (a) the DPV response demonstrating the concurrent detection of dopamine and uric acid at varied concentrations on PDA-FeTiO3/GCE in 0.1 M PBS. The corresponding calibration for these substances is presented in (b) and (c).
Fig. 13
Fig. 13. Displays a bar plot that demonstrates the changes in peak current observed during dopamine detection in the presence of various interfering agents on FeTiO3/GCE and PDA-FeTiO3/GCE.

References

    1. Dalley W. Roiser J. P. Neuroscience. 2012;215:42. doi: 10.1016/j.neuroscience.2012.03.065. - DOI - PubMed
    1. Weinstein J. J. Chohan M. O. Slifstein M. Kegeles L. S. Moore H. AbiDargham A. Biol. Psychiatry. 2017;81:31. doi: 10.1016/j.biopsych.2016.03.2104. - DOI - PMC - PubMed
    1. He Q. Liu J. Liu X. Li G. Chen D. Deng P. Liang J. Nanomater. 2018;8:194. doi: 10.3390/nano8040194. - DOI - PMC - PubMed
    1. Channer B. Matt S. M. Nickoloff-Bybel E. A. Pappa V. Agarwal Y. Wickman J. Gaskill P. J. Pharmacol. Rev. 2023;75:62–158. doi: 10.1124/pharmrev.122.000618. - DOI - PMC - PubMed
    1. Guan C. L. Ouyang J. Li Q. L. Liu B. H. Baeyens W. R. G. Talanta. 2000;50:1197. doi: 10.1016/S0039-9140(99)00225-8. - DOI - PubMed

LinkOut - more resources