. 2024 Jul 20;27(8):110546.
doi: 10.1016/j.isci.2024.110546. eCollection 2024 Aug 16.

Purinergic exposure induces epigenomic and transcriptomic-mediated preconditioning resembling epilepsy-associated microglial states

Affiliations

Purinergic exposure induces epigenomic and transcriptomic-mediated preconditioning resembling epilepsy-associated microglial states

Ricardo Martins-Ferreira et al. iScience. .

Abstract

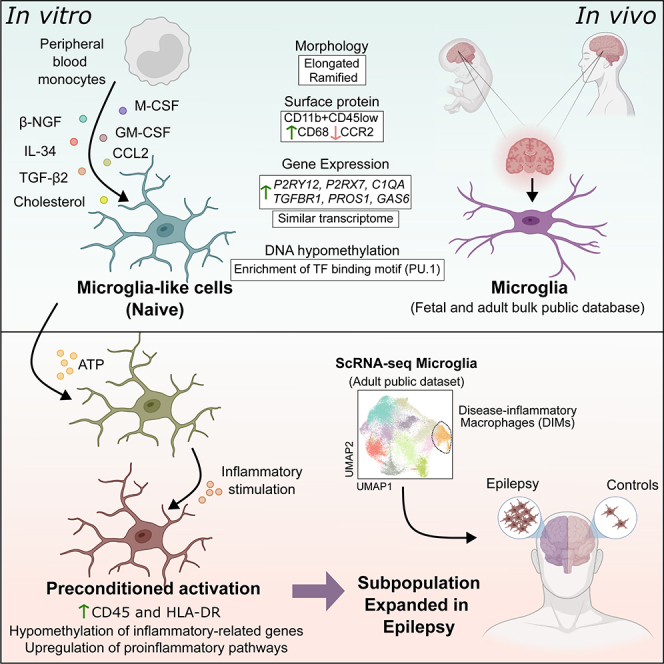
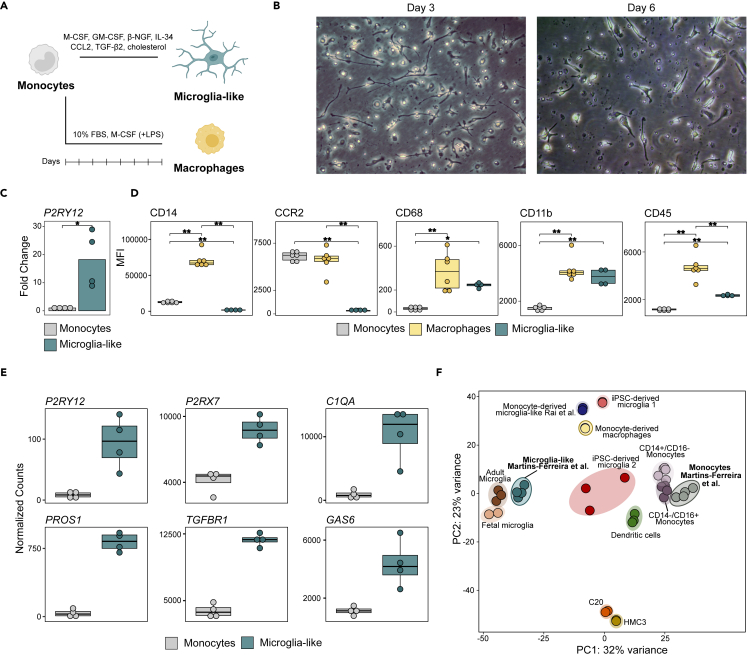
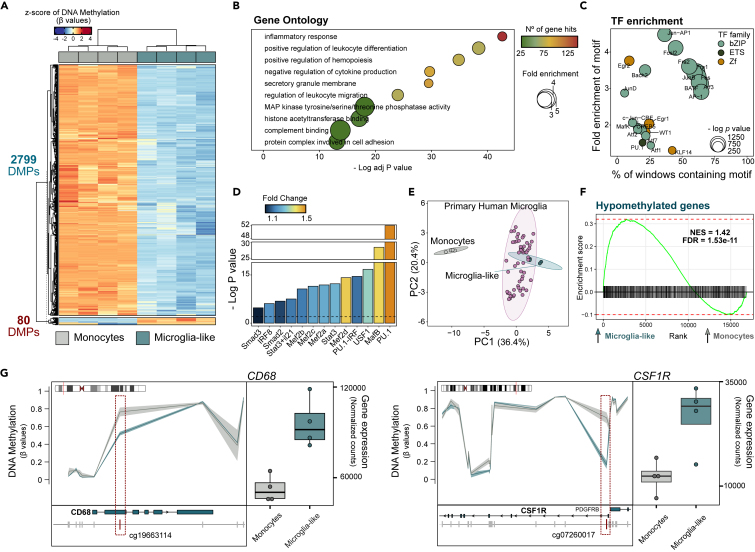
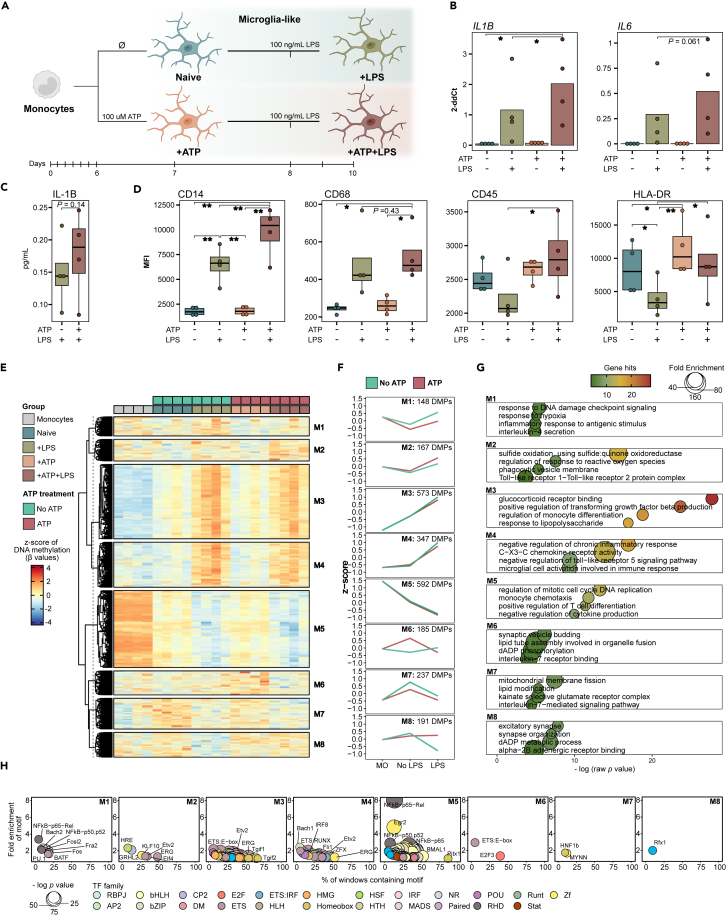
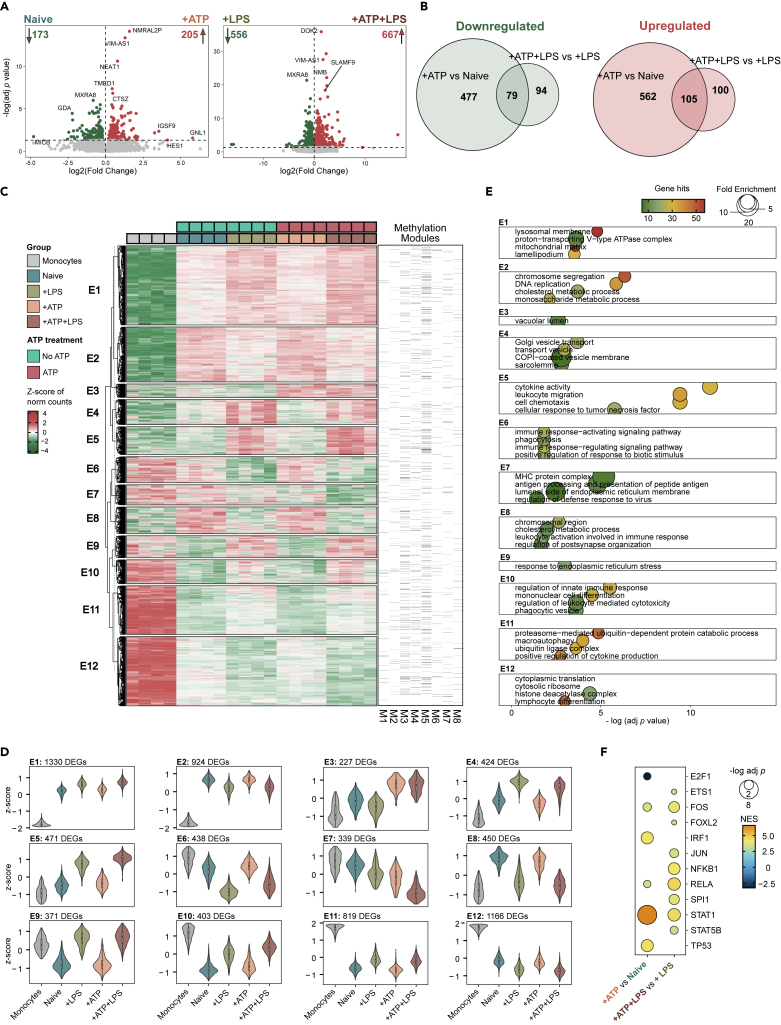
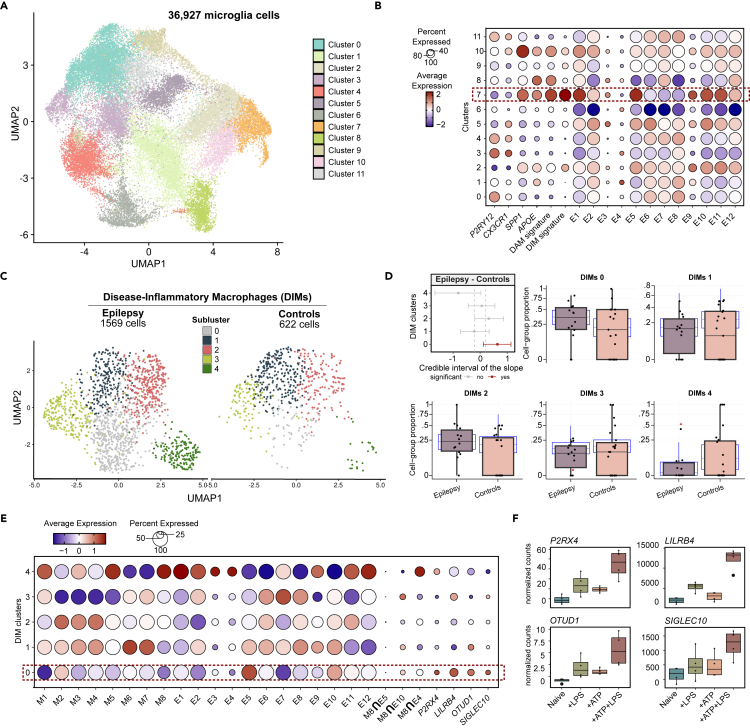
Microglia play a crucial role in a range of neuropathologies through exacerbated activation. Microglial inflammatory responses can be influenced by prior exposures to noxious stimuli, like increased levels of extracellular adenosine and ATP. These are characteristic of brain insults like epileptic seizures and could potentially shape subsequent responses through epigenetic regulation. We investigated DNA methylation and expression changes in human microglia-like cells differentiated from monocytes following ATP-mediated preconditioning. We demonstrate that microglia-like cells display homeostatic microglial features, shown by surface markers, transcriptome, and DNA methylome. After exposure to ATP, TLR-mediated activation leads to an exacerbated pro-inflammatory response. These changes are accompanied by methylation and transcriptional reprogramming associated with enhanced immune-related functions. The reprogramming associated with ATP-mediated preconditioning leads to profiles found in microglial subsets linked to epilepsy. Purine-driven microglia immune preconditioning drives epigenetic and transcriptional changes that could contribute to altered functions of microglia during seizure development and progression.

Keywords: Epigenetics; Epilepsy; Microglia; Purines; Transcriptomics.


Conflict of interest statement

The authors declare no competing interests.

Figures

None
Graphical abstract
Figure 1
Figure 1
Monocyte-derived microglia-like cells show features of homeostatic microglia (A) Schematic representation of the in vitro differentiation protocol from freshly isolated monocytes to monocyte-derived microglia-like cells and monocyte-derived macrophages. For microglia-like differentiation, monocytes were plated in serum-free conditions with medium supplemented with M-CSF, GM-CSF, β-NGF, IL-34, CCL2, TGF-β2, and cholesterol. Macrophages were obtained by culturing monocytes in medium supplemented with 10% FBS and M-CSF; plus, LPS treatment one day prior to collection. (B) Representative optical microscopy images of microglia-like differentiation at days three and six of culture with 20× magnification. (C) Barplot representation of the gene expression of P2RY12 in microglia-like cells in comparison to monocytes obtained by RT-qPCR. The significance was calculated using a paired t test (∗p < 0.05). (D) Boxplot representation of the median fluorescence intensity (MFI) values obtained by flow cytometry for CD14, CCR2, CD68, CD11b, and CD45 in monocytes, macrophages, and microglia-like cells. The significance was calculated using a paired t test (∗p < 0.05, ∗∗p < 0.01). (E) Boxplot representation of RNA-seq normalized counts for P2RY12, P2RX7, C1QA, PROS1, TGFBR1, and GAS6 in monocytes and microglia-like cells. All six genes were significantly upregulated in microglia-like cells in the regression model. (F) Principal-component analysis (PCA), using variance stabilizing transformation (VST) values considering all transcriptome of the RNA-seq data generated in this study for monocytes and microglia-like, together with public data of CD14+/CD16-and CD14-/CD16+ monocytes, dendritic cells, monocyte-derived macrophages, monocyte-derived microglia-like, iPSC-derived microglia, microglial cell lines (C20 and HMC3), and primary adult and fetal microglia. See also Figures S1 and S2, and Table S1.
Figure 2
Figure 2
DNA methylation changes during differentiation associate with the acquisition of microglial features (A) Heatmap representation of the DNA methylation of the differentially methylated positions (DMPs) obtained for the microglia-like vs. monocytes comparison. DNA methylation is represented as the Z score of the beta values. The significance cutoff was of adjusted p value (FDR) < 0.05 and difference in mean beta values >0.2. (B) Selected list of significantly enriched gene ontology (GO) terms for the hypomethylated DMPs in microglia-like. The significance of enrichment is represented by the negative of the log of the adjusted p value, the enrichment fold change and the number of gene hits. (C) Motif enrichment of the most significant TFs (p value < 1E-21) from the list of hypomethylated DMPs. The TFs are annotated by family and the enrichment is represented by the negative of the log of the p value and the percentage of sequences matching the motif. (D) Barplot showing the TF motif enrichment of a selected group of TFs previously show to be associated with microglia-specific chromatin accessibility. All show a p value lower than 0.01. The enrichment is represented by the negative of the log of the p value. (E) Principal-component analysis (PCA) considering the beta values corresponding to all pairwise DMPs between monocytes, microglia-like cells and primary microglia from postmortem brain (GSE191200). (F) Gene set enrichment analysis (GSEA) of the list of genes associated with hypomethylated DMPs in the differential expression comparison between microglia-like and monocytes. Genes associated with hypomethylated DMPs are upregulated in microglia-like cells. The enrichment is represented by the positive Normalized Enrichment Score (NES) and the statistical significance by the adjusted p value (FDR). (G) Graphical representation of the beta values of the CpGs located nearby the CD68 and CSF1R genes for monocytes and microglia-like cells (left panels). The genes and the individual probes are represented in relation to the annotated genes in the UCSC Ref Seq. The CpGs highlight in red demonstrate a statistically significant hypomethylation in microglia-like vs. monocytes. Boxplot representation of RNA-seq normalized counts for CD68 and CSF1R in monocytes and microglia-like cells (right panels). Both genes were significantly upregulated in microglia-like cells in the regression model. See also Figure S2 and Table S2.
Figure 3
Figure 3
ATP-driven preconditioning promotes a posterior exacerbated pro-inflammatory response to LPS, coupled with bidirectional DNA methylation modifications (A) Schematic representation of the preconditioning and inflammatory stimulation strategy in microglia-like cells. The first set of conditions were collected at day seven of culture and were either preconditioned (+ATP) or non-preconditioned (Naive) with 100 μM ATP for 24 h. The preconditioned and non-preconditioned microglia-like were stimulated with 100 ng/mL LPS two days before collection and collected at day ten of culture (+ATP+LPS and +LPS, respectively). (B) Barplot representation of the gene expression of IL1B and IL6 in Naive, +LPS, +ATP+ and +ATP+LPS microglia-like obtained by RT-qPCR. (C) Boxplot representation of protein levels of IL-1B in the supernatant of +ATP+LPS vs. +LPS. (D) Boxplot representation the median fluorescence intensity (MFI) values obtained by flow cytometry for CD14, CD68, CD45, and HLA-DR in Naive, +LPS, +ATP and +ATP+LPS. The statistical significance for panels (B), (C), and (D) was calculated using a paired t test (∗p < 0.05, ∗∗p < 0.01). (E) Heatmap representation of the DNA methylation of the differentially methylated positions (DMPs) obtained for the pairwise comparison between all microglia-like conditions. Unsupervised clustering originated eight modules of DMPs (M1-M8). DNA methylation is represented as the Z score of the beta values. The significance cutoff was of p value <0.05 and absolute difference in mean beta values >0.1. (F) Line plots representing the progression of DNA methylation from monocytes (MO) to non-activated microglia-like cells (No LPS) and to activated microglia-like cells (LPS) separated by the presence (+ATP and +ATP+LPS) or absence (Naive, +LPS) of the ATP stimulus. DNA methylation is represented as the mean of the Z score for all DMPs in each module for each group of cells. (G) Selected list of significantly enriched gene ontology (GO) terms for each of the modules of DMPs. The significance of enrichment is represented by the negative of the log of the p value, the enrichment fold change and the number of gene hits. (H) Transcription factor (TF) motif enrichment of a selected list of TFs (p value <0.01) for each module of DMPs. The TFs are annotated by family and the enrichment is represented by the negative of the log of the p value and the percentage of sequences matching the motif. See also Figure S3 and Tables S3 and S4.
Figure 4
Figure 4
The pro-inflammatory response caused by ATP preconditioning is observed at the transcriptional level (A) Volcano plots depicting the differential expression between +ATP and Naive, and between +ATP+LPS and +LPS microglia-like cells. Differentially expressed genes (DEGs) are considered for adjusted p value (FDR) < 0.05. Upregulated DEGs (log2(fold change) > 0) are highlighted in red, and downregulated DEGs (log2(fold change) < 0) in green. (B) Venn diagram of the overlap between the list of genes up and downregulated in the two comparisons. (C) Heatmap representation of the DEGss obtained for the pairwise comparison between all microglia-like conditions. Gene expression is represented as the Z score of the normalized counts. The significance cutoff was of adjusted p value (FDR) < 0.05. Unsupervised clustering divided the DEGs in twelve modules (E1-E12). DEGs associated with differentially methylated positions (DMPs) are highlighted (black lines). (D) Violin plot representation of the mean Z score of the normalized counts of each DEG module in monocytes and in all microglia-like cell groups. (E) Selected list of significantly enriched gene ontology (GO) terms for each of modules of DEGs. The significance of enrichment is represented by the negative of the log of the adjusted p value, the enrichment fold change and the number of gene hits. (F) Transcription factor (TF) enrichment of all significant TF (adjusted p value (FDR) < 0.05) in both differential expression comparisons (+ATP vs. Naive and +ATP+LPS vs. +LPS). Significance is represented by the NES (Normalized Enrichment Score) and the negative of log of the adjusted p value (FDR). See also Figure S3 and Tables S5 and S6.
Figure 5
Figure 5
ATP-mediated preconditioning induces a molecular signature in microglia-like cells that correspond to subsets expanded in epilepsy (A) UMAP representation of the integrated single-cell (sc)RNA-seq object composed of 36,927 microglia cells from epilepsy patients and healthy individuals, distributed across twelve clusters. (B) Dot plot representation of the expression of genes associated with homeostatic (P2RY12 and CX3CR1) and pathological (SPP1 and APOE) microglial phenotypes, and the module score expression of gene signatures characteristic of “disease-associated microglia” (DAM) and “disease inflammatory-macrophages” (DIMs), and the gene expression modules from our analysis. (C) UMAP representation, split by pathological conditions (Epilepsy and Controls), of only the cells from cluster 7 which represent the DIMs. Reclustering of the DIM population resulted in five subclusters (DIM cluster 0–4). The object accounts for 1569 cells from epilepsy patients and 622 cells from controls. (D) Differential composition analysis of each DIM subpopulation in epilepsy patients vs. controls using sccomp. Population expansion (right-shift) or depletion (left-shift) are represented by the credible interval of the slope (95% confidence). The dashed lines represent the default threshold for consideration of significance (−0.2–0.2). Statistical significance is considered for an adjusted p value (FDR) < 0.05 and is highlighted in red. Boxplot representation of the proportion distribution of the five DIM subpopulations in each individual sample from the epilepsy patients and controls groups. Cluster 0 is significantly expanded in epilepsy in comparison to controls. The blue boxes represent the posterior predictive check, which consists of a simulation from the fitted model. The overlap of the stimulated proportions with the real data validates the adequacy of the model. The red triangles represent predicted outliers. (E) Dot plot representation of the expression of the module score of the genes from the DNA methylation and the gene expression modules, the overlapping genes between M8 and E5 (7 genes), E10 (7 genes) and E4 (10 genes), and a selected list of immune-related genes from E5 (P2RX4, LILRB4) and E10 (OTUD1, SIGLEC10). (F) Boxplot representation of the normalized counts (RNA-seq) of four DEGs from the +ATP+LPS vs. +LPS comparison in the four studied microglia-like conditions (Naive, +LPS, +ATP and +ATP+LPS), and belonging to E5 (P2RX4 and LILRB4) and E10 (OTUD1 and SIGLEC10). All four genes are significantly upregulated in +ATP+LPS vs. +LPS (adjusted p value (FDR) < 0.05).

References

    1. Kettenmann H., Kirchhoff F., Verkhratsky A. Microglia: new roles for the synaptic stripper. Neuron. 2013;77:10–18. doi: 10.1016/j.neuron.2012.12.023. - DOI - PubMed
    1. Mittelbronn M., Dietz K., Schluesener H.J., Meyermann R. Local distribution of microglia in the normal adult human central nervous system differs by up to one order of magnitude. Acta Neuropathol. 2001;101:249–255. doi: 10.1007/s004010000284. - DOI - PubMed
    1. Sominsky L., De Luca S., Spencer S.J. Microglia: Key players in neurodevelopment and neuronal plasticity. Int. J. Biochem. Cell Biol. 2018;94:56–60. doi: 10.1016/j.biocel.2017.11.012. - DOI - PubMed
    1. Erblich B., Zhu L., Etgen A.M., Dobrenis K., Pollard J.W. Absence of colony stimulation factor-1 receptor results in loss of microglia, disrupted brain development and olfactory deficits. PLoS One. 2011;6 doi: 10.1371/journal.pone.0026317. - DOI - PMC - PubMed
    1. Zhan Y., Paolicelli R.C., Sforazzini F., Weinhard L., Bolasco G., Pagani F., Vyssotski A.L., Bifone A., Gozzi A., Ragozzino D., Gross C.T. Deficient neuron-microglia signaling results in impaired functional brain connectivity and social behavior. Nat. Neurosci. 2014;17:400–406. doi: 10.1038/nn.3641. - DOI - PubMed