[Preprint]. 2024 Aug 13:2024.08.12.607602.
doi: 10.1101/2024.08.12.607602.

The Aryl Hydrocarbon Receptor Controls IFNγ-Induced Immune Checkpoints PD-L1 and IDO via the JAK/STAT Pathway in Lung Adenocarcinoma

Affiliations

The Aryl Hydrocarbon Receptor Controls IFNγ-Induced Immune Checkpoints PD-L1 and IDO via the JAK/STAT Pathway in Lung Adenocarcinoma

Megan Snyder et al. bioRxiv. .

Update in

Abstract

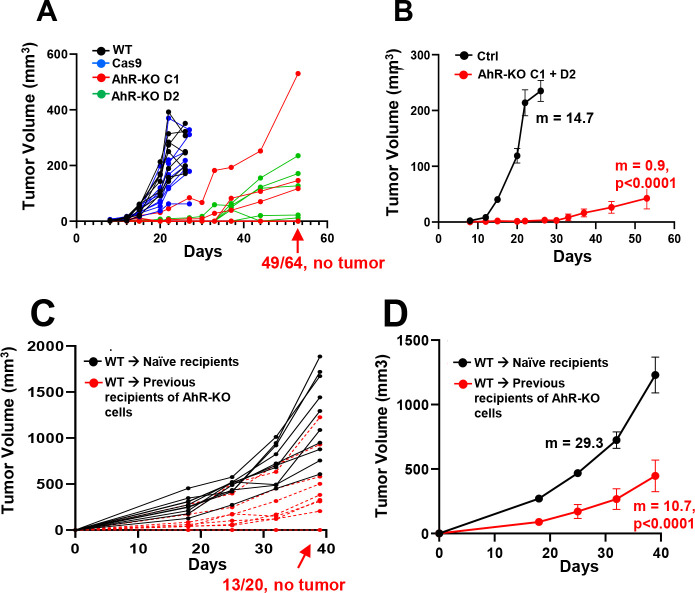
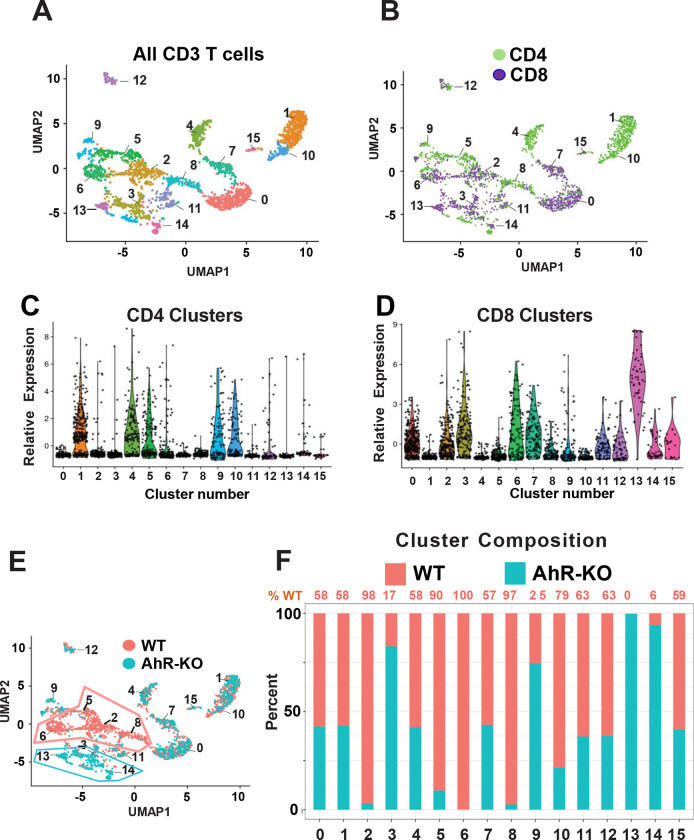
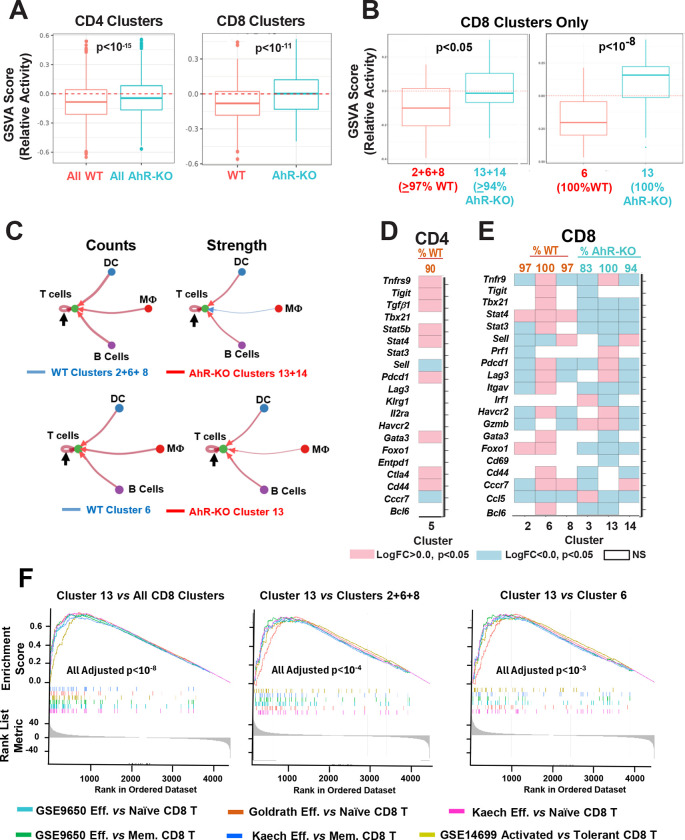
While immunotherapy has shown efficacy in lung adenocarcinoma (LUAD) patients, many respond only partially or not at all. One limitation in improving outcomes is the lack of a complete understanding of immune checkpoint regulation. Here, we investigated a possible link between an environmental chemical receptor implicated in lung cancer and immune regulation, (the aryl hydrocarbon receptor/AhR), a known but counterintuitive mediator of immunosuppression (IFNγ), and regulation of two immune checkpoints (PD-L1 and IDO). AhR gene-edited LUAD cell lines, a syngeneic LUAD mouse model, bulk- and scRNA sequencing of LUADs and tumor-infiltrating leukocytes were used to map out a signaling pathway leading from IFNγ through the AhR to JAK/STAT, PD-L1, IDO, and tumor-mediated immunosuppression. The data demonstrate that: 1) IFNγ activation of the JAK/STAT pathway leading to PD-L1 and IDO1 upregulation is mediated by the AhR in murine and human LUAD cells, 2) AhR-driven IDO1 induction results in the production of Kynurenine (Kyn), an AhR ligand, which likely mediates an AhR→IDO1→Kyn→AhR amplification loop, 3) transplantation of AhR-knockout LUAD cells results in long-term tumor immunity in most recipients. 4) The 23% of AhR-knockout tumors that do grow do so at a much slower pace than controls and exhibit higher densities of CD8+ T cells expressing markers of immunocompetence, increased activity, and increased cell-cell communication. The data definitively link the AhR to IFNγ-induced JAK/STAT pathway and immune checkpoint-mediated immunosuppression and support the targeting of the AhR in the context of LUAD.

Keywords: Aryl Hydrocarbon Receptor; Cancer; Interferon Gamma; Tumor Immunity.


Figures

Figure 1.
Figure 1.. Bulk RNA-seq analysis of AhR-knockout murine and human lung adenocarcinoma cell lines.
RNA was extracted from three sets of CMT167Cas9 control, CMT167AhR-KO, A549Cas9 control, or A549AhR-KO cells, reversed transcribed, and cDNA sequenced using the Illumina NextSeq 2000 platform. Data are presented as counts defined as the number of read pairs aligning uniquely to the genome in proper pairs and assigned to a single Ensembl Gene locus for each gene transcript. A) Heatmap of all genes with 2-fold or greater change in expression with a false discovery rate (FDR) <0.05 after AhR knockout, as comparison with Cas9 controls, in CMT167 (left) or A549 (right) cells. B) Representative cancer- or immune-related genes found to be highly differently downregulated upon AhR knockout in CMT167 and A549 cells.
Figure 2.
Figure 2.. AhR knockout reduces expression of several LUAD-associated genes.
Eight genes associated with LUAD and downregulated in CMT167AhR-KO, as indicated by RNA-seq (Fig. 1), were quantified by RT-qPCR. There were no statistical differences here or elsewhere between gene levels in AhRWT or AhRCas9 cells. Therefore, results from those two control lines were pooled and referred to here and elsewhere as “Ctrl”. Data are presented as means + SE from three independent experiments with duplicates. in each *p<0.05, **p<0.01, ***p<0.001, ****p<0.0001 (Student’s t-test, equal variance).
Figure 3.
Figure 3.. B(a)P, a cigarette smoke constituent, induces PD-L1 and IDO in murine CMT167 cells.
A) Expression of Cd274, Ido1, Ido2, Cyp1a1, and Cyp1b1 mRNA was quantified by RT-qPCR in control and CMT167AhR-KO cells (left two bars in each plot) or after 72 hours of treatment with 10 μM benzo(a)pyrene (B(a)P)(right two bars in each plot). Data from three independent experiments, each in duplicate or triplicate are presented as Gapdh-normalized means + SE. B) Protein extracted from cells treated as in (A) was probed by western immunoblotting for PD-L1 and, as a loading control, β-actin. One of three representative western blots is shown on the left and β-actin-normalized protein band densities are on the right. Band density data are presented as means from three experiments, each in triplicate, + SE. C) The percentage of Kyn+ CMT167WT or CMT167AhR-KO cells treated with vehicle or B(a)P as in (A) was quantified by flow cytometry. Data from two experiments, each in triplicate, are presented as means + SE from. *p<0.05, **p<0.01, ****p<0.0001 (Student’s t-test, equal variance).
Figure 4.
Figure 4.. The AhR mediates IFNγ induction of immune-related genes Cd274, Ido1/2, Jak2, and Stat1 in murine LUAD CMT167 cells.
A) CMT167Ctrl or CMT167AhR-KO cells were untreated or treated with 100 ng/ml IFNγ. Cd274 mRNA was quantified by RT-qPCR 24h later. Ido1, Ido2, Cyp1a1, and Cyp1b1 mRNA was quantified 72h later. Data are from three independent experiments, each in duplicate or triplicate, are expressed as fold change of Gapdh-normalized means + SE. B) CMT167Ctrl or CMT167AhR-KO cells were left untreated or treated for 24h with 100 ng/ml IFNγ and PD-L1 protein expression assayed by western immunoblotting. A representative immunoblot is on the left and β-actin normalized band densities, averaged from three independent experiments, is on the right. (Bands from IFNγ-treated cells reached saturation prior to bands from untreated cells becoming visible). C) CMT167Ctrl or CMT167AhR-KO cells were treated for 24h with IFNγ and IDO1 protein expression assayed by western immunoblotting. A representative immunoblot is on the left and β-actin normalized band densities, averaged from three independent experiments, are on the right. D) CMT167Ctrl or CMT167AhR-KO cells were treated with 1–1000 ng/ml IFNγ for 24h and Kyn released into the media quantified via colorimetric assay. Data are averaged from two independent experiments each in quadruplicate + SE. E) CMT167Ctrl or CMT167AhR-KO cells were treated with 100 ng/ml IFNγ and Jak2 and Stat1 mRNA quantified 24h later. RT-qPCR data are from three independent experiments, each in triplicate, and presented as Gapdh-normalized means + SE. *p<0.05, **p<0.01, ***p<0.001, ****p<0.0001 (Student’s t-test, equal variance).
Figure 5.
Figure 5.. The AhR mediates IFNγ induction of immune-related genes CD274, IDO1, JAK2, STAT1, and STAT3 in human LUAD A549 cells.
A) A549Ctrl or A549AhR-KO cells were untreated or treated with 100 ng/ml IFNγ for 24h and CD274, IDO1, and CYP1B1 expression quantified by RT-qPCR. Data from four experiments, each in triplicate, are represented as fold change of GAPDH-normalized means + SE. B) The percent positive PD-L1+ cells treated as in (A) was quantified by flow cytometry. Data from three experiments, each in triplicate, are presented as mean percent PD-L1+ + SE. C) The baseline percent of Kyn+ A549ctrl and A549AhR-KO cells in two experiments, each in triplicate, was determined by flow cytometry. D) A549Ctrl or A549AhR-KO cells were treated with 0–1000 ng/ml IFNγ for 24h and Kyn release quantified by the Kyn-specific colorimetric assay using a standard Kyn curve. Data from two experiments, each in quadruplicate, are presented as average μM Kyn + SE. E) A549Ctrl or A549AhR-KO cells were left untreated or treated with 100 ng/ml IFNγ for 24h and baseline or 100 ng/ml IFNγ-induced JAK2, STAT1, and STAT3 expression quantified by RT-qPCR. Data from four experiments, each in triplicate, are presented as average fold change of Gapdh-normalized means + SE. *p<0.05, **p<0.01, ***p<0.001, ****p<0.0001 (Student’s t-test, equal variance).
Figure 6.
Figure 6.. AhR deletion in CMT167 cells leads to decreased tumor burden and resistance to re-challenge with wildtype cells.
A) 106 CMT167WT (black lines), CMT167Cas9 (blue lines), CMT167AhR-KO clone C1 (red lines), or CMT167AhR-KO clone D2 (green lines) cells were injected subcutaneously into syngeneic C57BL/6 mice and tumor growth determined over a 53-day period. 100% of mice inoculated with CMT167WT cells grew tumors. No tumors were detected in 49 nine of 64 possible CMT167AhR-KO tumors (77%)(red arrow). B) Growth curves of control (CMT167WT + CMTCas9, n=32) and CMT167AhR-KO (clones C1+D2, n=15) tumors from “A” were averaged. Data are presented as means ± SE, m = slopes. p<0.0001 by non-linear best fit curve comparison. C) Mice that had been inoculated 65 days earlier with CMT167AhR-KO cells (n=10 CMT167AhR-KO clone C1, n=10 CMT167AhR-KO clone D2) and which had not grown tumors were re-challenged with CMT167WT cells and tumor growth tracked over 40 days (red dashed lines). Naïve age-matched mice (n=20) were injected with CMT167WT cells as positive controls (black lines). 100% of naïve mice inoculated with CMT167WT cells grew tumors. No tumors were detected in 13 of 20 mice (65%) injected 65 days previously with CMT167AhR-KO cells (red arrow). D) Growth curves of CMT167WT tumors injected in naïve mice or into previous recipients of CMT167AhR-KO cells were averaged. Data are presented as means + SE. m=slope by linear regression, p<0.0001.
Figure 7.
Figure 7.. CMT167AhR-KO tumors have a higher density of infiltrating CD4+ and CD8+ T cells than CMT167WT tumors.
106 CMT167WT or CMT167AhR-KO cells were injected subcutaneously into syngeneic C57BL/6 mice. Tumors, if present, were excised between two and five weeks after cell injection. Approximately half of each five-week tumor was fixed and sectioned for immunofluorescent studies and the remaining tumor half digested to recover infiltrating leukocytes. A) Representative immunofluorescent images from a total of five CMT167WT and four CMT167AhR-KO five-week tumors (three sections/tumor) stained with DAPI (blue), AhR-specific antibody (green), and CD45-specific antibody (red) are shown. B) Mean density (number of cells/tumor mm2) + SE of CD45+ cells from five CMT167WT and four CMT167AhR-KO five-week tumors. C-E) Tumor infiltrating cells were recovered, counted, and stained for CD45, CD4, CD8, PD-1, and CD44 and analyzed by flow cytometry. Each dot represents the number of cells/mm3 (i.e. cell density) from one tumor. Data were obtained from two to 10 mice per group per week depending on tumors available to excise. *p<0.05, **p<0.01, ***p<0.001, ****p<0.0001 (Multiple comparisons t tests). F). The percent of all CD4+PD-1+ (left) or CD8+PD-1+ (right) T cells that are also CD44high. Data from two independent experiments, six mice/condition/experiment, are presented as the percent positive + SE. **p<0.01, p<0.001 (Student’s t-test, equal variance).
Figure 8.
Figure 8.. scRNA-seq of CD45+ TILs from CMT167WT or CMT167AhR-KO five-week tumors reveals differences in TIL composition.
A) CMT167WT or CMT167AhR-KO tumors excised five weeks after transplantation as in Fig. 7 were digested and sorted by flow cytometry for CD45+ cells. RNA from single cells was then sequenced. Greater than 2000 CD3high T cells were recovered from each sample. Sixteen unique CD3 Seurat clusters (#0–15) were identified using the Immunological Genome Project (ImmGen) reference compendium (43) and the singleR annotation method. B) Clusters were overlayed in green and purple to designate CD4 and CD8 cells respectively. C,D) Violin plots identify distinct CD4 (C) and CD8 (D) T cell populations. E) Clusters were overlayed burnt orange or teal to designate cells from CMT167WT or CMT167AhR-KO tumors, respectively. The orange polygon indicates the relative transcriptomic resemblance of clusters 2, 5, 6, 8 from CMT167WT tumors and the teal polygon indicates the relative transcriptomic similarity of clusters 13 and 14 from CMTAhR-KO tumors. F) Proportion of cells originating from CMT167WT (orange) and CMT167AhR-KO (teal) tumors within each Seurat cluster. The exact percentage of T cells from CMT167WT tumors is presented at the top.
Figure 9.
Figure 9.. Analysis of T cell clusters infiltrating CMT167WT and CMT167AhR-KO tumors.
A) GSVA enrichment scores of functional capabilities in all CD4 (left) or CD8 (right) T cell clusters from CMT167WT (orange) and CMT167AhR-KO (teal) tumors. B) Left: GSVA enrichment scores of functional capabilities of the aggregate of CMT167WT clusters 2+6+8 vs CMT167AhR-KO clusters 13+14. Right: GSVA enrichment scores of functional capabilities in CMT167WT cluster 6 vs CMT167AhR-KO cluster 13. C) The CellChat cell-cell communication platform was used to predict the number (left) and strength (right) of incoming signals from dendritic cells (DC), macrophages (MΦ) and B cells to specific CD8 T cell clusters, each of which comprises >90% of the T cells from the respective CMT167WT or CMT167AhR-KO tumors. The color of the lines represents the tumor source of T cells (red = CMT167AhR-KO; blue = CMT167WT T cells) and the thickness represents the relative number or strength of incoming signals from APC. Top) Incoming signals from APC to the aggregate of CMT167WT clusters 2, 6, and 8 versus incoming signals from APC to the aggregate of CMT167AhR-KO clusters 13 and 14. Bottom) Incoming signals from APC to the CMT167WT clusters 6 versus incoming signals from APC to CMTAhR-KO cluster 13. D, E) MAST (48) was used to analyze immune-related DEGs (p<0.05) between T cell clusters in which >80% of the cells were derived from CMT167WT or CMT AhR-KO tumors. D) DEGs in CMT167WT CD4 cluster 5 as compared with all other clusters. E) DEGs in CMT167WT CD8 clusters 2,6, and 8 and CMT167AhR-KO clusters 3, 13, and 14 as compared with all other clusters. The percentage of cells originating from CMT167WT (orange) or CMTAhR-KO (teal) tumors is restated at the top of the heat maps. F) Upregulated genes in CMT167AhR-KO CD8 cluster 13, relative to genes in: 1) all CD8 clusters (left), 2) the aggregate of CMT167WT CD8 clusters 2+6+8 (middle), and 3) CMT167WT CD8 cluster 6 (right) were determined. GSEA was then used to determine enrichment of these three upregulated cluster 13 gene sets in six sets of published upregulated genes from: 1) activated CD8 T cells as compared with naïve CD8 T cells (three gene sets: GSE9650 Eff. vs Naïve CD8 T cells, Goldrath Eff. vs Naïve CD8 T cells, Kaech Eff. vs Naïve CD8 T cells), 2) activated CD8 T cells as compared with memory CD8 T cells (two gene sets: GSE9650 Eff. vs Mem. CD8 T cells, Kaech Eff. Vs Mem. CD8 T cells), and 3) activated CD8 T cells as compared with tolerant CD8 T cells (one gene set: GSE14699 Activated vs Tolerant CD8 T cells).
Figure 10.
Figure 10.. Working model of IFNγ and AhR-mediated regulation of IDO and PD-L1.
TILs in the TME generate IFNγ which upregulates AhR activity in malignant cells through an as yet unidentified pathway(s). AhR signaling boosts the JAK/STAT pathway up-regulating IDO and PD-L1. IDO contributes to generation of tryptophan-derived AhR ligands including kynurenine resulting in an AhR amplification loop. Kynurenine and other AhR ligands may activate the AhR in immune cells in the TME skewing them towards immunosuppressive phenotypes. PD-L1 on malignant cells suppresses immune effector cell function.

References

    1. Ferlay J., Shin H. R., Bray F., Forman D., Mathers C., and Parkin D. M.. 2010. Estimates of worldwide burden of cancer in 2008: GLOBOCAN 2008. Int J Cancer 127: 2893–2917. - PubMed
    1. Sainz de Aja J., Dost A. F. M., and Kim C. F.. 2021. Alveolar progenitor cells and the origin of lung cancer. J Intern Med 289: 629–635. - PMC - PubMed
    1. Rivera G. A., and Wakelee H.. 2016. Lung Cancer in Never Smokers. Adv Exp Med Biol 893: 43–57. - PubMed
    1. Sezer A., Kilickap S., Gumus M., Bondarenko I., Ozguroglu M., Gogishvili M., Turk H. M., Cicin I., Bentsion D., Gladkov O., Clingan P., Sriuranpong V., Rizvi N., Gao B., Li S., Lee S., McGuire K., Chen C. I., Makharadze T., Paydas S., Nechaeva M., Seebach F., Weinreich D. M., Yancopoulos G. D., Gullo G., Lowy I., and Rietschel P.. 2021. Cemiplimab monotherapy for first-line treatment of advanced non-small-cell lung cancer with PD-L1 of at least 50%: a multicentre, open-label, global, phase 3, randomised, controlled trial. Lancet 397: 592–604. - PubMed
    1. Paz-Ares L. G., Ramalingam S. S., Ciuleanu T. E., Lee J. S., Urban L., Caro R. B., Park K., Sakai H., Ohe Y., Nishio M., Audigier-Valette C., Burgers J. A., Pluzanski A., Sangha R., Gallardo C., Takeda M., Linardou H., Lupinacci L., Lee K. H., Caserta C., Provencio M., Carcereny E., Otterson G. A., Schenker M., Zurawski B., Alexandru A., Vergnenegre A., Raimbourg J., Feeney K., Kim S. W., Borghaei H., O'Byrne K. J., Hellmann M. D., Memaj A., Nathan F. E., Bushong J., Tran P., Brahmer J. R., and Reck M.. 2022. First-Line Nivolumab Plus Ipilimumab in Advanced NSCLC: 4-Year Outcomes From the Randomized, Open-Label, Phase 3 CheckMate 227 Part 1 Trial. J Thorac Oncol 17: 289–308. - PubMed

Publication types