

This is a preprint.
Sequence-encoded Spatiotemporal Dependence of Viscoelasticity of Protein Condensates Using Computational Microrheology
- PMID: 39185151
- PMCID: PMC11343109
- DOI: 10.1101/2024.08.13.607792
Sequence-encoded Spatiotemporal Dependence of Viscoelasticity of Protein Condensates Using Computational Microrheology
Update in
-
Sequence-Encoded Spatiotemporal Dependence of Viscoelasticity of Protein Condensates Using Computational Microrheology.JACS Au. 2024 Nov 11;4(11):4394-4405. doi: 10.1021/jacsau.4c00740. eCollection 2024 Nov 25. JACS Au. 2024. PMID: 39610751 Free PMC article.
Abstract
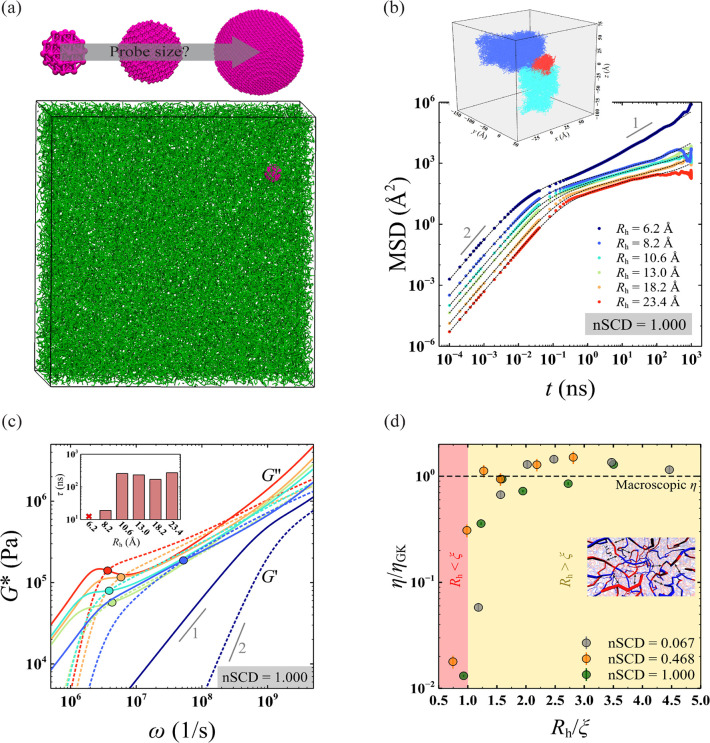
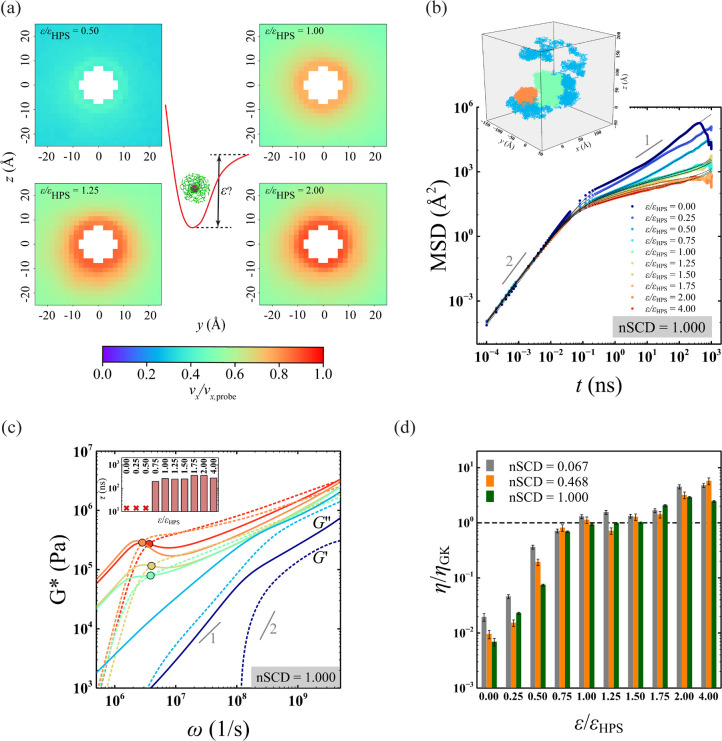
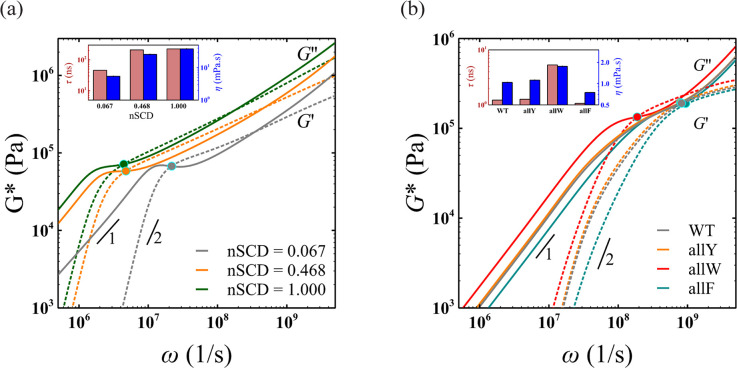
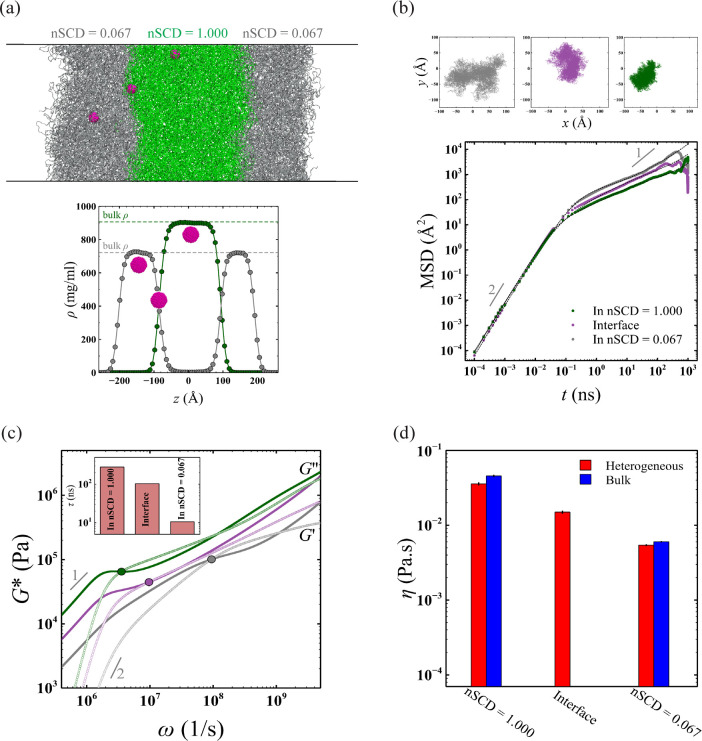
Many biomolecular condensates act as viscoelastic complex fluids with distinct cellular functions. Deciphering the viscoelastic behavior of biomolecular condensates can provide insights into their spatiotemporal organization and physiological roles within cells. Though there is significant interest in defining the role of condensate dynamics and rheology in physiological functions, the quantification of their time-dependent viscoelastic properties is limited and mostly done through experimental rheological methods. Here, we demonstrate that a computational passive probe microrheology technique, coupled with continuum mechanics, can accurately characterize the linear viscoelasticity of condensates formed by intrinsically disordered proteins (IDPs). Using a transferable coarse-grained protein model, we first provide a physical basis for choosing optimal values that define the attributes of the probe particle, namely its size and interaction strength with the residues in an IDP chain. We show that the technique captures the sequence-dependent viscoelasticity of heteropolymeric IDPs that differ either in sequence charge patterning or sequence hydrophobicity. We also illustrate the technique's potential in quantifying the spatial dependence of viscoelasticity in heterogeneous IDP condensates. The computational microrheology technique has important implications for investigating the time-dependent rheology of complex biomolecular architectures, resulting in the sequence-rheology-function relationship for condensates.
Figures
Similar articles
-
Sequence-Encoded Spatiotemporal Dependence of Viscoelasticity of Protein Condensates Using Computational Microrheology.JACS Au. 2024 Nov 11;4(11):4394-4405. doi: 10.1021/jacsau.4c00740. eCollection 2024 Nov 25. JACS Au. 2024. PMID: 39610751 Free PMC article.
-
Viscoelasticity of globular protein-based biomolecular condensates.Chem Sci. 2024 Nov 15;15(47):19795-19804. doi: 10.1039/d4sc03564j. eCollection 2024 Dec 4. Chem Sci. 2024. PMID: 39568893 Free PMC article.
-
Programmable viscoelasticity in protein-RNA condensates with disordered sticker-spacer polypeptides.Nat Commun. 2021 Nov 16;12(1):6620. doi: 10.1038/s41467-021-26733-7. Nat Commun. 2021. PMID: 34785657 Free PMC article.
-
Theories for Sequence-Dependent Phase Behaviors of Biomolecular Condensates.Biochemistry. 2018 May 1;57(17):2499-2508. doi: 10.1021/acs.biochem.8b00058. Epub 2018 Mar 13. Biochemistry. 2018. PMID: 29509422 Review.
-
Application of Microrheology in Food Science.Annu Rev Food Sci Technol. 2017 Feb 28;8:493-521. doi: 10.1146/annurev-food-030216-025859. Epub 2017 Jan 12. Annu Rev Food Sci Technol. 2017. PMID: 28125345 Review.
References
-
- Shin Y.; Brangwynne C. P. Liquid phase condensation in cell physiology and disease. Science 2017, 357 (6357), eaaf4382. - PubMed
-
- Brangwynne, Clifford P.; Tompa P.; Pappu, Rohit V. Polymer physics of intracellular phase transitions. Nature Physics 2015, 11 (11), 899–904.
-
- Patel A.; Lee Hyun O.; Jawerth L.; Maharana S.; Jahnel M.; Hein Marco Y.; Stoynov S.; Mahamid J.; Saha S.; Franzmann Titus M.; et al. A Liquid-to-Solid Phase Transition of the ALS Protein FUS Accelerated by Disease Mutation. Cell 2015, 162 (5), 1066–1077. - PubMed
Publication types
Grants and funding
LinkOut - more resources
Full Text Sources