[Preprint]. 2024 Aug 17:2024.08.14.607813.
doi: 10.1101/2024.08.14.607813.

Identifying a gene signature of metastatic potential by linking pre-metastatic state to ultimate metastatic fate

Affiliations

Identifying a gene signature of metastatic potential by linking pre-metastatic state to ultimate metastatic fate

Jesse S Handler et al. bioRxiv. .

Abstract

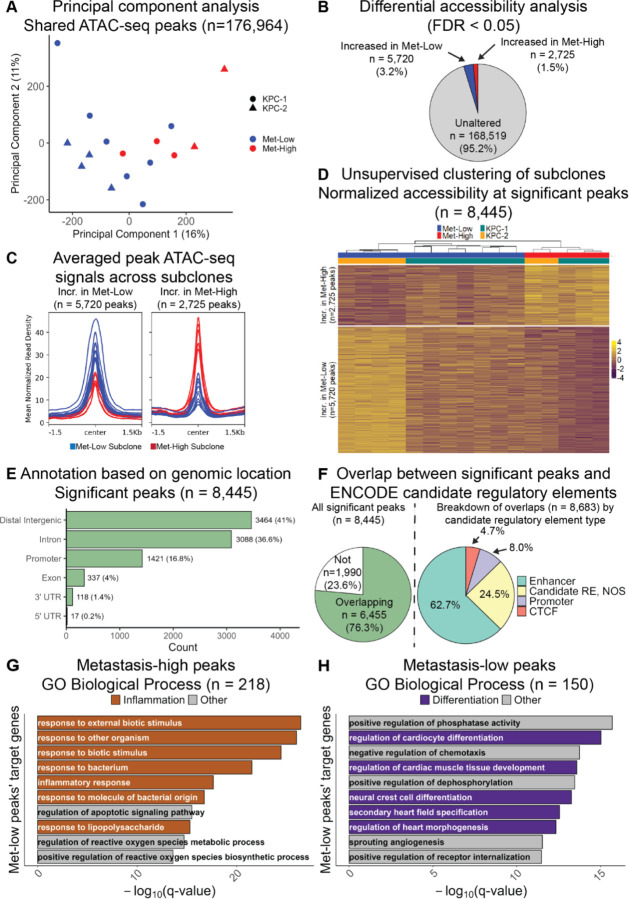
Identifying the key molecular pathways that enable metastasis by analyzing the eventual metastatic tumor is challenging because the state of the founder subclone likely changes following metastatic colonization. To address this challenge, we labeled primary mouse pancreatic ductal adenocarcinoma (PDAC) subclones with DNA barcodes to characterize their pre-metastatic state using ATAC-seq and RNA-seq and determine their relative in vivo metastatic potential prospectively. We identified a gene signature separating metastasis-high and metastasis-low subclones orthogonal to the normal-to-PDAC and classical-to-basal axes. The metastasis-high subclones feature activation of IL-1 pathway genes and high NF-κB and Zeb/Snail family activity and the metastasis-low subclones feature activation of neuroendocrine, motility, and Wnt pathway genes and high CDX2 and HOXA13 activity. In a functional screen, we validated novel mediators of PDAC metastasis in the IL-1 pathway, including the NF-κB targets Fos and Il23a, and beyond the IL-1 pathway including Myo1b and Tmem40. We scored human PDAC tumors for our signature of metastatic potential from mouse and found that metastases have higher scores than primary tumors. Moreover, primary tumors with higher scores are associated with worse prognosis. We also found that our metastatic potential signature is enriched in other human carcinomas, suggesting that it is conserved across epithelial malignancies. This work establishes a strategy for linking cancer cell state to future behavior, reveals novel functional regulators of PDAC metastasis, and establishes a method for scoring human carcinomas based on metastatic potential.


Conflict of interest statement

Competing Financial Interests J.S.H. and R.K. are listed as co-inventors on a provisional patent on the use of this study’s findings for clinical metastasis risk prediction. E.J.F serves on the Scientific Advisory Board of Resistance Bio, as a consultant for Mestag Therapeutics and Merck, and receives research funding from Abbvie Inc and Roche/Genetech outside the scope of this work.

Figures

Figure 1.
Figure 1.. Isolation of primary PDAC subclones with high and low metastatic potential.
(A) Schematic depicting barcode construct. (B) Schematic depicting process for producing barcoded monoclonal KPC lines and experimental design for in vivo metastasis competition assays. (C) Representative photographs and light micrographs of H&E stained FFPE sections. Scale bars indicate 500 μm on low magnification images and 50 μm on high magnification insets. (D) Histograms depicting distributions of tumor clonalities (i.e., the number of unique subclones detected in a given tumor) across the four experiments as denoted by the labels on the right-hand side. (E) Fractions of metastases in which each subclone was observed in each of the four experiments as denoted by the labels on the top and right-hand side. Individual mice represented by points and means across mice represented by bars with error bars representing S.E.M. (D-E) Sample sizes: KPC-1 liver, n = 27 mets across 3 mice; KPC-1 peritoneum, n = 24 mets across 5 mice; KPC-2 liver, n = 46 mets across 5 mice; KPC-2 peritoneum, n = 60 mets across 5 mice).
Figure 2.
Figure 2.. The metastatic potential axis is orthogonal to the normal-to-PDAC and classical-to-basal axes.
(A) Principal component analysis of scaled normalized accessibility of a consensus ATAC-seq peak set. (B) Probabilities of basal-like molecular subtype occupancy for the metastasis-high and metastasis-low subclones based on application of the PurIST classifier to bulk RNA-seq data. A value less than 0.5 indicates likely classical state occupancy.
Figure 3.
Figure 3.. Identifying differentially accessible open chromatin regions specific to metastasis-high and metastasis-low PDAC subclones.
(A) Principal component analysis of normalized accessibility of a consensus peak set. (B) Pie chart illustrating the fraction of total peaks in the consensus peak set found to have significantly different accessibility between metastasis-high and metastasis-low subclones when controlling for parental group status using the generalized linear model feature of DESeq2. An FDR cutoff of 0.05 was used. (C) Averaged ATAC-seq signals for peaks with increased accessibility in metastasis-low subclones (left) and increased accessibility in metastasis-high subclones (right). Each line represents a subclone colored based on its metastatic potential with red indicating high and blue indicating low (D) Heatmap depicting the normalized accessibility for each differential peak (row) for each subclone (column). Subclones were clustered based on Pearson correlation (E) Bar plot depicting the breakdown of genomic locations for the identified significant differentially accessible peaks with respect to gene annotations. Promoter here is defined as the region up to 3 kb upstream of the transcription start site. (F) Pie charts depicting (left) the fraction of significant differentially accessible peaks overlapping candidate regulatory elements (REs) identified by the ENCODE project and (right) the breakdown for the overlaps with respect to the candidate RE type. (G-H) Bar plots demonstrating the most significant GO Biological Process pathways when applying Genomic Regions Enrichment of Annotations Tool (GREAT) to significant peaks with increased accessibility in metastasis-high (G) or metastasis-low (H) subclones. Default settings for GREAT were used. Pathways ranked in order of decreasing significance based on binomial FDR q-value. Pathways meeting a threshold of FDR < 0.05 for both binomial and hypergeometric tests were considered significant.
Figure 4.
Figure 4.. Isolating metastasis-high and metastasis-low defining genes by integrating chromatin accessibility and gene expression.
(A) Heatmap depicting normalized expression for each significantly differentially expressed gene (row) for each subclone (column). An FDR cutoff of 0.05 was used. (B) Scatterplot depicting, for each significantly differentially accessible peak (see Fig. 3), that peak’s differential accessibility between metastasis-high and metastasis-low subclones on the X axis and the nearest gene’s differential expression between metastasis-high and metastasis-low subclones on the Y axis. The color of the peak indicates whether the nearest gene is significantly differentially expressed. (C) Diamond plot depicting the top 50 most downregulated and top 50 most upregulated genes in metastasis-high subclones relative to metastasis-low. The position of the gene label on the Y axis indicates that gene’s differential expression. The genes are arranged by rank from most downregulated in metastasis-high on the left to most upregulated in metastasis-high on the right. Above each gene label are arranged diamonds representing significantly differentially accessible peaks for which the noted gene is the closest gene. The color of the diamond indicates that peak’s normalized differential accessibility between metastasis-high and metastasis-low subclones. (D-E) Signal tracks depicting chromatin accessibility and gene expression of genomic regions containing Il18r1 or Mnx1, representative metastasis-high and metastasis-low genes, respectively, in the metastasis-high and metastasis-low subclones. Asterisks indicate peaks identified to be differentially accessible between metastasis-high and metastasis-low subclones.
Figure 5.
Figure 5.. IL-1 pathway genes are enriched amongst metastasis-high genes and neuroendocrine, motility, and Wnt pathway genes are enriched amongst metastasis-low genes.
(A) The left panel is a dotplot depicting gene ratio and gene count (i.e., the number of metastasis-high genes present in the pathway in question), for all significantly enriched KEGG pathways amongst the metastasis-high genes using an FDR cutoff of 0.05. The right panel is a pie chart depicting the fraction of enriched pathways manually curated as being related to inflammation (B) Bar plot depicting, for all of the genes found within any inflammation-related pathway enriched amongst metastasis-high subclones, the number of inflammation-related pathways in which it is found. (C) The left panel is a dotplot depicting gene ratio and gene count for all significantly enriched GO pathways amongst the metastasis-low genes using an FDR cutoff of 0.05. The right panel is a pie chart depicting the fractions of enriched pathways manually curated as being related to development, motility, or Wnt. (D) Bar plot depicting, for all of the genes found within any pathway within the denoted manually curated groups of pathways (i.e., development, motility, or Wnt), the total number of pathways in that manually curated group of pathways in which that gene is found. (E) Schematic depicting genes defining each of the four metastasis-high and metastasis-low specific gene modules. (F) Scatterplot depicting each gene in the metastasis-high and metastasis-low gene sets. Position on the X axis indicates log2 fold change between primary PDAC and normal pancreas samples. Position on the Y axis depicts log2 fold change between metastasis-high and metastasis-low subclones. Color indicates that gene’s membership in one of the gene modules defined in E.
Figure 6.
Figure 6.. NF-κB and mesenchymal transcription factors regulate the metastasis-high state whereas CDX2 and HOXA13 regulate the metastasis-low state.
(A) Rank-ordered plot of differential binding scores for significant transcription factor motifs using a Bonferroni adjusted p-value cutoff of 0.05. Only motifs in the JASPAR CORE vertebrates nonredundant set expressed in the KPC subclones were considered (n = 511) and only motifs with significant DBSs (n = 499) are being shown here. Motifs are arranged on the x-axis by rank according to their differential binding scores. The y-axis represents the differential binding score, with positive values indicating increased binding in metastasis-high subclones and negative values indicating increased binding in metastasis-low subclones. Motifs with the greatest effect sizes are highlighted. (D) Scatterplot depicting genes included in a targeted shRNA screen with position along the X axis representing mean log2 fold change in abundance amongst all shRNAs targeting each gene between primary tumor and liver conditions and position along the Y axis representing the −log10 weighted combined p-value generated using a linear model. Sample sizes: six primary tumors across six mice and 36 liver metastases across four mice.
Figure 7.
Figure 7.. Metastasis-high and metastasis-low genes define a metastasis signature in human carcinomas.
(A, C-D) Box plots depicting distributions of MetScores with overlaid points representing individual tumors for primary and metastatic samples in the indicated human patient datasets. p-values calculated using two-sided Wilcoxon rank sum tests. (B) Generalized additive model trendlines with 95% confidence intervals for p-values for primary to metastasis MetScore comparisons as a function of the number of genes from the complete metastasis-high and metastasis-low gene sets utilized. For each gene number, 1000 random samplings from the starting gene sets were performed. For each random draw, MetScores were calculated for all samples in the indicated cohort, primary and metastatic samples were compared, and a two-sided Wilcoxon rank sum test was used to generate a p-value. Random draws with zero genes in either the upregulated set or the downregulated set were discarded and not replaced. The p-values for all random draws at all tested gene numbers were used to generate the shown trendline. (E-F) Kaplan-Meier curves depicting overall survival for patients in the noted datasets stratified by MetScore. Patients in each dataset were ranked by MetScore, the top half of which being considered “High” and the bottom half considered “Low”. p-values were calculated using log-rank tests.

References

    1. Dillekas H., Rogers M. S. & Straume O. Are 90% of deaths from cancer caused by metastases? Cancer Med 8, 5574–5576 (2019). 10.1002/cam4.2474 - DOI - PMC - PubMed
    1. Yachida S. et al. Distant metastasis occurs late during the genetic evolution of pancreatic cancer. Nature 467, 1114–1117 (2010). 10.1038/nature09515 - DOI - PMC - PubMed
    1. Al Bakir M. et al. The evolution of non-small cell lung cancer metastases in TRACERx. Nature 616, 534–542 (2023). 10.1038/s41586-023-05729-x - DOI - PMC - PubMed
    1. Yates L. R. et al. Subclonal diversification of primary breast cancer revealed by multiregion sequencing. Nat Med 21, 751–759 (2015). 10.1038/nm.3886 - DOI - PMC - PubMed
    1. Dang H. X. et al. The clonal evolution of metastatic colorectal cancer. Sci Adv 6, eaay9691 (2020). 10.1126/sciadv.aay9691 - DOI - PMC - PubMed

Publication types