[Preprint]. 2024 Aug 15:2024.08.14.608000.
doi: 10.1101/2024.08.14.608000.

Cell type-specific dysregulation of gene expression due to Chd8 haploinsufficiency during mouse cortical development

Affiliations

Cell type-specific dysregulation of gene expression due to Chd8 haploinsufficiency during mouse cortical development

Kristina M Yim et al. bioRxiv. .

Update in

Abstract

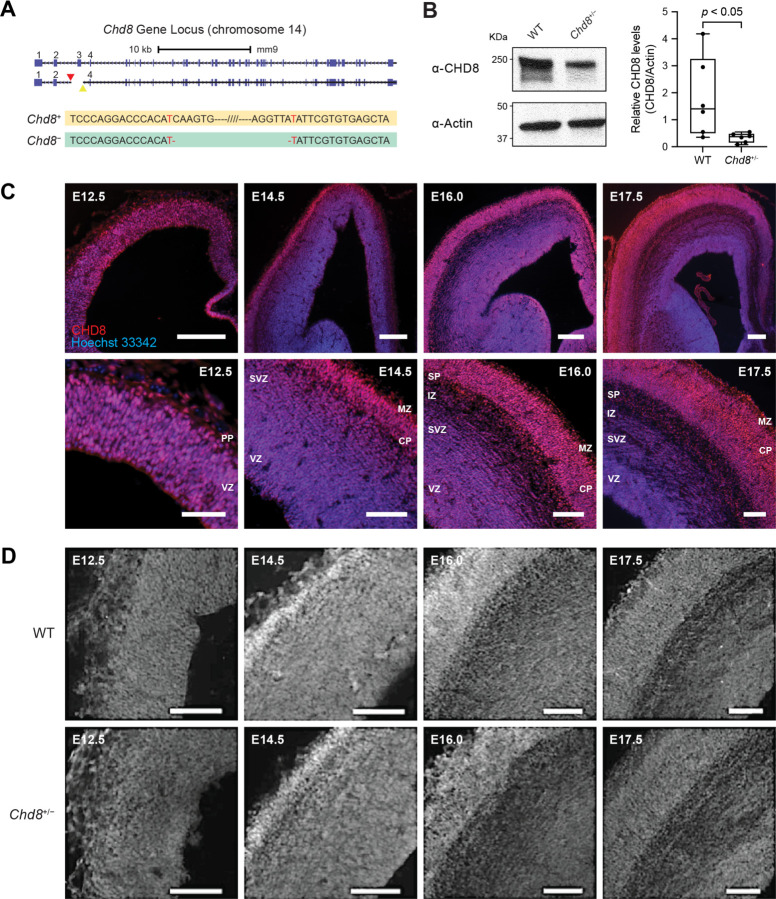
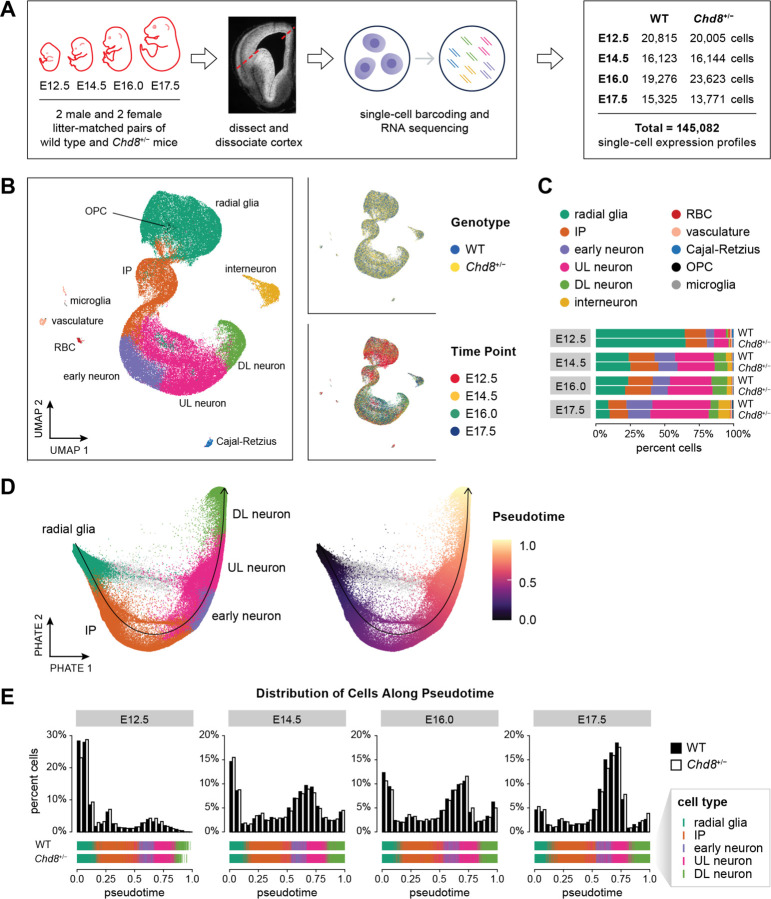
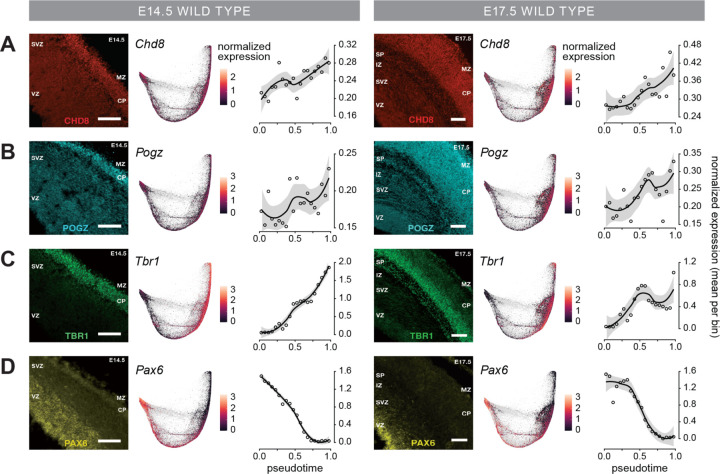
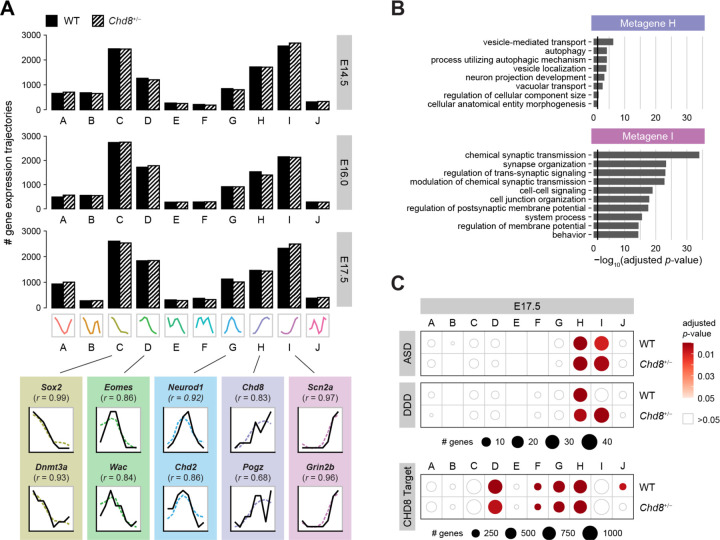
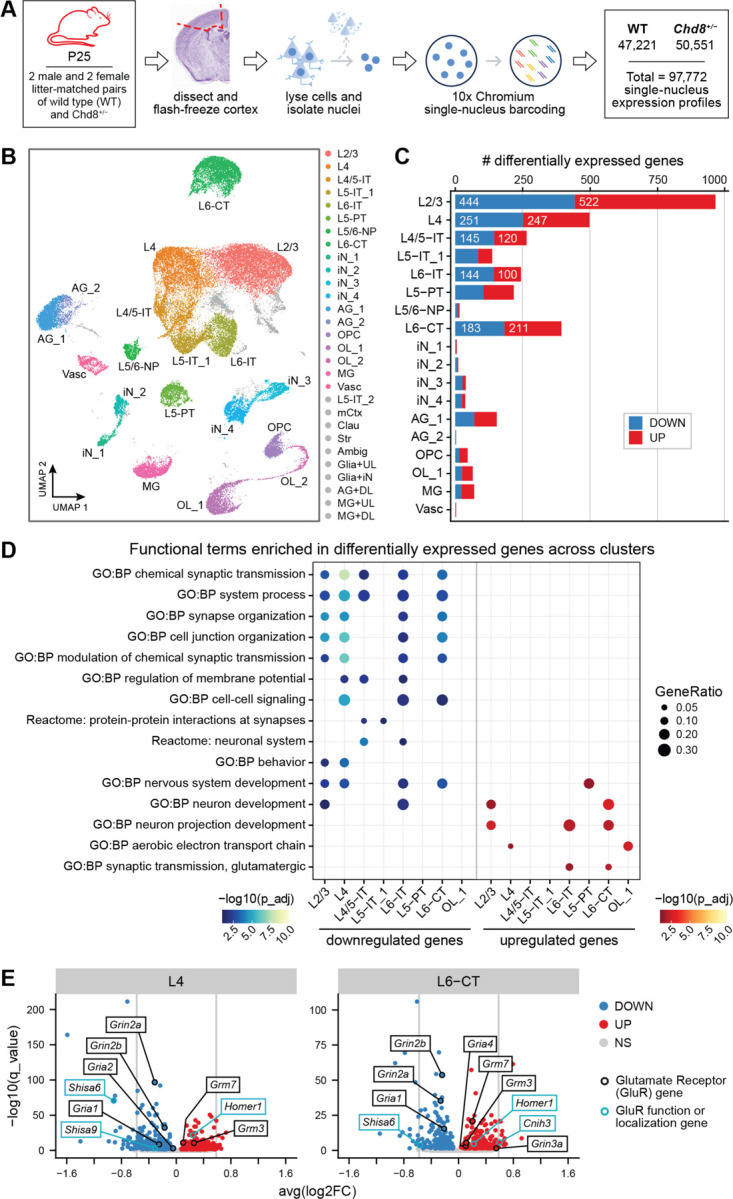
Disruptive variants in the chromodomain helicase CHD8, which acts as a transcriptional regulator during neurodevelopment, are strongly associated with risk for autism spectrum disorder (ASD). Loss of CHD8 function is hypothesized to perturb gene regulatory networks in the developing brain, thereby contributing to ASD etiology. However, insight into the cell type-specific transcriptional effects of CHD8 loss of function remains limited. We used single-cell and single-nucleus RNA-sequencing to globally profile gene expression and identify dysregulated genes in the embryonic and juvenile wild type and Chd8 +/- mouse cortex, respectively. Chd8 and other ASD risk-associated genes showed a convergent expression trajectory that was largely conserved between the mouse and human developing cortex, increasing from the progenitor zones to the cortical plate. Genes associated with risk for neurodevelopmental disorders and genes involved in neuron projection development, chromatin remodeling, signaling, and migration were dysregulated in Chd8 +/- embryonic day (E) 12.5 radial glia. Genes implicated in synaptic organization and activity were dysregulated in Chd8 +/- postnatal day (P) 25 deep- and upper-layer excitatory cortical neurons, suggesting a delay in synaptic maturation or impaired synaptogenesis due to CHD8 loss of function. Our findings reveal a complex pattern of transcriptional dysregulation in Chd8 +/- developing cortex, potentially with distinct biological impacts on progenitors and maturing neurons in the excitatory neuronal lineage.


Conflict of interest statement

Competing interests. The authors declare no competing interests.

Figures

Figure 1.
Figure 1.. Generation and characterization of a Chd8+/− mouse model.
(A) Schematic showing our strategy for constitutive Chd8+/− mouse generation, using CRISPR-Cas9 targeted mutagenesis to delete 1,061 nucleotides (chr14:52,852,109–52,853,169, mm9) that include exon 3, causing a frameshift at alanine 408. The Chd8 gene models (top) and comparison of the targeted sequence (bottom) in the wild type (Chd8+) and disrupted (Chd8-) alleles are shown; nucleotides directly adjacent to the deletion site are colored red. Triangles denote expected guide RNA (gRNA)-directed cleavage sites of the upstream (red) and downstream (yellow) gRNAs (Methods). The dashed line with slashes indicates sequence omitted for clarity. (B) Western blot showing CHD8 and actin expression in male wild type (WT) and Chd8+/− embryonic day (E) 16.0 cortices (left), with quantification of CHD8 expression in the wild type and Chd8+/− E16.0 cortex (right). CHD8 levels were normalized to actin in each replicate (Methods). Whiskers span the minimum and maximum data points, boxes span the interquartile interval, and lines indicate the median. Significance was determined by one-tailed Welch’s t-test (Methods). (C) Coronal sections of wild type embryonic mouse cortex at the indicated stages, stained with anti-CHD8 antibody (red) and Hoechst 33342 (nuclei; blue). Scale bars: 200μm (top), 50μm (bottom). (D) Spatiotemporal expression of CHD8 (grayscale) in coronal sections of the wild type (top) and Chd8+/− (bottom) embryonic mouse cortex collected from littermates at the indicated stages. Scale bar: 100µm. VZ = ventricular zone; SVZ = subventricular zone; IZ = intermediate zone; PP = preplate; SP = subplate; CP = cortical plate; MZ = marginal zone. See also Figures S1–S2 and Table S1.
Figure 2.
Figure 2.. Analysis of embryonic cortical development using single-cell RNA-sequencing in wild type (WT) and Chd8+/− mice.
(A) Study design, including dissection schema and number of cells collected at each time point in each genotype. (B) UMAP embedding of 135,926 cells colored by cell type clusters (left), genotype (top right), and time point (bottom right). Cell type clusters were identified using a graph-based clustering approach, implemented in Seurat, and then annotated based on the expression of known cell type marker genes (Methods). (C) Cell type composition at each time point in each genotype. (D) PHATE embedding of 128,112 cells in the excitatory neuronal lineage, colored by cell type (left) and pseudotime (right). The principal curve through the primary trajectory of the PHATE embedding is shown as a black arrow. A set of 4,457 radial glia-like cells (shown in gray), mostly present at embryonic day (E) 12.5, diverged from the primary trajectory and were excluded from further analyses. (E) Cell type representation along pseudotime. Male and female samples were aggregated for each time point and genotype; the pseudotime trajectory was divided into 20 equally-spaced bins and the percent of cells within each bin is shown, color-coded by genotype (WT: black; Chd8+/−: white). Below each distribution, the position of each cell along pseudotime is plotted as a vertical line, colored according to cell type label. See also Figures S3–S9 and Tables S2–S5. IP = intermediate progenitors; UL = upper-layer; DL = deep-layer; RBC = red blood cells; OPC = oligodendrocyte precursor cells.
Figure 3.
Figure 3.. Inferring spatial and developmental gene expression gradients in the developing mouse cortex using single cell RNA-sequencing.
Expression gradients for (A) Chd8, (B) Pogz, (C) Tbr1, and (D) Pax6 inferred at E14.5 (left) and E17.5 (right). For each time point, the expression of each protein visualized using immunohistochemistry is shown at the left (CHD8 = red; POGZ = cyan; TBR1 = green; PAX6 = yellow; Methods). The inferred expression trajectories for each gene are shown at the right. Male and female samples were aggregated for each time point and genotype, then cells were divided into 20 equally-spaced bins along the pseudotime scale and mean expression per bin was computed for each gene. Mean expression per bin (open circles) is plotted against pseudotime. Smoothed lines are drawn with loess (span = 0.75) and a confidence interval of 0.95. See also Figure 2 and Figure S6. Scale bars: 100μm. VZ = ventricular zone; SVZ = subventricular zone; IZ = intermediate zone; SP = subplate; CP = cortical plate; MZ = marginal zone.
Figure 4.
Figure 4.. Metagenes reveal neurodevelopmental, ASD risk-associated genes, and developmental disorder risk-associated genes with common transcriptional trajectories.
(A) Number of genes assigned to each metagene for each time point and genotype (top), with examples of symbolic aggregate approximation (SAX)-transformed gene expression trajectories assigned to each metagene (bottom). The metagene center is plotted as dashed line, and the SAX-transformed gene expression trajectory is plotted as a solid line. The Pearson correlation (r) between the trajectory and the metagene center is shown for each example. Example trajectories were calculated from embryonic day (E) 17.5 wild type (WT) cortex scRNA-seq data. (B) Gene Ontology Biological Process (GO:BP) terms significantly enriched in metagenes H and I (g:SCS-adjusted p-value < 0.05; black line = g:SCS-adjusted p-value = 0.05; Methods). GO enrichment analysis was performed using g:Profiler, and the resulting list of GO:BP terms was summarized using Revigo. Up to ten of the most significant representative GO:BP terms are shown for each metagene (Methods). (C) Enrichment of autism spectrum disorder risk-associated genes (ASD), the Deciphering Developmental Disorder gene set (DDD), and CHD8 binding targets in the E17.5 wild type mouse cortex for each metagene. The circle size corresponds to the number of genes within each metagene that intersect the given gene set at each time point and genotype. The circle color corresponds to the Benjamini Hochberg-adjusted p-value (one-tailed Fisher exact test; Methods). See also Figures S10–S12 and Tables S6–S9.
Figure 5.
Figure 5.. ASD risk-associated genes and developmental disorder risk-associated genes show convergent expression trajectories in mouse and human cortical development.
(A) PHATE embedding of 30,132 cells from the fetal human cortex at gestational weeks (GW) 17 and 18, colored by cell types as defined in Polioudakis et al., 2019 (left) and by pseudotime (right). vRG = ventral radial glia; oRG = outer radial glia; PgS = S phase cycling progenitors; PgG2M = G2M phase cycling progenitors; ExN = newborn excitatory neurons; ExM = maturing excitatory neurons; ExM-U = upper-layer-enriched maturing excitatory neurons; ExDp1 and ExDp2 = deep-layer excitatory neurons (subclusters 1 and 2). (B) Cell type representation in 20 bins along pseudotime, labeled as in (A). Circle size corresponds to the percent of cells of the indicated cell type per pseudotime bin. (C) Number of genes in each human cortex metagene. (D) Heat map of Pearson correlation (r) between mouse cortex metagene centers (labeled A through J) and human cortex metagene centers. Human metagenes were labeled based on maximal correlation between human and mouse metagene centers and denoted with a prime (′) symbol. (E) Gene Ontology Biological Processes (GO:BP) terms significantly enriched in human metagenes A′, C′, H′, and I′ (g:SCS-adjusted p-value < 0.05; black line = g:SCS-adjusted p-value = 0.05; Methods). GO enrichment analysis was performed using g:Profiler, and the resulting list of GO:BP terms was summarized using Revigo. Up to ten of the most significant representative GO:BP terms are shown for each metagene. (F) Metagene enrichment for autism spectrum disorder risk-associated genes (ASD), the Deciphering Developmental Disorder gene set (DDD), and CHD8 binding targets in the human mid-fetal cortex. Circle size corresponds to the number of genes within each metagene that intersect the given gene set. Circle color corresponds to Benjamini Hochberg-adjusted p-value, one-tailed Fisher exact test. (G) Overlap of ASD risk-associated genes identified in mouse metagenes H and I at embryonic day (E) 16.0 and E17.5, and ASD risk-associated genes identified in human metagenes H′ and I′. The 39 ASD risk-associated genes that were assigned to these metagenes in both species are shown. See also Figure S12 and Tables S6, S9, and S10–S13.
Figure 6.
Figure 6.. Gene sets associated with neurodevelopmental disorders are enriched among dysregulated genes in embryonic day (E) 12.5 radial glia and E17.5 upper-layer neurons.
(A) Number of downregulated (DOWN; blue) and upregulated (UP; red) differentially expressed genes identified in cell types of the primary trajectory at each time point, determined by Monocle 3 (Methods). (B) Volcano plots of Monocle 3 differential expression results for radial glia at embryonic day (E) 12.5 (left) and upper-layer (UL) neurons at E17.5 (right) in the embryonic Chd8+/− cortex, with genes color-coded by differential expression call (downregulated: DOWN, blue; upregulated: UP, red; not significantly different: NS, gray; Methods). Vertical gray lines = ±log2(1.5 fold-change). (C) Intersection between differentially expressed genes in each cell type at E12.5 (left) or E17.5 (right) and CHD8 target genes in the E17.5 wild type mouse cortex, autism spectrum disorder risk-associated genes (ASD), the Deciphering Developmental Disorders gene set (DDD), and FMRP target genes. Significance was determined by one-tailed Fisher exact test, with adjustment for multiple testing (Methods); * = Benjamini Hochberg (BH)-adjusted p-value < 0.05. (D) Gene set enrichment analysis (GSEA) results of differential gene expression in radial glia at E12.5 (left) or upper-layer neurons at E17.5 (right) in the embryonic Chd8+/− cortex, assessing enrichment of neurodevelopmental disorder (NDD)-associated gene sets, including ASD genes, DDD genes, and genes associated with risk for epilepsy, schizophrenia, macrocephaly, or microcephaly, among UP or DOWN genes. For each cell type, input genes are ordered by a ranked list metric calculated from the Monocle 3 output equal to sign(avg_log2FC) * −log10(p-value). Genes in the ranked list that overlap each NDD-associated gene set are shown as horizontal ticks and color-coded by differential expression calls determined by Monocle 3 (red = UP; blue = DOWN; gray = NS; Methods). Dotted line indicates the zero-cross rank separating positive and negative values. * = FDR < 0.05. (E) Intersection between differentially expressed genes in the bulk RNA-seq embryonic mouse cortex dataset at E12.5 or E17.5 and CHD8 target genes, ASD risk-associated genes, DDD genes, and FMRP target genes. Significance was determined by one-tailed Fisher exact test, with adjustment for multiple testing (Methods); * = BH-adjusted p-value < 0.05. (F) GSEA results of differential gene expression in the bulk E12.5 (left) or bulk E17.5 (right) Chd8+/− cortex, assessing enrichment of NDD-associated gene sets. For each time point, input genes are ordered by a ranked list metric calculated from the DESeq2 output equal to sign(avg_log2FC) * −log10(p-value). Genes in the ranked list that overlap each NDD gene set as horizontal ticks and color-coded by differential expression calls determined by DESeq2 (red = UP; blue = DOWN; gray = NS; Methods). Dotted line indicates the zero-cross rank separating positive and negative values. * = FDR < 0.05. See also Figures S13–S15, Table S9, and Tables S16–23. IP = intermediate progenitor; DL = deep-layer.
Figure 7.
Figure 7.. Single-nucleus RNA-sequencing (snRNA-seq) of the juvenile wild type and Chd8+/− cortex reveals dysregulation of synaptic genes across excitatory neuron subtypes.
(A) Schematic of experimental design, showing the dissection schema and number of nuclei collected for each genotype. The representative coronal section of the juvenile mouse brain is from the Allen Mouse Brain Atlas, Nissl-stained (postnatal day 28, position 295; Allen Institute for Brain Science (2004), developingmouse.brain-map.org). (B) UMAP embedding of 66,840 singlet nuclei colored by cell type assignment, with clusters excluded from downstream analyses colored in gray. Nuclei clusters were identified by a graph-based clustering approach that utilizes the Louvain algorithm (Methods). (C) Number of downregulated (DOWN; blue) and upregulated (UP; red) differentially expressed genes per cluster, identified by Monocle 3 (Methods). Only clusters with at least 1 differentially expressed gene are represented. (D) Dot plot showing enrichment of representative functional terms among downregulated and upregulated differentially expressed genes per cluster, restricted to terms enriched across multiple clusters and identified by g:Profiler and Revigo (Methods). Only clusters enriching for functional terms shared across multiple clusters are shown. Dot size corresponds to the ratio of DOWN/UP genes intersecting with the denoted functional term out of all cluster-specific DOWN/UP genes submitted as a query to g:Profiler (GeneRatio; Methods). p_adj = gSCS-adjusted p-value (Methods). (E) Volcano plots of the Monocle 3 differential expression results for L4 (left) and L6-CT (right) clusters, with a subset of genes encoding glutamate receptors (GluRs) or regulators of GluR localization and/or function outlined in black or light blue, respectively (Methods). DOWN = significantly downregulated (blue fill); UP = significantly upregulated (red fill); NS = not significantly different (gray fill); vertical gray lines = ±log2(1.5 fold-change). See also Fig. S16–S21 & S23–S25 and Tables S25–S30 & S33–S34. L = layer of excitatory cortical neuron; IT = intratelencephalic; PT = pyramidal tract; NP = near-projecting; CT = corticothalamic; iN = inhibitory neuron; AG = astroglia; OL = oligodendrocyte; OPC = oligodendrocyte precursor cell; MG = microglia; Vasc = vasculature; mCtx = medial cortex; Clau = claustrum; Str = striatum; Ambig = ambiguous cluster; UL = upper-layer cortical neuron; DL = deep-layer cortical neuron.

References

    1. Sanders S.J., Murtha M.T., Gupta A.R., Murdoch J.D., Raubeson M.J., Willsey A.J., Ercan-Sencicek A.G., DiLullo N.M., Parikshak N.N., Stein J.L., et al. (2012). De novo mutations revealed by whole-exome sequencing are strongly associated with autism. Nature 485, 237–241. 10.1038/nature10945. - DOI - PMC - PubMed
    1. Satterstrom F.K., Kosmicki J.A., Wang J., Breen M.S., Rubeis S.D., An J.-Y., Peng M., Collins R., Grove J., Klei L., et al. (2020). Large-Scale Exome Sequencing Study Implicates Both Developmental and Functional Changes in the Neurobiology of Autism. Cell 180, 568–584.e23. 10.1016/j.cell.2019.12.036. - DOI - PMC - PubMed
    1. Rubeis S.D., He X., Goldberg A.P., Poultney C.S., Samocha K., Cicek A.E., Kou Y., Liu L., Fromer M., Walker S., et al. (2014). Synaptic, transcriptional and chromatin genes disrupted in autism. Nature 515, 209–215. 10.1038/nature13772. - DOI - PMC - PubMed
    1. Iossifov I., O’Roak B.J., Sanders S.J., Ronemus M., Krumm N., Levy D., Stessman H.A., Witherspoon K.T., Vives L., Patterson K.E., et al. (2014). The contribution of de novo coding mutations to autism spectrum disorder. Nature 515, 216–221. 10.1038/nature13908. - DOI - PMC - PubMed
    1. Fitzgerald T.W., Gerety S.S., Jones W.D., Kogelenberg M. van, King D.A., McRae J., Morley K.I., Parthiban V., Al-Turki S., Ambridge K., et al. (2015). Large-scale discovery of novel genetic causes of developmental disorders. Nature 519, 223–228. 10.1038/nature14135. - DOI - PMC - PubMed

Publication types