[Preprint]. 2025 Jan 15:2024.08.13.607784.
doi: 10.1101/2024.08.13.607784.

Experimental and Computational Methods for Allelic Imbalance Analysis from Single-Nucleus RNA-seq Data

Affiliations

Experimental and Computational Methods for Allelic Imbalance Analysis from Single-Nucleus RNA-seq Data

Sean K Simmons et al. bioRxiv. .

Abstract

Single-cell RNA-seq (scRNA-seq) is emerging as a powerful tool for understanding gene function across diverse cells. Recently, this has included the use of allele-specific expression (ASE) analysis to better understand how variation in the human genome affects RNA expression at the single-cell level. We reasoned that because intronic reads are more prevalent in single-nucleus RNA-Seq (snRNA-Seq), and introns are under lower purifying selection and thus enriched for genetic variants, that snRNA-seq should facilitate single-cell analysis of ASE. Here we demonstrate how experimental and computational choices can improve the results of allelic imbalance analysis. We explore how experimental choices, such as RNA source, read length, sequencing depth, genotyping, etc., impact the power of ASE-based methods. We developed a new suite of computational tools to process and analyze scRNA-seq and snRNA-seq for ASE. As hypothesized, we extracted more ASE information from reads in intronic regions than those in exonic regions and show how read length can be set to increase power. Additionally, hybrid selection improved our power to detect allelic imbalance in genes of interest. We also explored methods to recover allele-specific isoform expression levels from both long- and short-read snRNA-seq. To further investigate ASE in the context of human disease, we applied our methods to a Parkinson's disease cohort of 94 individuals and show that ASE analysis had more power than eQTL analysis to identify significant SNP/gene pairs in our direct comparison of the two methods. Overall, we provide an end-to-end experimental and computational approach for future studies.

Keywords: Parkinson’s disease; RNA-seq; Single-cell; allele-specific expression; variant to function.


Conflict of interest statement

Declarations Competing Interests A.M.A., K.G., and J.T.S. are inventors on a licensed, pending international patent application, having serial number PCT/US2021/037226, filed by Broad Institute of MIT and Havard, Massachusetts General Hospital and Massachusetts Institute of Technology, directed to certain subject matter related to the MAS-seq/Kinnex method described in this manuscript. From October 19, 2020, O.R.R. is an employee of Genentech and has equity in Roche. O.R.R. is a co-inventor on patent applications filed by the Broad Institute for inventions related to single-cell genomics. She has given numerous lectures on the subject of single-cell genomics to a wide variety of audiences and, in some cases, has received remuneration to cover time and costs. A.R. is a cofounder of and equity holder in Celsius Therapeutics, an equity holder in Immunitas and was a Scientific Advisory Board member of Thermo Fisher Scientific, Syros Pharmaceuticals, Neogene Therapeutics and Asimov until 31 July 2020. A.R. has been an employee of Genentech (member of the Roche Group) since August 2020 and has equity in Roche. The other authors declare that they have no competing interests.

Figures

Fig. 1
Fig. 1
Study overview a Outline of the computational processing pipeline starting from short-read data to generate allele specific expression information (implemented in Nextflow). b Sample information and processing for data in Figures 2–4.
Fig. 2
Fig. 2
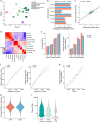
Short-read ASE a UMAP plots of 2 human cortex samples, using 130 base read 2 (see Fig. 2e). b Comparison of percentage of uniquely mapped reads that overlap a heterozygous SNP among genomic regions. c For each sample and each gene with significant allelic imbalance in that sample, comparison of estimated effect size from our snRNA-seq data to estimate from GTEx bulk data. d Heatmap showing the Spearman correlation between droplet-level QC metrics. e Effect of trimming read 2 to different lengths on the proportion of phased UMIs (left) and the number of genes with significant allelic imbalance (right). f Effect of sequencing depth on the number of phased UMIs (left) and genes with significant allelic imbalance (right); analysis of all nuclei irrespective of cell type. g Effect of nuclei number on genes with significant allelic imbalance. h Violin plots showing for each SNP the percentage of UMIs that map to the reference allele. i Violin plots for each gene with at least one phased UMI showing the maximum number of phased UMIs over all SNPs in that gene, with phased VCF, unphased VCF, or no VCF (genotypes estimated from the snRNA-seq data). Without phasing information, it was not possible to combine reads overlapping different SNPs in the same gene into one gene-level measure because the genotype of each SNP is on each allele was unknown. Instead, the maximum number of phased UMIs over all SNPs in that gene is reported, which can be considered as a of measure the maximum power to detect allelic imbalance in that gene.
Fig. 3
Fig. 3
Long-read ASE a Violin plots of the length of reads uniquely mapped to the genome, with median shown. Dotted line shows Illumina 130 base reads. b Downsampling analysis of phased UMIs vs. sequencing depth. c UMAP of the MAS-Seq data. d Comparison of the estimated allelic imbalance effect size in Illumina and MAS-seq for genes that are significantly allelically imbalanced in at least one of the two datasets.
Fig. 4
Fig. 4
Hybrid selection a Proportion of phased UMIs in one of the targeted genes with or without selection at different sequencing depths. b Violin plots of the number of reads in selection data supporting each UMI in targeted and non-targeted genes. c Phased UMIs recovered in the 100 targeted genes at varying sequence depths with and without selection. d Number of genes with significant ASE among the 100 targeted genes at varying sequence depths with and without selection. Dotted line in a, c, and d indicates 20,000 reads per call, vendor recommended sequencing depth. e Violin plots of the percentage of UMIs overlapping each SNP mapping to the allele in the reference genome in the selected data. f Comparison of the estimated allelic imbalance of the selected genes in the selected and non-selected data using all reads. g Comparison of the number of phased UMIs in targeted genes in the non-selected data vs. selected data. h Comparison of the percentage of UMIs phased in each targeted gene in selected vs. non-selected data. Dotted line in g and h represents the line x = y.
Fig. 5
Fig. 5
Parkinson’s disease ASE a UMAP of PD mid-temporal gyrus snRNA-seq data. b Box plot of false positive rate (FPR) analysis. Results of random permutation (100 times, Glutamatergic neurons data) of the alternate vs. reference allele for each individual to generate a dataset with no true allelic imbalance. Shown for each permutation is the percentage of comparisons with p-value < 0.05, which should be around 5% if the method controls the FPR. Boxplots denote the medians and the interquartile ranges (IQRs). The whiskers of each boxplot are the lowest datum still within 1.5 IQR of the lower quartile and the highest datum still within 1.5 IQR of the upper quartile. c Evaluation of methods to detect allelic imbalance for known cis-ieQTLs with downsampling of individuals. d Comparison of the estimated allelic imbalance effect size in the snRNA-seq data for excitatory neurons with our ASE methods to the excitatory neuron interacting eQTL effect size from published bulk RNA-seq data. e Bar plot comparing the number of significant allelic imbalanced SNP/gene pairs for targeted SNPs in each cell type. f Comparison of significant SNP/gene pairs detected by eQTL or allelic imbalance analysis with different number of individuals sampled. Significant hits had a Bonferroni-corrected p-value < 0.05.

Similar articles

References

    1. Oelen R, de Vries DH, Brugge H, Gordon MG, Vochteloo M, single-cell e Qc, Consortium B, Ye CJ, Westra HJ, Franke L, van der Wijst MGP: Single-cell RNA-sequencing of peripheral blood mononuclear cells reveals widespread, context-specific gene expression regulation upon pathogenic exposure. Nat Commun 2022, 13:3267. - PMC - PubMed
    1. Perez RK, Gordon MG, Subramaniam M, Kim MC, Hartoularos GC, Targ S, Sun Y, Ogorodnikov A, Bueno R, Lu A, et al. : Single-cell RNA-seq reveals cell type-specific molecular and genetic associations to lupus. Science 2022, 376:eabf1970. - PMC - PubMed
    1. Yazar S, Alquicira-Hernandez J, Wing K, Senabouth A, Gordon MG, Andersen S, Lu Q, Rowson A, Taylor TRP, Clarke L, et al. : Single-cell eQTL mapping identifies cell type-specific genetic control of autoimmune disease. Science 2022, 376:eabf3041. - PubMed
    1. Ding R, Wang Q, Gong L, Zhang T, Zou X, Xiong K, Liao Q, Plass M, Li L: scQTLbase: an integrated human single-cell eQTL database. Nucleic Acids Res 2024, 52:D1010–D1017. - PMC - PubMed
    1. Kang JB, Raveane A, Nathan A, Soranzo N, Raychaudhuri S: Methods and Insights from Single-Cell Expression Quantitative Trait Loci. Annu Rev Genomics Hum Genet 2023, 24:277–303. - PMC - PubMed

Publication types